Adjustive reciprocal whale optimization algorithm for wrapper attribute selection and classification

Author: Heba F. Eid, Azah Kamilah Muda
Journal: International Journal of Image, Graphics and Signal Processing @ijigsp
Article in issue: 3 vol.11, 2019.
Free access
One of the most difficult challenges in machine learning is the data attribute selection process. The main disadvantages of the classical optimization algorithms based attribute selection are local optima stagnation and slow convergence speed. This makes bio¬-inspired optimization algorithm a reliable alternative to alleviate these drawbacks. Whale optimization algorithm (WOA) is a recent bio-inspired algorithm, which is competitive to other swarm based algorithms. In this paper, a modified WOA algorithm is proposed to enhance the basic WOA performance. Furthermore, a wrapper attribute selection algorithm is proposed by integrating information gain as a preprocessing initialization phase. Experimental results based on twenty mathematical optimization functions demonstrate the stability and effectiveness of the modified WOA when compared to the basic WOA and the other three well-known algorithms. In addition, experimental results on nine UCI datasets show the ability of the novel wrapper attribute selection algorithm in selecting the most informative attributes for classification tasks.
Bio-inspired algorithm, Whale Optimization, Recipro¬cal spiral, Information Gain, Attribute selection, Classification
Short address: https://sciup.org/15016038
IDR: 15016038 | DOI: 10.5815/ijigsp.2019.03.03
Text of the scientific article Adjustive reciprocal whale optimization algorithm for wrapper attribute selection and classification
Published Online March 2019 in MECS
Dimensionality reduction is a critical procedure in pattern recognition and data mining, which contributes towards boosting the performance of a classification model. For high-dimensional datasets, large number of attributes may contain a lot of redundancy [1]. Therefore, attribute selection plays a pivotal role to increase the accuracy of the classification models as well as the learning speed. Attribute selection methods fall under two categories based on the evaluation criteria: Filter approach and wrapper approach. The filter approaches evaluate the new set of attributes depending on the statistical characteristics of the data without involving any machine algorithm. While, wrapper approaches use the classification performance of a predetermined machine algorithm as the evaluation criterion to select the new attributes subset [2, 3].
Attributes selection is a combinatorial problem with a large search space; in which, the search space size grows exponentially along with the total number of attributes. Thus, an exhaustive search for the optimal attributes subset in a high dimensional space is impractical. This motivate for employing bio-inspired algorithms which show higher computational efficiency in avoiding local minima [4-7].
Bio-inspired optimization algorithms draw their inspiration from swarm intelligence, where they imitate the social behavior of natural creatures such as ants [8], fishes [9], bats [10], bees [11] and particle swarms [12]. Swarm-based algorithms incorporate randomness to move from a local search to a global search; as a result, they are more suitable for global optimization and can be applied to various applications including attribute selection problems [13, 14].
Whale optimization algorithm (WOA) is a new bioinspired optimization algorithm proposed by Mirjalili and Lewis [13]. WOA mimics the hunting behavior of the humpback whales. A binary version of the Whale optimization is proposed for selecting the optimal attribute subset [16]. However, as the expansion of the search space dimension; WOA is easily trapped in the local optimum and provide poor convergence. Consequently, a number of variants are proposed to improve the performance of the basic WOA.
Hu et al. proposed different inertia weights with whale optimization algorithm (IWOA). Results show that the IWOAs are very competitive for prediction compared with basic WOA and PSO [17].
Ling et al. developed an enhanced version of WOA using Lѐvy flight trajectory, and called it Levy flight trajectory-based whale optimization algorithm (LWOA). The Lѐvy flight trajectory increases the diversity of the population and enhances its capability of avoiding the local optima [18].
Mafarja and Mirjalili proposed two hybridized attribute selection models based on WOA. In the first model, simulated annealing (SA) algorithm is embedded to WOA algorithm, while in the second model; it is used to improve the best solution found by the WOA algorithm. Experimental results confirm the efficiency of the proposed SA-WOA models for improving the classification accuracy [19].
Following these streams, this paper presents two major contributions:
-
1. Proposing Reciprocal adapted WOA (RaWOA), where reciprocal spiral is adopted to simulate the spiral updating position of the WOA bubble-net behavior.
-
2. Introducing information gain RaWOA (IRaWOA) for solving attributes selection problems. For which, Information gain (IG) is obtained as a preprocessing phase to guarantee a large initialization of the RaWOA algorithm.
The proposed RaWOA is tested under twenty benchmark functions, while IRaWOA is tested on nine UCI datasets. Experimental results demonstrate the efficiency and superiors of the proposed algorithms in most cases.
The rest of this paper is organized as follows: Section II briefly overviews the whale optimization algorithm while Section III presents the details of the proposed RaWOA algorithm. Section IV, discusses the proposed IRaWOA based attribute selection method. Experimentation design, results and comparative analysis occupy the remainder of the paper in Section V. Finally, Section VI summarizes the main findings of this study.
-
II. Whale Optimization Algorithm
Whale optimization algorithm (WOA) is a recent bioinspired optimization algorithm that proposed by [13]. It simulates the Humpback whales social hunting behavior in finding and attacking preys. WOA simulates the double-loops and upward-spirals bubble-net hunting strategy. For which, whales dive down creating bubbles in a spiral shape around the prey and then swim up toward the surface; as shown in figure 1.
To find the global optimum of a given optimization problem using WOA; the search process starts with assuming a set of candidate solutions. Then, the search agents update their positions towards the best search agent until the termination criteria is reached.
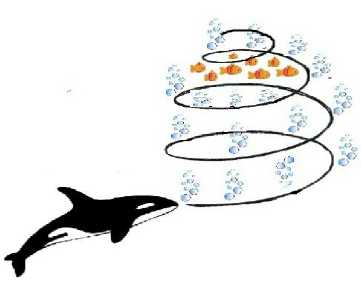
Fig.1. Humpback Whales bubble-net hunting strategy
The mathematical model of the humpback whales behavior is given by equation 1. For which, a probability of 0.5 is assumed to choose between updating either the shrinking encircling or the spiral mechanism during the optimization.
( r r r
X'(t) — A.D, if p < 0.5 .
p is a random number e [0, 1], t is the current iteration, X' is the best solution position vector obtained so far, X is the position vector, b is a constant defining the spiral r shape and l is a random number e [-1, 1] and D is given by:
D = |C.X'(t) -X(t)|(2)
rr
While, A and C are coefficient vectors, calculated by: r
A = 2a. r - a(3)
r
C = 2.r(4)
Where a linearly decreased from 2 to 0 over the course of iterations and r is a random vector e [0, 1].
The distance of the I th whale to the best solution obtained so far is indicated by:
r r r
D'=|X'(t)-X(t)| (5)
r
In order to have a global optimizer, vector A used r random values within 1 < A < —1 ; whereby the agent position is updated according to a randomly chosen agent r
Xrand(t) :
r r r
D'= |C.X ra„ d(t)—X(t)| (6)
^ ^ ^ ^
X(t + 1)=Xrand(t)-4. D (7)
-
III. Proposed Reciprocal Whale Optimization Algorithm
In WOA algorithm, the desirable way to simulate the bubble-net behavior of humpback whales can be divided into two approaches: shrinking encircling mechanism and spiral updating position. For the WOA algorithm a spiral movement of whale around the prey is created to mimic the helix-shaped movement based on equation 1 (b). For which, a logarithmic spiral is chosen for the basic WOA algorithm.
The proposed reciprocal adapted WOA algorithm (RaWOA) aims to employ a reciprocal (hyperbolic) spiral to simulate the spiral updating position of the bubble-net behavior over the course of iterations. The reciprocal spiral using the polar equation of the form r = a/θ, where, r and θ are the radius and azimuthal angle in a polar coordinate system, respectively, and a is real number constant. As θ increases, the spiral winds around the origin and moves closer to it. Figure 2 shows the reciprocal spiral and its hyperbolic counterpart. Thus, for RaWOA, the reciprocal spiral updating position of the whale is given by the following equation:
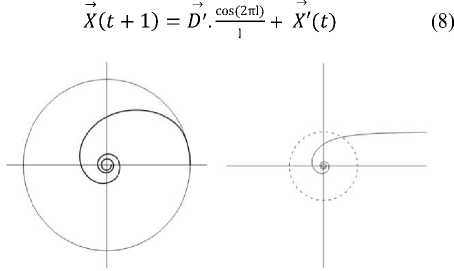
Fig.2. The reciprocal spiral and its hyperbolic counterpart
-
IV. RaWOA for Attribute Selection Problem
In order to solve attribute selection problems, a novel Information gain RaWOA algorithm (IRaWOA) is proposed. The expected value of the information gain (IG) is the mutual information I(C|a) of C and a. As a result, it is the reduction in the entropy of class C achieved by learning the state of attribute a.
At IRaWOA attribute selection algorithm, the whale positions is represented by a binary vector; either “1” indicating the corresponding attribute is selected or ”0” for non selected attributes. IRaWOA adapted IG for performing the population initialization phase; for which, any attributes with a corresponding entropy is represented by “1”; otherwise its value is set to “0”. The IG initialization phase of the IRaWOA guarantee a large initialization; which leads to improve the local searching capability as the agents positions are commonly near to the optimal solution.
Attribute selection has two main objectives; minimizing the number of attributes while maximizing the classification accuracy. Therefore, IRaWOA is used to adaptively search for the best attributes combination, which considers these two objectives. The fitness function adopted to evaluate each individual whale positions is given by:
Fitness =« E r + (1-«) ^ (9)
where Er is the classification error rate of the selected attributes, S * is the number of selected attributes and S is the total number of attributes. α and (1 - α) represent the relative importance of the classification accuracy and the number of selected attributes, α ∈ (0.5, 1].
The pseudo code of IRaWOA is given in Algorithm 1:
Algorithm 1. Pseudo code of IRaWOA Algorithm
Input:
Number of whales n
Number of iterations Max_Iter
Output:
Optimal whale binary position X ∗
-
1: Calculate the entropy of each attribute f ∈ dataset.
2:Initialize the n whales population positions ∈ entropy( f) > 1.
-
3: Initialize a, A and C.
-
4: t=1
-
5: while t ≤ Max_Iter do
-
6: Calculate the fitness of every search agent.
-
7: X ∗ = the best search agent.
-
8: for each search agent do
-
9: Update a,A, C and l
-
10: Generate randomly p ∈ [0,1]
-
11: if p < 0.5 then
-
12: if |A| < 1 then
-
13: update Xt+1 by equation 1(a)
-
14: else if |A| ≥ 1 then
-
15: choose a random search agent Xrand
-
16: update X t+1 by equation 7
-
17: end if
-
18: else if p > 0.5 then
-
19: Update position X t+1 by equation 8
-
20: end if
-
21: Calculate the fitness of every search agent
-
22: Update X ∗ if there is a better solution
-
23: end for
-
24: t=t+1
-
25: end while
-
26: return X ∗
-
V. Experiments and Discussion
The efficiency of the proposed RaWO and IRaWOA algorithm in this study was tested using twenty mathematical functions and nine UCI datasets as given bellow.
A. Results and Analysis of RaWOA
To evaluate the efficiency of the proposed RaWO algorithm; 20 mathematical functions were used. The optimization functions are divided into three categories: unimodal, multimodal and fixed-dimension multimodal; as shown in tables 1-3. Figure 3 shows the graphical presentation of the cost function for F1,F2, F10 and F20 test problem.
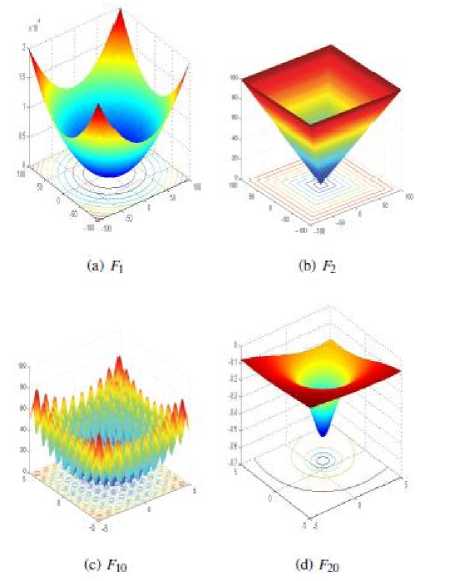
Fig.3. Graphical representations of the benchmark functions
The proposed RaWOA algorithm was run 30 independent times for each optimization functions; and the statistical results; average cost function (av) and standard deviation (std) are recorded. Whereby, RaWOA is compared against the basic WOA, and a swarm based algorithms: Particle Swarm Optimization (PSO) [12], Physics-based algorithm: Gravitational Search Algorithm (GSA) [20] and Evolutionary algorithm: Differential Evolution (DE) [21]; as reported in Table 4. Most of the results of the comparative algorithms are taken from [22].
To evaluate the exploitation capability of RaWOA algorithms, unimodal functions are used as they have only one global optimum. According to Table 4, RaWOA delivers better results than the basic WOA. In particular, RaWOA shows performance enhancing than WOA for functions F1 - F3 and F5 - F7. The large difference in performance of RaWOA versus WOA is directly related to applying the reciprocal spiral to simulate the spiral updating position. Moreover, RaWOA is the most efficient optimizer for functions F1, F2 and F7 and the second best for functions F3 and F5 compared to PSO, GSA and DE. As a result, the RaWOA algorithm can provide a very good exploitation behavior.
On the other hand, multimodal functions allow evaluating the exploration capability of a given optimizer as they possess many local minima. Also, fixed-dimension multi-modal functions present a good optimization challenge as they provide a different search space compared to multimodal functions. Table 4, results indicate that RaWOA shows better performance than the basic WOA in case of functions F8, F10 - F15 and F17 -F20; and produces a similar results to WOA for F9 and F16. While given the second best performance for function F12 and F14. Hence, RaWOA reveals its optimization capability towards the global optimum.
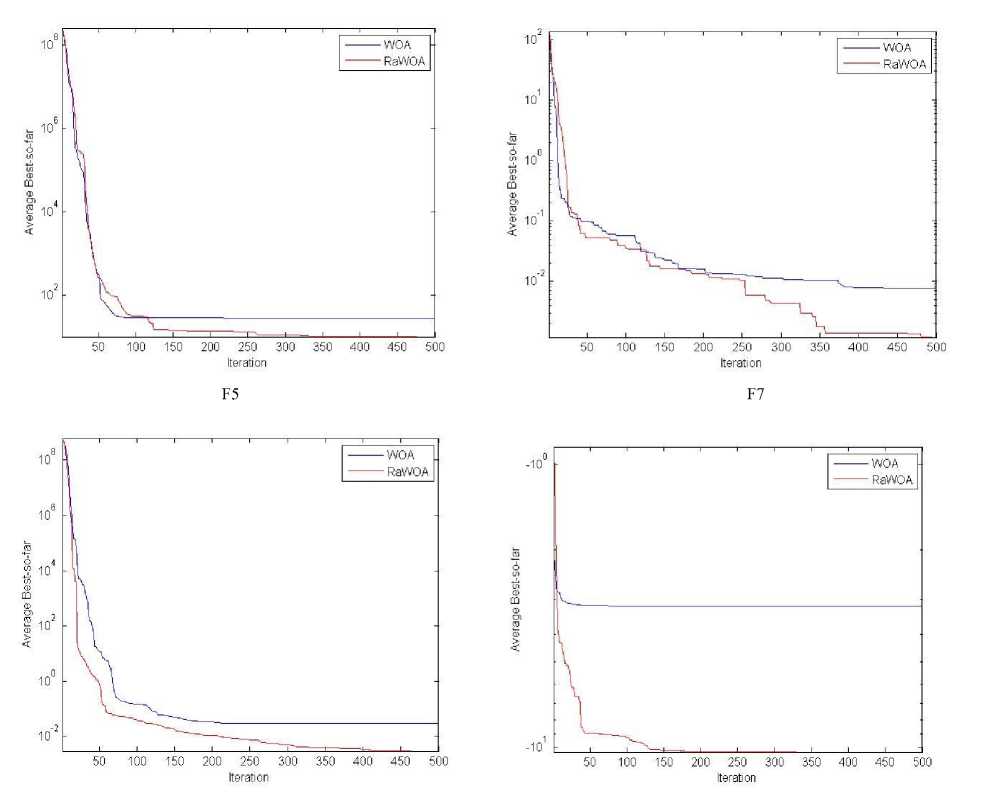
Figure 4 provides the convergence characteristics of the RaWOA and WOA best fitness values versus the iterations over the different runs. As illustrated, the RaWOA algorithm shows a quick convergence from the initial steps of iterations. Consequently, the RaWOA can avoid being trapped into local optimal solutions.
Table 1. Unimodal benchmark
|
Function |
Dim |
Range |
1 mtn |
|
F 1 (x) = У x 2 Z—i i-1 |
30 |
[-100,100] |
0 |
|
F:(vj У lxd + П" |x ( | Z—I ,-1 1 1,-1 |
30 |
[-10,10] |
0 |
|
F.«=E -15,-1 > ' ) |
30 |
[-100,100] |
0 |
|
F 4 (x) = max t [|x t |,1 < i < n] |
30 |
[-100,100] |
0 |
|
^ 5 (х) = У " 1 [100(x (+ i -x , 2)2 + Z—I i-1 (xf - 1)2] |
30 |
[-30,30] |
0 |
|
F 6 (x) = y" ([x , + 0.5])2 Z—I ,-1 |
30 |
[-100,100] |
0 |
|
F / (x) = У ix 4 + random[0,1) ,-1 |
30 |
[-1.28,1.28] |
0 |
B. Results and Analysis of IRaWOA
Several experiments on nine datasets from the UCI machine learning repository [23] are conducted to evaluate the performance of the proposed IRaWO attribute selection algorithm. The nine datasets were chosen to have various numbers of attributes, classes and instances; as shown in Table 5.
F12 F20
Fig.4. Best fitness convergence curves of WOA and RaWOA
For each dataset, the instances are randomly divided into a cross validation manner to three sets: training, validation and test sets. The partitioning of the instances are repeated for 30 independent runs, and for each run the average accuracy (Av_Acc), best accuracy (Best_Acc) and the standard deviation (Std); are recorded on the test sets.
Table 6, illustrates the overall performance of the proposed IRaWOA attribute selection algorithm, to assess the effect of applying IG preprocessing analog with the RaWOA algorithm. In addition, IRaWOA is compared with three state of the art attribute selection methods; genetic algorithm (GA), particle swarm optimization (PSO) and ant colony optimization (ACO).
From Table 6, it is clear that the IRaWOA outperforms these three algorithms in term of the average accuracy on all datasets, except for the Diabetic dataset; and in term of best accuracy except for the Segment dataset. Meanwhile, in all datasets, ICaXWOA shows a better performance in term of standard deviation values, which indicates the stability of the proposed IRaWOA against other attribute selection algorithm. To examine the attribute selection capability of the IRaWOA, it is tested using different well known classifiers SVM, J48 and NB; as shown in tables 7-9. IRaWOA shows a significant superiority for reducing the number of attribute, hence increasing the classification accuracy compared to the full dataset and WOA.
Table 2. Multimodal benchmark.
|
Function |
Dim |
Range |
1 min |
|
F 8 (x) = y - X i SinC/ixJ]) Z—1 ,-i |
30 |
[-500,500] |
-418.98295 |
|
^ 9 (х) = У [x2 - 10соз(2л"х , ) + 10] ,-1 |
30 |
[-5.12,5.12] |
0 |
|
F 10 (x) = -20exp(-0.2 -У x_V со$(2тгх , )) + 20 + е J JlZ-l'-i JlZ-l'-i |
30 |
[-32,32] |
0 |
|
1 V" 1 1—Г" xi - x 4.. У x 1 1 ' '.л' 1 |
30 |
[-600,600] |
0 |
|
F 12 (x) = ^10sin(nyi_) + 1 _ (y , - 1)2[1 + 10sin2(Try i+1 )] + (y „ - 1)2 +1 _ u( x i , 10,100,4) /k(x , - а)тх , > a i , x' + 1 r I 0 - a < xt< a yt = 1 +--- —u(X[,a, k,m) = , , ‘ '1 4 ' I k(-Xi - а)тх , < -a |
30 |
[-50,50] |
0 |
|
F i3 (x) = 0.1[sin2(3n"% i ) + У (x , - 1)2[1 + sin2(3TTX j + 1)] + (x „ - 1)2[1 '-1 л + sin2(2n-)% " ]} + У u(x , , 5,100,4) ,-i |
30 |
[-50,50] |
0 |
Table 3. Fixed-dimension multimodal benchmark
|
Function |
Dim |
Range |
F™,„ |
|
X if^ + ti^) F 1 4 (X) = y1 1 - -1 [а - й1 2 + ЙА+% 4 ] |
4 |
[-5,5] |
0.00030 |
|
F is (x) = ( % 2 - Tz4% 1 2 + 5% 1 - 6) 2 + 10(1 - 3“)COS % 1 + 10 4тт2 я 8tt |
2 |
[-5,5] |
0.398 |
|
F 16 (x) = [1 + (x 1 + % 2 + 1)2(19 - 14x 1 + 3x 2 - 14% + 6x 1 x 2 + 3x 2 )] x [30 + (2x 1 - 3x 2 )2 x (18 - 32x 1 = 12x 2 + 48x 2 - 36x 1 x 2 + 27x 2 )1 |
2 |
[-2,2] |
3 |
|
F i7 (x) = y ; i e < ex P( _y aU(x j - P tj )2) |
3 |
[1,3] |
-3.86 |
|
F i8 (x) = y ; i c t ex P( _y aU(x j - P ij )2) |
6 |
[0,1] |
-3.32 |
|
F i9 (x) = У [( ^ - a i )( ^ - a t ) 7 + cd 1 '-1 |
4 |
[0,10] |
-10.4028 |
|
F 20 (x) = У 1 0 i-1 [( ^ - a i )( ^ - a i ) r + c i ] 1 |
4 |
[0,10] |
–10.5363 |
Table 4. Optimization results obtained for different benchmark functions.
|
Function |
RaWOA |
WOA |
PSO |
GSA |
DE |
|||||
|
av |
std |
av |
std |
av |
std |
av |
std |
av |
std |
|
|
F1 |
2.6562e-56 |
9.84e-51 |
1.41e-30 |
4.91e-30 |
0.000136 |
0.000202 |
2.53e-16 |
9.67e-17 |
8.2e-14 |
5.9e-14 |
|
F2 |
5.755e-32 |
9.95e-22 |
1.06e-21 |
2.39e-21 |
0.042144 |
0.045421 |
0.055655 |
0.194074 |
1.5e-09 |
9.9e-10 |
|
F3 |
2.748e-9 |
1.8689 |
5.3901e-07 |
2.9310e-06 |
70.12562 |
22.11924 |
896.5347 |
318.9559 |
6.8e-11 |
7.4e-11 |
|
F4 |
0.5389 |
0.2921 |
0.072581 |
0.39747 |
1.086481 |
0.317039 |
7.35487 |
1.741452 |
0 |
0 |
|
F5 |
9.9406 |
0.1625 |
27.86558 |
0.763626 |
96.71832 |
60.11559 |
67.54309 |
62.22534 |
0 |
0 |
|
F6 |
0.0013709 |
0.0038467 |
3.116266 |
0.532429 |
0.000102 |
8.28e-05 |
2.5e-16 |
1.74e-16 |
0 |
0 |
|
F7 |
2.9026e-05 |
0.001073 |
0.001425 |
0.001149 |
0.122854 |
0.044957 |
0.089441 |
0.04339 |
70.00463 |
0.0012 |
|
F8 |
-12569 |
193.8 |
-5080.76 |
695.7968 |
-4841.29 |
1152.814 |
-2821.07 |
493.0375 |
-11080.1 |
574.7 |
|
F9 |
0 |
0 |
0 |
0 |
46.70423 |
11.62938 |
25.96841 |
7.470068 |
69.2 |
38.8 |
|
F10 |
8.8818e-16 |
2.0512e-15 |
7.4043 |
9.897572 |
0.276015 |
0.50901 |
0.062087 |
0.23628 |
9.7e-08 |
4.2e-08 |
|
F11 |
0 |
0 |
0.000289 |
0.00158 |
0.009215 |
0.007724 |
27.70154 |
5.040343 |
0 |
0 |
|
F12 |
0.0014063 |
0.0013841 |
0.339676 |
0.214864 |
0.006917 |
0.026301 |
1.799617 |
0.95114 |
7.9e-15 |
8e-15 |
|
F13 |
0.035629 |
0.012551 |
1.889015 |
0.266088 |
0.006675 |
0.008907 |
8.899084 |
7.126241 |
5.1e-14 |
4.8e-14 |
|
F14 |
0.00040263 |
8.1233e-05 |
0.000572 |
0.000324 |
0.000577 |
0.000222 |
0.003673 |
0.001647 |
4.5e-14 |
0.00033 |
|
F15 |
0.39789 |
5.9489e-05 |
0.397914 |
2.7e-05 |
0.39789 |
0 |
0.39789 |
0 |
0.39789 |
9.9e-09 |
|
F16 |
3 |
3.5077e-05 |
3 |
4.22e-15 |
3 |
1.33e-15 |
3 |
4.17e-15 |
3 |
2e-15 |
|
F17 |
-3.8624 |
0.0037661 |
-3.85616 |
0.002706 |
-3.8628 |
2.58e-15 |
-3.8628 |
2.29e-15 |
N/A |
N/A |
|
F18 |
-3.3533 |
0.01788 |
-3.2202 |
0.098696 |
-3.26634 |
0.060516 |
-3.31778 |
0.023081 |
N/A |
N/A |
|
F19 |
-10.454 |
0.81151 |
-8.18178 |
3.829202 |
-8.45653 |
3.087094 |
-9.68447 |
2.014088 |
-10.403 |
3.9e-07 |
|
F20 |
-10.536 |
0.08496 |
-9.34238 |
2.414737 |
-9.95291 |
1.782786 |
-10.536 |
2.6e-15 |
-10.536 |
1.9e-07 |
Table 5. Datasets Description
|
Dataset |
Attribute no. |
Instances no. |
Classes no. |
|
Australian |
14 |
690 |
2 |
|
German Credit |
24 |
1000 |
2 |
|
Sonar |
60 |
208 |
2 |
|
Zoo |
17 |
101 |
7 |
|
NSL-KDD |
41 |
5960 |
4 |
|
Diabetic |
19 |
1151 |
2 |
|
Heart Disease |
13 |
270 |
2 |
|
Segment |
19 |
2310 |
7 |
|
Liver Disorders |
6 |
345 |
2 |
Table 6. Performance Results of IRaWOA, GA, PSO and ACO attribute Selection algorithm on different Datasets
|
Dataset |
IRaWOA |
WOA |
GA |
PSO |
ACO |
|
|
Australian |
Av_Acc |
0.8637 |
0.8256 |
0.8289 |
0.8246 |
0.8390 |
|
Std |
0.0201 |
0.0202 |
0.0228 |
0.0731 |
0.0240 |
|
|
Best_Acc |
0.8846 |
0.8656 |
0.8553 |
0.8744 |
0.8530 |
|
|
German Credit |
Av_Acc |
0.7436 |
0.7140 |
0.7133 |
0.6889 |
0.7081 |
|
Std |
0.0054 |
0.0367 |
0.0200 |
0.0207 |
0.0168 |
|
|
Best_Acc |
0.7510 |
0.7490 |
0.7451 |
0.7333 |
0.7240 |
|
|
Sonar |
Av_Acc |
0.8942 |
0.8543 |
0.7540 |
0.7857 |
0.8130 |
|
Std |
0.0126 |
0.0341 |
0.0691 |
0.0346 |
0.0255 |
|
|
Best_Acc |
0.9231 |
0.9188 |
0.8720 |
0.8571 |
0.8751 |
|
|
Zoo |
Av_Acc |
0.9998 |
0.9569 |
0.8550 |
0.9512 |
0.9406 |
|
Std |
0.0005 |
0.0278 |
0.0690 |
0.0646 |
0.0324 |
|
|
Best_Acc |
0.9999 |
0.9647 |
0.9601 |
0.9714 |
0.9730 |
|
|
NSL-KDD |
Av_Acc |
0.9540 |
0.9318 |
0.9051 |
0.9241 |
0.9260 |
|
Std |
0.0009 |
0.0214 |
0.0349 |
0.0251 |
0.0351 |
|
|
Best_Acc |
0.9550 |
0.9408 |
0.9252 |
0.9581 |
0.9411 |
|
|
Diabetic |
Av_Acc |
0.6931 |
0.6031 |
0.7504 |
0.6931 |
0.6451 |
|
Std |
0.0151 |
0.0393 |
0.0169 |
0.0347 |
0.0394 |
|
|
Best_Acc |
0.7049 |
0.6231 |
0.7748 |
0.6897 |
0.6681 |
|
|
Heart Disease |
Av_Acc |
0.8296 |
0.7633 |
0.7801 |
0.7700 |
0.8260 |
|
Std |
0.0037 |
0.0209 |
0.0210 |
0.0360 |
0.0240 |
|
|
Best_Acc |
0.8444 |
0.7801 |
0.9102 |
0.9059 |
0.8871 |
|
|
Segment |
Av_Acc |
0.9716 |
0.9515 |
0.9150 |
0.9431 |
0.9152 |
|
Std |
0.0019 |
0.0043 |
0.0177 |
0.0147 |
0.0167 |
|
|
Best_Acc |
0.9723 |
0.9605 |
0.9515 |
0.9521 |
0.9462 |
|
|
Liver Disorders |
Av_Acc |
0.7289 |
0.7004 |
0.6780 |
0.7030 |
0.6120 |
|
Std |
0.0014 |
0.1185 |
0.0524 |
0.1263 |
0.0460 |
|
|
Best_Acc |
0.7589 |
0.7354 |
0.7373 |
0.7573 |
0.6551 |
Table 7. SVM Comparison Results of IRaWOA attribute selection Algorithm on different Datasets
|
Dataset |
All |
WOA |
IRaWOA |
|||
|
Attributes no. |
F-measure |
Attributes no. |
F-measure |
Attributes no. |
F-measure |
|
|
Australian |
14 |
0.5565 |
8 |
0.6985 |
4 |
0.8521 |
|
German Credit |
24 |
72.400 |
12 |
0.7450 |
12 |
0.7830 |
|
Sonar |
60 |
0.6346 |
38 |
0.6682 |
25 |
0.6875 |
|
Zoo |
17 |
0.9108 |
12 |
0.9307 |
5 |
0.9701 |
|
NSL-KDD |
41 |
0.7698 |
28 |
0.8602 |
18 |
0.9573 |
|
Diabetic |
19 |
0.5690 |
15 |
0.6342 |
6 |
0.7149 |
|
Heart Disease |
13 |
0.5592 |
9 |
0.8333 |
7 |
0.8370 |
|
Segment |
19 |
0.6450 |
13 |
0.8082 |
5 |
0.9730 |
|
Liver Disorders |
6 |
0.5942 |
4 |
0.6010 |
4 |
0.7971 |
Table 8. J48 Comparison Results of IRaWOA attribute selection Algorithm on different Datasets
|
Dataset |
All |
WOA |
IRaWOA |
|||
|
Attributes no. |
F-measure |
Attributes no. |
F-measure |
Attributes no. |
F-measure |
|
|
Australian |
14 |
0.8565 |
8 |
0.8362 |
4 |
0.8790 |
|
German Credit |
24 |
72.200 |
12 |
0.7240 |
12 |
0.8280 |
|
Sonar |
60 |
0.7115 |
38 |
0.7115 |
25 |
0.8903 |
|
Zoo |
17 |
0.9207 |
12 |
0.9209 |
5 |
0.9603 |
|
NSL-KDD |
41 |
0.9582 |
28 |
0.9798 |
18 |
0.9817 |
|
Diabetic |
19 |
0.6359 |
15 |
0.6299 |
6 |
0.7132 |
|
Heart Disease |
13 |
0.7778 |
9 |
0.8296 |
7 |
0.8481 |
|
Segment |
19 |
0.9645 |
13 |
0.9636 |
5 |
0.9822 |
|
Liver Disorders |
6 |
0.6869 |
4 |
0.6289 |
4 |
0.8459 |
Table 9. NB Comparison Results of IRaWOA attribute selection Algorithm on different Datasets
|
Dataset |
All |
WOA |
IRaWOA |
|||
|
Attributes no. |
F-measure |
Attributes no. |
F-measure |
Attributes no. |
F-measure |
|
|
Australian |
14 |
0.7710 |
8 |
0.7637 |
4 |
0.8681 |
|
German Credit |
24 |
75.500 |
12 |
0.7330 |
12 |
0.7930 |
|
Sonar |
60 |
0.6682 |
38 |
0.6923 |
25 |
0.7269 |
|
Zoo |
17 |
0.96039 |
12 |
0.9505 |
5 |
0.9801 |
|
NSL-KDD |
41 |
0.6355 |
28 |
0.6012 |
18 |
0.6432 |
|
Diabetic |
19 |
0.5638 |
15 |
0.5656 |
6 |
0.5912 |
|
Heart Disease |
13 |
0.8518 |
9 |
0.8259 |
7 |
0.8848 |
|
Segment |
19 |
0.8038 |
13 |
0.7969 |
5 |
0.8709 |
|
Liver Disorders |
6 |
0.5536 |
4 |
0.4986 |
4 |
0.6246 |
References Adjustive reciprocal whale optimization algorithm for wrapper attribute selection and classification
- Xue, B., Zhang, M., Browne, W., Yao, X., “A survey on evolutionary computation approaches to feature selec¬tion.”, IEEE Transactions on Evolutionary Computation , vol.20, pp. 606-626 , 2016.
- Yu, L., Liu, H.m “Feature selection for high-dimensional data: a fast correlation-based filter solution.” In Proc. of the twentieth International Conference on Machine Learning, pp. 856–863 , 2003.
- Kim, Y., Street, W., Menczer, F.,” Feature selection for unsupervised learning via evolutionary search.”, In Proc. of the Sixth ACM SIGKDD International Conference on Knowledge Discovery and Data Mining, pp. 365–369 , 2000.
- Crepinek, M., Liu, S.H., Mernik, M., “Exploration and exploitation in evolutionary algorithms: a survey.” ACM Comput Surv (CSUR) , vol. 45, pp. 35–42, 2013.
- Gang, X., “ An adaptive parameter tuning of particle swarm optimization algorithm. Appl Math Comput, vol. 219, pp.4560-4569 , 2013.
- Zhang, Y., Wang, S., Ji, G.,”A comprehensive survey on particle swarm optimization algorithm and its appli¬cations.”, Math Probl Eng doi:10.1155/2015/931256 , 2015.
- Nesmachnow, S., “An overview of metaheuristics: accu¬rate and efficient methods for optimisation.”, International Journal of Metaheuristics, vol. 3, pp. 320–347, 2014.
- Dorigo, M., Birattari, M.,“Ant colony optimization.” En-cyclopedia of Machine Learning, Springer , 2010.
- Miller, P., “The Smart Swarm: How Understanding Flocks, Schools, and Colonies Can Make Us Better at Communicating, Decision Making, and Getting Things done.”, Avery Publishing Group, Inc. , 2010.
- Yang, X.S.,”Bat algorithm for multi-objective optimisa-tion.”, Int. J. Bio-Inspired Comput. Vol. 3, pp. 267–274 , 2011.
- Pham, D., Ghanbarzadeh, A., Koc, E., Otri, S., Rahim, S., Zaidi, M., ”The bees algorithm. Manufacturing Engineering Centre, Cardiff University, 2005.
- Eberhart, R., Kennedy, J.,” A new optimizer using parti¬cle swarm theory.” In Proc. of the Sixth International Symposium on Micro Machine and Human Science, pp. 39–43. Nagoya, Japan ,1995.
- Gandomi, A.H., Yang, X., Talatahari, S., Alavi, A.H.,”Metaheuristic Algorithms in Modeling and Optimiza¬tion.”, Metaheuristic Application in Structures and Infras¬tructures , 2013.
- Yang, X.S., “ Random walks and optimization. In: Nature-inspired optimization algorithms, first edition edn. Elsevier, Oxford, 2014.
- Mirjalili, S., Lewis, A. “ The whale optimization algo¬rithm. Adv Eng Softw”, vol. 95, pp. 51–67, 2016.
- Heba F. Eid , “Binary whale optimization: an effective swarm algorithm for feature selection” International Journal of Metaheuristics, Vol 7, pp.67–79, 2018.
- Hu, H., Bai, Y., Xu, T.,”Improved whale optimization algorithms based on inertia weights and theirs applica-tions.”, International Journal of Circuits, Systems and Signal Processing , vol. 11, pp. 12–26, 2017.
- Ling, Y., Zhou, Y., Luo, Q., “ Levy flight trajectory-based whale optimization algorithm for global optimization.”, IEEE Access pp. 6168 – 6186, 2017.
- Mafarja, M.M., Mirjalili, S.,”Hybrid whale optimization algorithm with simulated annealing for feature selection.” Neurocomputing, vol. 260, pp. 302–312 , 2017.
- Rashedi, E., Nezamabadi-Pour, H., Saryazdi, S., “Gsa: a gravitational search algorithm.”, Information Science pp. 2232-2248 , 2009.
- Storn, R., Price, K..”Differential evolutiona simple and efficient heuristic for global optimization over continu¬ous spaces”., J. Glob Optim, pp. 341-359, 1997.
- Mirjalili, S., Mirjalili, S., Lewis, A., “Grey wolf opti¬mizer.” Advances in Engineering Software, vol. 69, pp. 46-61, 2014.
- Frank, A., Asuncion, A., Uci machine learning reposi¬tory , 2010.
