Administration of regional budgets in 2016: the crisis has not been overcome

Author: Povarova Anna Ivanovna
Journal: Economic and Social Changes: Facts, Trends, Forecast @volnc-esc-en
Section: Public finance
Article in issue: 4 (52) т.10, 2017.
Free access
Russian Prime Minister Dmitry Medvedev speaking in the State Duma with the report on the work of the Russian Government claimed that regional budget shortage has been eliminated and the number of regions with public debt exceeding revenues has been reduced [4]. This discussion makes the problem of proper assessment of sub-federal budgets relevant. Their deficit administration and accumulation of debts have become a steady trend in recent years. The past year has been marked by increased revenues and spending cuts, but even under these conditions most regions were unable to implement balanced budget policy: 54 constituent entities of the Russian Federation were running deficits with debts exceeding half their own revenues, which caused the weakening of investment and consumer demand. The situation is exacerbated by the decline in energy prices, destabilization of the Federal budget and a general decline in business activity in the country. The federal policy is also tightening: since 2014, there has been a steady decrease in financial support for territories, which forces regional authorities to address the issues of financing through local sources of revenues...
Budget of rf constituent entity, revenues, expenditures, deficit, loans, public and municipal debt, debt load, increase in budget incomes
Short address: https://sciup.org/147223957
IDR: 147223957 | UDC: 336.146 | DOI: 10.15838/esc.2017.4.52.8
Text of the scientific article Administration of regional budgets in 2016: the crisis has not been overcome
Budget administration is the most important stage of the budget process, which carries out the distribution and use of budget resources necessary f or sustainable socioeconomic life of the country and its regions. Issues of budget administration can be associated with improper planning, untimely tax payments, flawed system of tax incentives for business, and intermittent inter-budgetary regulation. V.V. Gamukin distinguishes structural risks for budget revenues and expenditures. Thus, the monoanalogue base makes the budget dependent on an economic sector where basic tax is formed. The risk of cost structure may lie in the priority of the current budget at the expense of the development budget [5]. Issues related to administration of budgets of the RF constituent entities become clear when analyzing of the actual budget parameters.
In 2016, Russian economy did not demonstrate any significant signs of recovery as evidenced by a further decline in GDP, investment and consumer demand ( Fig. 1 ).
Forty percent of the RF constituent entities have demonstrated a decline in investment in fixed capital for two or three years in a row. This process has affected mainly large industrial and agricultural centers indicating a general decline in business activity in the country.
The continuing crisis phenomena are also confirmed by the population’s living standards: in 2014, 27 regions experienced a decline in real incomes, in 2016, however, the figure rose to 78; the number of Russians with incomes below the living wage increased from 16 to 20 million comprising 13.5% of the total population.
The economic crisis also affected the state of the budget system, especially its key component – federal budget: the revenues have been declining for two years due to a 35% shortfall of oil and gas revenues as a result of collapse in world oil prices ( Fig. 2 ).
In the changed economic conditions, poor diversification of the federal treasury revenue structure resulted in a rise of deficit which reached 3 trillion rubles. To cover
Figure 1. GDP, investments and retail turnover growth rate in 2012–2016, % to the previous year in comparable prices
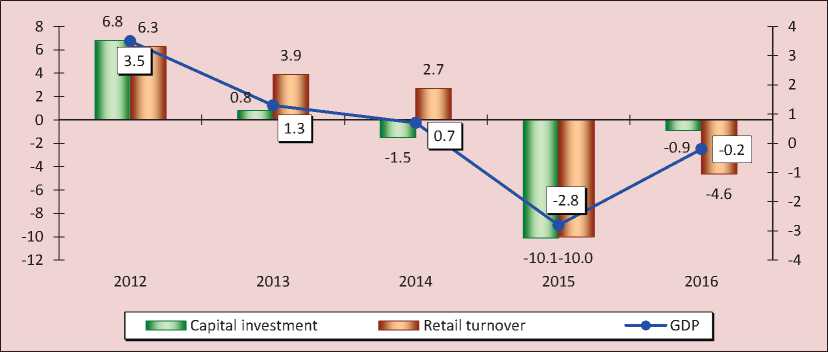
Source: data of the Federal State Statistics Service. Available at:
Figure 2. Federal budget revenues in 2012–2016, billion rubles
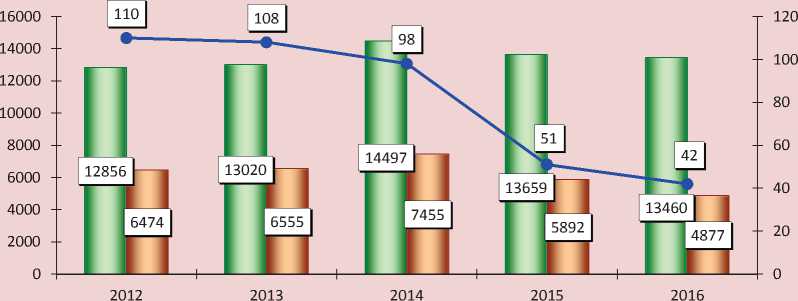
■ ■ Total revenues
■ __ ■ Oil and gas revenues
• World oil price, dollars per barrel
Sources: data of Ministry of Economic Development of the Russian Federation. Available at: ; the Federal Treasury. Available at: ; author’s calculations.
this deficit, in 2015–2016 60% from the Reserve Fund of the Russian Federation was allocated, which resulted in its four-fold reduction ( Fig. 3 ).
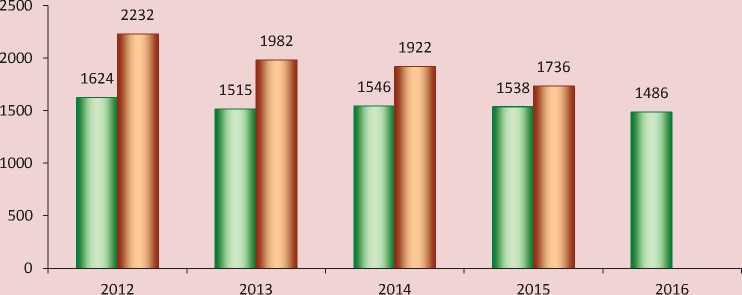
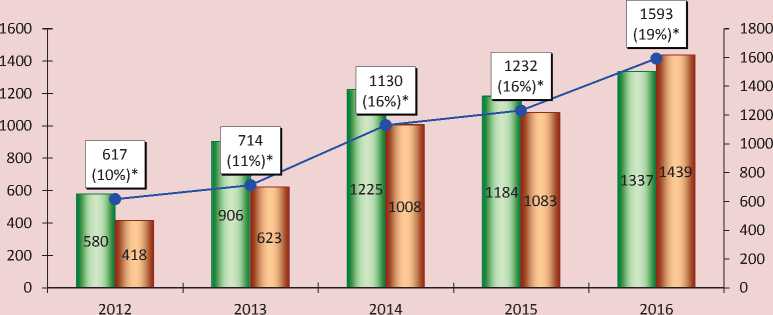
Destabilized high level budget system did not release the tensions in regional budgets of the last years. Since 2012, when the majority of the RF constituent entities became responsible for the implementation of the well-known Putin’s May Decrees, the average annual growth rates of sub-federal budget revenues decreased threefold (Fig. 4). It would be enough to say that during 2012– 2016 the revenues increased by 28%, while
Figure 3. Reserve Fund of the Russian Federation and federal budget deficit, 2012–2016, billion rubles
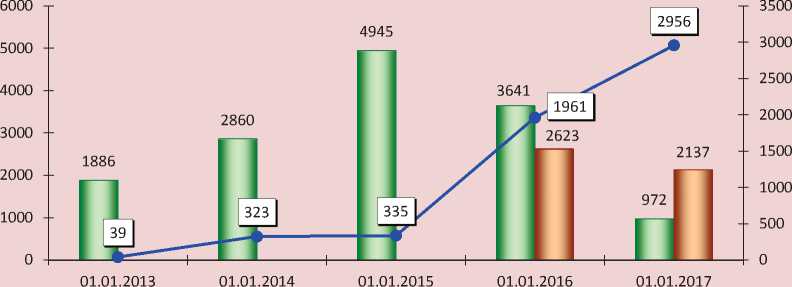
■ ■ Reserve fund
■ __ ■ Funds used to cover budget deficit
• Federal budget deficit
Source: data of Ministry of Finance of the Russian Federation. Available at: ; Federal Treasury.
Figure 4. Budget incomes of the RF constituent entities* in 2007–2016
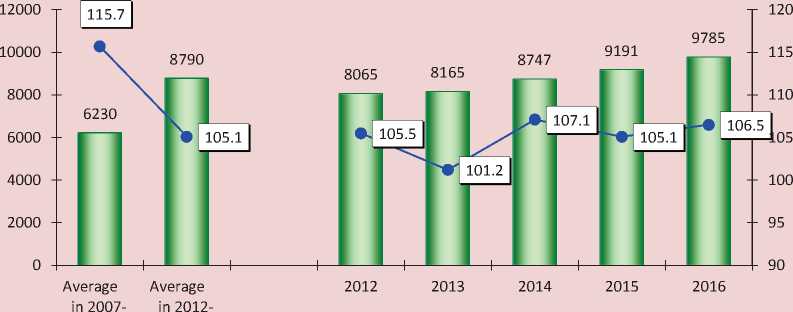
2011 2016
■ ■ Revenues, bln rubles —•—Growth rate, %
* Hereinafter, to ensure comparability dynamics, indicators for 2014–2016 are presented excluding Sevastopol and the Republic of Crimea.
Sources: data of the Federal Treasury; author’s calculations.
Figure 5. Inter-budget transfers received by budgets of the RF constituent entities from the federal budget during 2012–2016, billion rubles
□ In current prices Din comparable prices
Sources: data of the Federal Treasury; Rosstat; author’s calculations.
costs of education, most of which account for an increase in remuneration according to the Decrees, – by 45%.
A major factor in the slowing growth rates of territorial budget revenues was the roll down of financial support from the federal budget in the form of inter-budget transfers: during 2012–2016, their amount decreased in nominal terms by 8.5%; by 33.4% – in real terms1 ( Fig. 5 ).
The declining involvement of the federal budget in regional budgets makes the problem of finding one’s own resources relevant; however, under the existing highly centralized budgetary system in Russia and the general economic stagnation the opportunities of regional authorities to build their own revenue potential are very limited. Real own revenues of territorial budgets2 were demonstrating downward dynamics due to the reduction in two budget-making taxes – individual income tax (IIT) and corporate tax (Tab. 1).
After a substantial decline in income tax receipts in 2013, which affected more than 80% of regions, in subsequent years positive dynamics of its growth were resumed. However, the regional image is highly differentiated: by the end of 2016, one third of the RF constituent entities did not compensate for the nominal reduction in payment fees, and two thirds – for the real reduction. Income tax loss became significant for regions with the status of donors to the federal budget. This directly affected the general decline in income tax revenues in real terms ( Tab. 2 ).
Table 1. Own revenues of budgets of the RF constituent entities, 2012–2016, billion rubles
|
Revenues |
2012 |
2013 |
2014 |
2015 |
2016 |
2016 to 2012, % |
|
Own revenues*, total |
6384.5 |
6588.5 |
7143.1 |
7585.5 |
8238.4 |
129.0 |
|
In comparable prices |
8772.3 |
8617.8 |
8878.9 |
8564.0 |
8238.4 |
93.9 |
|
IIT* |
2261.5 |
2499.1 |
2680.9 |
2787.7 |
2992.5 |
132.3 |
|
In comparable prices |
3107.3 |
3268.8 |
3332.4 |
3147.3 |
2992.5 |
96.3 |
|
Corporate tax* |
1979.9 |
1719.7 |
1961.7 |
2099.3 |
2272.0 |
114.7 |
|
In comparable prices |
2720.4 |
2249.4 |
2438.4 |
2370.1 |
2272.0 |
83.5 |
|
Sources: data from the Federal Treasury; Rosstat; author’s calculations. |
||||||
Table 2. Income tax revenues to the budgets of the RF constituent entities in 2012 and 2016, billion rubles
|
Entity |
2012 |
2016 |
2016 to 2012, % |
||
|
In current prices |
In comparable prices |
In current prices |
In comparable prices |
||
|
Krasnodar Krai |
43.2 |
59.9 |
46.0 |
106.5 |
76.8 |
|
Kemerovo Oblast |
24.6 |
33.8 |
25.5 |
103.6 |
75.5 |
|
Moscow |
545.9 |
760.9 |
571.8 |
104.7 |
75.1 |
|
Sverdlovsk Oblast |
55.6 |
77.2 |
56.5 |
101.6 |
73.2 |
|
Perm Krai |
35.5 |
48.5 |
34.3 |
96.6 |
70.7 |
|
Orenburg Oblast |
24.8 |
33.1 |
23.3 |
94.0 |
70.3 |
|
Samara Oblast |
45.3 |
61.6 |
41.8 |
92.3 |
67.8 |
|
Khanty-Mansi Autonomous Okrug |
74.4 |
98.7 |
65.5 |
88.0 |
67.7 |
|
Yamalo-Nenets Autonomous Okrug |
46.3 |
59.6 |
37.3 |
80.5 |
62.6 |
|
Komi Republic |
17.7 |
24.2 |
16.5 |
93.2 |
59.7 |
|
Tyumen Oblast |
105.9 |
141.5 |
74.7 |
70.5 |
52.8 |
|
Arkhangelsk Oblast |
17.1 |
23.7 |
11.9 |
69.6 |
50.1 |
|
Belgorod Oblast |
19.2 |
25.8 |
12.1 |
63.0 |
46.9 |
|
Russian Federation |
1979.9 |
2720.4 |
2272.0 |
114.7 |
83.5 |
|
Sources: data from the Federal Treasury; Rosstat; author’s calculations. |
|||||
The results of ISEDT RAS research on issues of fiscal security of territories showed that the pronounced downward trend of raising income tax in recent years was due to mechanisms of legal regulation and tax administration aimed at optimizing the tax load of largest corporations which are strategic taxpayers, rather than to the economic crisis [10, 15].
Since 2013, there has been a sharp reduction in the growth rate of real IIT revenues, which correlates with real wage dynamics. The decline in tax base for IIT in 2015 has been so profound that its slight increase in 2016 did not help get on a positive path of IIT revenues ( Fig. 6 ). In addition, the payment fees in real terms have not reached the level of 2012 in 67 regions; a significant
Figure 6. Dynamics of growth of wages and IIT revenues to the budgets of the RF constituent entities in 2012–2016, % to the previous year in comparable prices
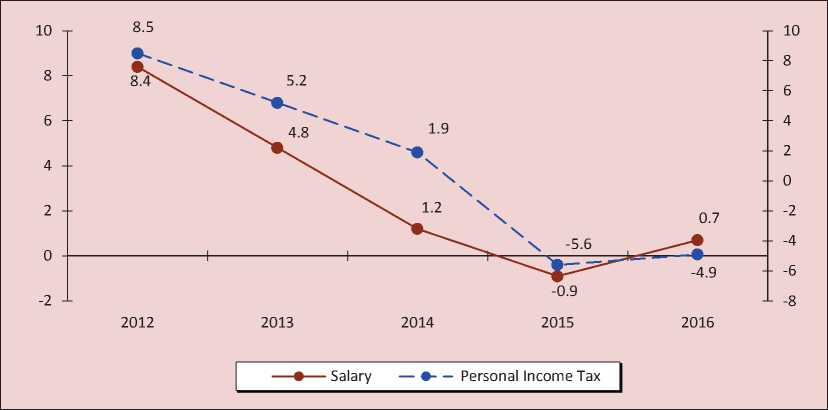
Sources: data of the Federal Treasury; Rosstat; author’s calculations.
decline was noted in industrial centers due to growing underemployment (Kaluga, Kemerovo, Vologda, Arkhangelsk, Sverdlovsk oblasts, republics of Komi and Bashkortostan, the Khanty-Mansi Autonomous Okrug).
Summarizing the results of analysis of regional budget revenues we conclude that negative trends observed in mobilization dynamics of main revenue sources indicate a continuing problem in regions’ economy and threats for stable replenishment of their budgets.
The policy of regional authorities in the sphere of budget expenditures, which reflected a nationwide trend, is based on the principle of fiscal consolidation which implies reduction in financing all major areas of expenditure ( Tab. 3 ).
One of the main goals of fiscal policy is finding an acceptable ratio between productive and non-productive expenditures for the current level of economic development [17].
As a result of consolidation structural priorities of sub-federal budgets changed in terms of this ratio. For example, during 2012–2016, the share of development budget (capital expenditures, healthcare) decreased 1.4 times, while the share of nonproductive costs in the form of social benefits to particular population categories and interest payments on market debts increased 1.5–1.8 times ( Tab. 4 ).
Thus, while developed States declared priorities of investment in human capital [16], Russia is saving on the development
Table 3. Budget expenditures of the RF constituent entities, 2012–2016, billion rubles, in comparable prices
|
Expenditures |
2012 |
2013 |
to 2012, % |
2014 |
to 2013, % |
2015 |
to 2014, % |
2016 |
2016, % to |
|
|
2012 |
2015 |
|||||||||
|
Expenditures, total |
11464 |
11519 |
100.5 |
11455 |
99.4 |
10569 |
92.3 |
9780 |
85.3 |
92.5 |
|
Federal |
698 |
714 |
102.3 |
718 |
100.6 |
673 |
93.8 |
616 |
88.3 |
91.5 |
|
Economy |
2210 |
2263 |
102.4 |
2186 |
96.6 |
2068 |
94.6 |
1950 |
88.2 |
94.3 |
|
Housing and public utilities |
1211 |
1180 |
97.4 |
1119 |
94.9 |
959 |
85.7 |
924 |
76.3 |
96.4 |
|
Social sphere |
6997 |
7006 |
100.1 |
7052 |
100.6 |
6502 |
92.2 |
5954 |
85.1 |
91.6 |
|
- education |
2813 |
3053 |
108.5 |
3048 |
99.8 |
2758 |
90.5 |
2510 |
89.2 |
91.0 |
|
- culture |
353 |
377 |
106.7 |
396 |
105.0 |
347 |
87.6 |
335 |
94.9 |
96.5 |
|
- healthcare |
1866 |
1636 |
87.7 |
1612 |
98.5 |
1507 |
93.5 |
1260 |
67.5 |
83.6 |
|
- social policy |
1750 |
1717 |
98.1 |
1759 |
102.4 |
1673 |
95.1 |
1638 |
93.6 |
97.9 |
Sources: data of the Federal Treasury; Rosstat; author’s calculations.
Table 4. Structure of separate types of expenditure of the budgets of the RF constituent entities in 2012–2016
This conclusion is confirmed by the dynamics of costs of sectors of national economy. In 2016, these costs, adjusted for inflation, decreased in 55 RF constituent entities; 20 regions including a number of economically developed ones did not reach the indicators of 2012 in absolute terms (Tab. 5).
One of the main factors which caused negative dynamics of expenditures on the economy was the redistribution of funding in order to absolutely complete the objective of increasing wages for certain categories of employees set in the May Decrees of the Russian President dated may 12th, 2012.
Table 5. Budget expenditures of the RF constituent entities on economy in 2012 and 2016, billion rubles
|
RF constituent entity |
2012 |
2016 |
2016 to 2012, % |
||
|
In current prices |
In comparable prices |
In current prices |
In comparable prices |
||
|
Novosibirsk Oblast |
24.2 |
32.0 |
23.4 |
96.7 |
73.1 |
|
Krasnoyarsk Krai |
32.3 |
42.5 |
30.1 |
93.2 |
70.8 |
|
Saratov Oblast |
12.3 |
16.6 |
11.6 |
94.3 |
69.9 |
|
Belgorod Oblast |
27.6 |
37.0 |
25.1 |
90.9 |
67.8 |
|
Primorsky Krai |
22.1 |
30.0 |
19.6 |
88.7 |
65.3 |
|
Komi Republic |
12.4 |
17.0 |
9.5 |
76.6 |
55.9 |
|
Yamalo-Nenets Autonomous Okrug |
41.8 |
53.8 |
29.6 |
70.8 |
55.0 |
|
Tyumen Oblast |
80.8 |
108.0 |
49.6 |
61.4 |
45.9 |
|
Krasnodar Krai |
66.1 |
91.7 |
38.1 |
57.6 |
41.5 |
|
Russian Federation |
1605.8 |
2206.4 |
1949.6 |
121.4 |
88.4 |
Sources: data of the Federal Treasury; Rosstat; author’s calculations.
It must be said that optimization of costs has least affected public control and administration authorities. For example, in the Northwestern Federal district in 2016, only the Novgorod Oblast reduced budget expenditures on supporting administrative staff compared to 2012. The growth rate of administrative expenses outran the growth of total expenditures of regional budgets, and unit management costs in most areas exceeded the average value (Tab. 6).
Table 6. Management budget expenditures of constituent entities of the Northwestern Federal district in 2012 and 2016
|
Constituent entity |
2012 |
2016 |
2016 to 2012, % |
|||
|
bln RUR |
share, % |
bln RUR |
share, % |
Total budget expenditures |
Management expenditures |
|
|
Leningrad Oblast |
8.58 |
9.5 |
12.39 |
9.3 |
148.8 |
144.5 |
|
Saint Petersburg |
19.34 |
5.0 |
27.19 |
5.4 |
132.1 |
140.6 |
|
Kaliningrad Oblast |
3.03 |
6.1 |
4.03 |
6.6 |
122.0 |
133.0 |
|
Murmansk Oblast |
3.93 |
6.6 |
5.21 |
7.4 |
118.9 |
132.6 |
|
Arkhangelsk Oblast |
4.28 |
6.0 |
5.29 |
6.4 |
115.2 |
123.6 |
|
Republic of Karelia |
2.01 |
5.7 |
2.45 |
5.8 |
118.5 |
122.1 |
|
Vologda Oblast |
4.29 |
7.4 |
5.03 |
8.0 |
108.0 |
117.2 |
|
Komi Republic |
4.82 |
7.0 |
5.63 |
7.2 |
113.2 |
116.8 |
|
Pskov Oblast |
1.77 |
5.8 |
1.89 |
6.0 |
104.3 |
106.8 |
|
Novgorod Oblast |
2.53 |
7.6 |
2.47 |
7.4 |
100.8 |
97.6 |
|
Northwestern Federal district |
54.59 |
6.2 |
71.51 |
6.3 |
128.4 |
131.0 |
|
Russian Federation |
510.4 |
6.1 |
616.3 |
6.3 |
117.2 |
120.7 |
|
Sources: data of the Federal Treasury; author’s calculations. |
||||||
Table 7. RF constituent entities with highest level of market debt in 2016
|
Constituent entity |
2012 |
2016 |
2016 to 2012, times |
||
|
Mln RUR |
%* |
Mln RUR |
%* |
||
|
Voronezh Oblast |
6079 |
48.0 |
18152 |
50.5 |
3.0 |
|
Kostroma Oblast |
2735 |
28.2 |
11221 |
52.6 |
4.1 |
|
Murmansk Oblast |
4000 |
46.6 |
11000 |
53.2 |
2.7 |
|
Perm Krai |
0 |
0 |
11500 |
54.7 |
х |
|
Khabarovsk Krai |
2900 |
51.9 |
21818 |
60.5 |
7.5 |
|
Jewish Autonomous Oblast |
480 |
31.8 |
3000 |
61.0 |
6.3 |
|
Tambov Oblast |
3312 |
49.8 |
9410 |
65.3 |
2.8 |
|
Sverdlovsk Oblast |
3600 |
17.4 |
47595 |
65.9 |
13.2 |
|
Mari El Republic |
4703 |
62.1 |
9143 |
67.7 |
1.9 |
|
Magadan Oblast |
250 |
18.9 |
8389 |
69.5 |
33.6 |
|
Rostov Oblast |
5900 |
59.3 |
28114 |
69.8 |
4.8 |
|
Kurgan Oblast |
500 |
18.3 |
10909 |
72.5 |
21.8 |
|
Republic of Buryatia |
0 |
0 |
7591 |
75.1 |
х |
|
Nenets Autonomous Okrug |
0 |
0 |
3600 |
100.0 |
х |
|
Russian Federation |
438216 |
32.4 |
808509 |
34.4 |
1.8 |
|
* Share of loans in the structure of public debt. Sources: data of Ministry of Finance; author’s calculations. |
|||||
Unfortunately, despite fiscal consolidation no significant changes occurred in debt issues in the Russian regions, although federal authorities took measures to reduce market debt4 of regional budgets: in 2016 for the first time, loans from the federal budget were transferred to debt refinancing and not to paying off budget deficit. However, 32 regions failed to replace market loans with budget loans, 20 of them had a share of loans exceeding half of public debt ( Tab. 7 ). In 2016, only 12 regions had no commercial loans in the debt structure as they were given significant amounts of loans from the federal budget.
Federal loans did not reduce regions’ demand for bank loans and did not stop debt accumulation. In 2016, there is a renewed trend of commercial loan priority, the amount of consolidated debt reaches 2.7 trillion rubles ( Fig. 7 ).
In general, by the end of 2016 debt growth was observed in 60% of the RF constituent entities. The debt burden5 of budgets was slightly reduced from 35 to 33% ( Fig. 8 ) which can hardly be called a success given a twofold reduction in the debt of Moscow6. The number of regions with a debt burden over 50% has not reduced; in most of them the
Figure 7. Received loans, public and municipal debt of the RF constituent entities in 2012–2016, billion rubles
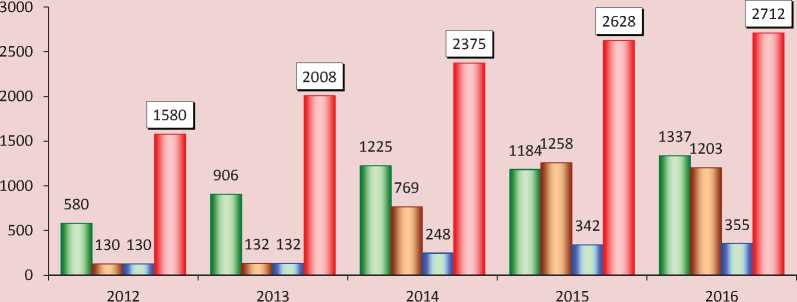
□ Bank loans П Budget loans, total* □ Loansfromfederalbudget О Debt
* Budget loans include loans from federal budget and loans to replenish account balance provided by the Federal Treasury in 2014.
Sources: data from Ministry of Finance of the Russian Federation; Federal Treasury; author’s calculations.
Figure 8. Debt burden on budgets of the RF constituent entities in 2012–2016
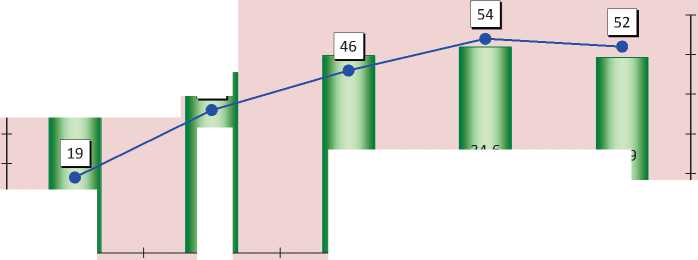
34.6
33.2
32.9
30.5
24.7
■ ■ Debt load, %
—•— Number of regions with debt load over 50%
Figure 9. Bank loans received and repaid by budgets of the RF constituent entities in 2012–2016, billion rubles
■ ■ Received ■ ■ Repaid —•— Costs of loan repayment and servicing
* The figures in brackets represent share of expenditures for on loan repayment and servicing in own budget revenues. Sources: data from the Federal Treasury; author’s calculations.
debt burden exceeded 70%, and in 6 regions7 – 100% of own revenues (in 2015 – in 4 regions). Therefore, it is too early to refer to overcoming the debt crisis in Russian regions.
Another feature of the debt policy of the past year is the changed balance between commercial loan borrowing and repayment: for the first time, there were 102 billion rubles more loans recovered than loans provided, which resulted in an increase in debt value: 19% of own budget revenues was used for market loan repayment and servicing ( Fig. 9 ).
In 2016, expenditures on loan repayment and interest payments were second only to expenditures on education and social policy. It means that for unconditional implementation of expenditure commitments regional authorities will be forced to borrow, which will inevitably lead to the escalation of market debt.
Prime Minister Dmitry Medvedev speaking at the Russian Investment Forum in Sochi claimed that “regional budget deficit decreased from 170 to 12.5 billion rubles” [3]. Is it really true? First, if we refer to regional budgets, i.e., territorial, republican, oblast’s budgets, their deficit, according to the Federal Treasury, decreased from 108.2 to 2.4 billion rubles. Second, due to restriction of consolidated budget revenues of the RF constituent entities and great budget surplus
Figure 10. Budgets deficit of the RF constituent entities in 2012–2016, billion rubles
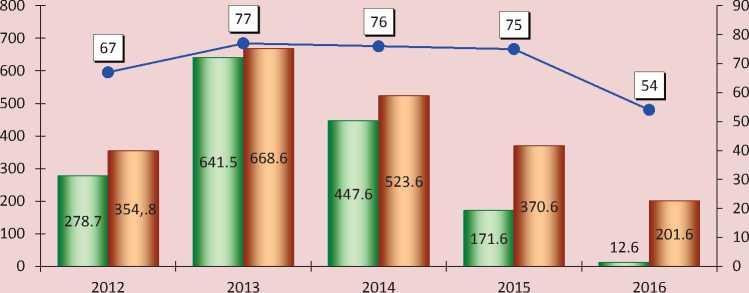
■ ■ Deficit adjusted for proficit*
■ = ■ Net deficit**
—•— Number of regions with budget deficit
* Reporting data of the Federal Treasury.
** Author’s calculations.
of Moscow8, it became possible to reduce the total deficit from 171.6 billion rubles in 2015 to 12.6 billion rubles in 2016. Third, at the end of 2016, 54 regions were unable to balance their budgets. Excluding the regions which implemented their budgets with a surplus, net deficit of sub-federal budgets amounted to 201.6 billion rubles, which is ten times more than the figures in the accounts of the Federal Treasury ( Fig. 10 ).
In 2016, budget deficit was observed in 17 regions ( Tab. 8 ). The list contains economically successful regions: city of Saint Petersburg with extensive commitments to hold 2018 FIFA World Cup; the Khanty-
Mansi Autonomous Okrug and the Sakhalin Oblast, whose budgets lack tax payments due to a decline in oil prices.
Thus, fiscal consolidation has not helped most Russian regions to solve the problem of budget imbalance.
The results of analysis of sub-federal budget administration give reason for the following conclusions. There is no radical change in budget crisis of Russian regions caused by the need to implement election manifestos of the Russian President without financial support. The greatest achievement is a slight debt relief and slower growth rate of budget deficits in particular areas due to the restructuring of a significant share of commercial debt into budget debt. But budget
Table 8. RF constituent entities with growing budget deficit in 2016
Let us distinguish the main trends characterizing the budget process in the RF constituent entities in 2016:
– declining real personal budget revenues largely due to a decrease in income tax receipts in regions specialized in mineral extraction, metallurgy and agriculture;
– reducing real IIT revenues indicating the declining social welfare of the Russian population;
– reducing grant in aid from the federal budget limiting the possibilities of non-debt financing of budget deficit;
– increasing structural imbalances in budget expenditures due to the cutting of productive costs;
– accelerating optimization of social sector financing which may entail reduced availability of public services and increased social tensions;
– increasing debt load of sub-federal budgets depriving the regions of the possibilities to draw on resources for implementing investment projects.
These steady trends will continue in the next budget cycle. It is obvious that due to negative trends in the socio-economic dynamics there are no simple solutions to the budget issue.
In most regions there is a pressing need for a complex system of industrial and investment potential management. Without this the economic activity will focus only on the current needs to the detriment of strategic development priorities. Unfortunately, as rightly pointed out by Doctor of Economics A.E. Dvoretskaya, “fiscal authorities have no strategic vision of budget revenues since no serious measures to diversify the economy have been taken. A balanced budget cannot exist in an unbalanced economy [6]”.
Fiscal policy of Russian authorities has repeatedly been exposed to criticism from the expert community [2, 7, 8, 11, 12, 13], most of agree that the budget system of the Russian Federation does not contribute to the country’s development.
Despite statements of the Ministry of Finance of lack of financial resources [1] the results of the ISEDT RAS research indicate that the country still has reserves for addressing the issue of the territorial budget crisis, which are as follows:
-
1. The reformation of individual income taxation through gradual establishment of differentiated rates for windfall revenues. As shown by the calculations, the introduction of progression only in respect of dollar billionaires is able to double IIT receipts to regional budgets [14].
-
2. Free budget balance accumulated in the treasury accounts as a result of errors and forecasting miscalculations of budget parameters. At the end of 2016,
-
3. Assessment of existing tax incentives concerning regional and local taxes (property taxes) and their partial or full abolition primarily for highly profitable economic entities. According to our calculations, in 2015 as a result of tax incentives regional budgets were missing 405.5 billion rubles, i.e. 40% of property payments.
-
4. Measures to recover accounts receivable of sub-federal budgets, which, according to the Federal Treasury, increased by one third during 2016 and amounted to 1.3 trillion rubles.
-
5. Increased responsibility of chief budget holders for the results of the implementation of expenditures. In 2016, amid fiscal consolidation the regions misused 588.6 billion rubles, i.e. 6% of allocations.
-
6. Legislation of distribution of interbudget transfers from the federal budget among the RF constituent entities by the beginning of regional budget planning for the next financial cycle. Annual failure to comply with the proposed procedure leads to the disruption of the budget process in the regions, resulting in untimely distributed and unencumbered transfers returning to the federal budget. By the end of 2016, the regions returned 35.8 billion rubles of unencumbered subsidies and subventions, which is two times more than in 2015.
-
7. Prolongation of the policy of transforming market debt into budget debt, carried out by the Government of the Russian Federation in 2016.
-
8. Unification of a methodology for calculating revenues for taxation for achieving maximum transparency. Along with these measures, legislative changes should provide for greater transparency of activities of major taxpayers, especially regarding detailed financial statements which should provide the users with data on the efficiency of corporate management [20]. For example, results of the ISEDT RAS analysis of activities of a revenuegenerating enterprise in the Vologda Oblast – PAO Severstal – show that due to double standards of calculating the tax base, the effective income tax rate paid by the corporation in 2015–2016 comprised 4.5% instead of a 20% standard rate due to which the budget lost 23.4 billion rubles.
free balance in the whole budget system of the country amounted to 1.6 trillion rubles including regional budgets – 0.4 trillion rubles.
Imperfect mechanisms of budget management necessitates the assessment of regional powers and estimation of their revenue potential. It has been scientifically proven and practically confirmed that sustainable development of federal, regional and municipal systems can provide balance between revenues and expenditures in the following proportions: 50% – to federal and 50% to region’s consolidated budget [19]. The government’s ignoring of this ratio resulted in reduction in the number of self-sufficient regions from 20 to 13 over the past decade. In our opinion, one of the ways to change the procedure of tax revenue distribution in the budget hierarchy is to transfer a share of value added tax (VAT) receipts to regional budgets, including through cancellation of VAT refund paid by raw material exporters from the federal budget, which will provide additional annual revenues amounting to 1.7 trillion rubles [9].
In conclusion, we come to the following conclusion. Although the discussion of issues related to the budget crisis of the RF constituent entities is far from being complete, one should admit that understanding the need for structural reforms to overcome this crisis is getting more relevant. In the long term, only through increased economic activity will it possible to reach the balance between territorial budgets.
References Administration of regional budgets in 2016: the crisis has not been overcome
- Bashkatova A. Rezervnyi fond vse ravno ischeznet . Available at: http://www.ng.ru/economics/2017-05-18/1_6990_neft.html..
- Bokareva L. Tseli i riski reformy upravleniya gosudarstvennymi finansami RF . Obshchestvo i ekonomika , 2016, no. 12, pp. 46-64..
- Vystuplenie D.A. Medvedeva na plenarnom zasedanii rossiiskogo investitsionnogo foruma "Sochi-2017" . Available at: http://government.ru/news/26566/..
- Vystuplenie D.A. Medvedeva s otchetom o rabote Pravitel'stva RF v Gosudarstvennoi Dume RF 19.04.2017 g. .Available at: https://rg.ru/2017/04/19/..
- Gamukin V.V. Byudzhetnye riski: sreda, sistema, sluchai. Tyumen': Tyumenskii gosudarstvennyi universitet, 2015. 328 p..
- Dvoretskaya A.E. Srednesrochnye perspektivy byudzheta RF . EKO, 2016, no. 8, pp. 104-119..
- Degtev A.S. Mezhbyudzhetnye disproportsii: pugayushchie tendentsii . Available at: http://rusrand.ru/analytics/..
- Dmitrieva O.G. Byudzhet plachevnykh itogov . Moskovskii komsomolets , 2013, 23 October..
- Ilyin V.A., Povarova A.I. Nedostatki nalogovogo administrirovaniya krupnogo biznesa i ikh vliyanie na regional'nye byudzhety . Ekonomika regiona , 2017, no. 1, pp. 25-37..
- Ilyin V.A., Povarova A.I. Effektivnost' gosudarstvennogo upravleniya 2000-2015. Protivorechivye itogi -zakonomernyi rezul'tat . Vologda: ISERT RAN, 2016. 304 p..
- Kashin V.A., Abramov M.D. Promyshlennaya politika i nalogovoe regulirovanie . Moscow: IPR RAN, 2015. 164 p..
- Krichevskii N.A. Kak zastavit' oligarkhov delit'sya s narodom . Moskovskii komsomolets , 2017, 17 March..
- Petrov Yu.A. K formirovaniyu novoi ekonomicheskoi modeli: restriktsiya byudzhetnykh raskhodov ili povyshenie sobiraemosti nalogov? . Rossiiskii ekonomicheskii zhurnal , 2013, no. 4, pp. 24-39..
- Povarova A.I. Reformirovanie naloga na dokhody fizicheskikh lits -vazhneishii faktor stabilizatsii byudzhetnoi sistemy . Ekonomicheskie i sotsial'nye peremeny: fakty, tendentsii, prognoz , 2016, no. 6 (48), pp. 193-213..
- Povarova A.I. Snizhenie fiskal'noi funktsii naloga na pribyl': faktory i puti povysheniya . Ekonomicheskie i sotsial'nye peremeny: fakty, tendentsii, prognoz , 2014, no. 3, pp. 180-195..
- Rossiiskaya ekonomika v 2016 godu. Tendentsii i perspektivy (Vypusk 38) koll. avtorov Instituta Gaidara . Moscow: Institut Gaidara, 2017. 570 p..
- Sokolov I. Byudzhet kak instrument strukturnykh preobrazovanii v rossiiskoi ekonomike: doklad na Gaidarovskikh chteniyakh 11.05.2017 g. . Available at: https://docviewer.yandex.ru/view/141072879/..
- Sulakshin S.S., Khvylya-Olinter N.A., Kravchenko L.I. Sotsial'no-ekonomicheskoe polozhenie rossiyan v krizisnyi period . Moscow: Nauka i politika, 2017. 48 p..
- Tatarkin A.I. Dialektika gosudarstvennogo i rynochnogo regulirovaniya sotsial'no-ekonomicheskogo razvitiya regionov i munitsipalitetov . Ekonomika regiona , 2014, no. 1, pp. 9-30..
- Hendriksen E.S., Van Breda M.F. Accounting theory. Homewood, IL: Irwin, 1992. 905 p.
