Age Classification Based On Integrated Approach

Author: Pullela. SVVSR Kumar, V.Vijaya Kumar, Rampay.Venkatarao
Journal: International Journal of Image, Graphics and Signal Processing(IJIGSP) @ijigsp
Article in issue: 6 vol.6, 2014.
Free access
The present paper presents a new age classification method by integrating the features derived from Grey Level Co-occurrence Matrix (GLCM) with a new structural approach derived from four distinct LBP's (4-DLBP) on a 3 x 3 image. The present paper derived four distinct patterns called Left Diagonal (LD), Right diagonal (RD), vertical centre (VC) and horizontal centre (HC) LBP's. For all the LBP's the central pixel value of the 3 x 3 neighbourhood is significant. That is the reason in the present research LBP values are evaluated by comparing all 9 pixels of the 3 x 3 neighbourhood with the average value of the neighbourhood. The four distinct LBP's are grouped into two distinct LBP's. Based on these two distinct LBP's GLCM is computed and features are evaluated to classify the human age into four age groups i.e: Child (0-15), Young adult (16-30), Middle aged adult (31-50) and senior adult (>50). The co-occurrence features extracted from the 4-DLBP provides complete texture information about an image which is useful for classification. The proposed 4-DLBP reduces the size of the LBP from 6561 to 79 in the case of original texture spectrum and 2020 to 79 in the case of Fuzzy Texture approach.
Age classification, Combined feature, Distinct-LBP, Fuzzy Texture, GLCM, Patterns
Short address: https://sciup.org/15013309
IDR: 15013309
Text of the scientific article Age Classification Based On Integrated Approach
Published Online May 2014 in MECS DOI: 10.5815/ijigsp.2014.06.07
AGE-CENTERED COMPUTING (ACC) has long been an extensively interesting topic in both Human– Computer Interaction (HCI) and cognitive studies. The human traits displayed by facial attributes, such as personal identity, facial expression, gender, age, ethnic origin, and pose. Recently Human age classification has become an active research topic in computer vision because of its widespread potential real world applications such as electronic customer relationship management (ECRM) [1], security control and surveillance monitoring [2, 3, 4], biometrics [5], and entertainment. There are two fundamental problems in designing the techniques i.e face image analysis and face image synthesis. In both cases Age of face has also been considered as an important semantic or contextual cue in social networks [5] [6]. And age, is an information source for ACC, conveys significant nonverbal information for the communication and interaction between humans or between human and machine. Theoretically, Human Aging can be categorized into many phases as age between 1 to 10, 11 to 20, 21 to 50, 51 to 60 and above 60.Computationally, an age estimation system usually consists of two modules: image representation and age estimation. Age image representations include the anthropometric model [7, 8], wrinkle model [10], active appearance model (AAM) [9], AGing pattErn Subspace (AGES) [11, 12], age manifold learned from raw images [13, 14], local binary pattern features [15], and parts [7] or patch-based appearance model [16, 17]. Given a representation, age estimation can be viewed as a multiclass classification problem [18, 19, 20] or a regression problem [12, 22, 21, 13] or a hybrid of the two [24]. This age estimation method includes single age estimation, age group estimation and hierarchical estimation.
The present paper is organized as follows. The section 2 describes methodology, section 3 and section 4 describes results and discussion and conclusions respectively
-
II. Methodology
The present paper derived age classification based on the features derived from Grey Level Co-occurrence Matrix (GLCM) on 4-DLBP’s. Most of the statistical methods [25, 26] suffer from the generalization problem due to the unpredictable distribution of the face images in real environment, which might be far different from that of the training face images. The structural method like LBP suffers from illumination effect. To avoid these problems, the present research combined structural and statistical methods based on 4-DLBP using GLCM features. The proposed method consists of nine steps described below.
Step 1 : Take facial image as Input Image (Img).
Step 2 : Convert the RGB image into Grey scale Image by using HSV colour model.
Step 3 : Convert each 3×3 window of facial image into LBP based on the following equation.
(0 if ХИ<УО )
™ = |1 if X^lj f"r Ц = 1'2'3 (1)
Where V 0 is the mean of the 3×3 sub matrix.
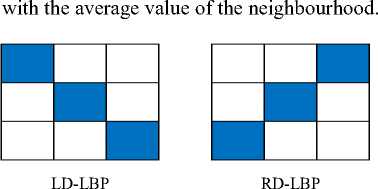
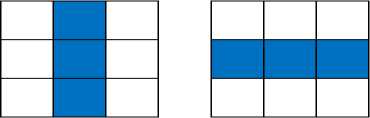
Step 4: Convert each 3×3 LBP-window of facial image into four distinct patterns based – LBP’s, named as Left Diagonal (LD-LBP), Right diagonal (RD-LBP), vertical centre (VC-LBP) and horizontal centre (HC-LBP), which are shown in Fig.1. All the four LBP’s contains three pixels only.For all the LBP’s the central pixel value of the 3 x 3 neighbourhood is significant. That is the reason in the present research LBP values are evaluated by comparing all 9 pixels of the 3 x 3 neighbourhood
VC-
LBP
HC-
LBP
Fig 1: Four Different Patterns of LBP.
Step 5: Calculate the LBP unit values for LD-LBP, RD-LBP, VC-LBP and HC-LBP. Each of them will have LBP-value ranging from 0 to 7.
Step 6: Based on the step 5 the present paper divided the LBP units in to two categories i.e Diagonal and Horizontal Vertical (HV) as given in equation 2 and 3 respectively.
Diagonal-LBP (DLBP) = LD-LBP+ RD-LBP (2)
HV-LBP (HVLBP) = VC-LBP + HC-LBP (3)
Step 7: Generate the co-occurrence matrix based on values generated in step 6. The proposed GLCM is constructed on the proposed Diagonal and HV-LBP (D-HV-LBP) by representing the DLBP values on X-axis and HVLBP values on Y-axis as shown in Fig.2(c). This GLCM is named as D-HV-LBP-GLCM. The D-HV-LBP-GLCM has the elements of relative frequencies in both DLBP and HVLBP as in Fig.2 (a) & (b). The values of DLBP and HVLBP ranges from 0 to 14. Thus the D-HV-LBP-GLCM will have a fixed size of 14 x 14.
(a) (b)
|
0 |
1 |
2 |
. |
. |
. |
14 |
|||||
|
0 |
|||||||||||
|
1 |
|||||||||||
|
2 |
|||||||||||
|
. |
|||||||||||
|
. |
|||||||||||
|
14 |
(c)
|
DLBP |
Fq1 |
|
0 |
|
|
1 |
|
|
2 |
|
|
. |
|
|
. |
|
|
. |
|
|
14 |
|
HVLBP |
Fq2 |
|
0 |
|
|
1 |
|
|
2 |
|
|
. |
|
|
. |
|
|
. |
|
|
14 |
Step 8: From this D-HV-LBP-GLCM, a set of Haralick features i.e. energy, contrast, Homogeneity and correlation as given in equation 4, 5, 6 and 7 respectively.
Energy = £ ^-1п(р)2(4)
Contrast = Z^ p (i - j)2(5)
Homogenity = £ ^Z i^7)7
Correlation = £ ^ p (LJijL-E)(7)
Where P ij is the pixel value of the image at position (i, j), ц is mean and о is standard deviation.
Step 9: By using K-nn Classifier on the proposed D-HV-LBP-GLCM features, the facial image is classified as one of the category (Child age (0-15), Young Age(16-30), Middle Age(31-50) and Senior Age(>50).
-
III. Results and Discussions
The proposed scheme established a database from the 1002 face images collected from FG-NET database, 500 images from Google database and other 600 images collected from the scanned photographs. This leads a total of 2102 sample facial images. In the proposed D-HV-LBP-GLCM method the sample images are grouped into four age groups of Child age(0-15), Young Age(16-30), Middle Age(31-50) and Senior Age(>50). A few of them are shown in Fig.3. The Contrast, Correlation, Energy and Homogeneity features are extracted from D-HV-LBP-GLCM of different facial images and the results are stored in the feature database. Feature set leads to representation of the training images. The Contrast, Correlation, Energy and Homogeneity features derived from D-HV-LBP-GLCM of four age groups of facial images are shown in tables 1, 2, 3, and 4 respectively. To evaluate the proposed method, 30 different facial expressions are considered from FG-NET aging database, Google database and scanned images as a test data base. The present paper estimated distance between feature database and test database by using Euclidian distances. To classify the test images into appropriate age group the present paper utilized minimum distance K-nearest neighbour classifier. Successful classification results of test data bases for the proposed D-HV-LBP-GLCM method are shown in table 5.
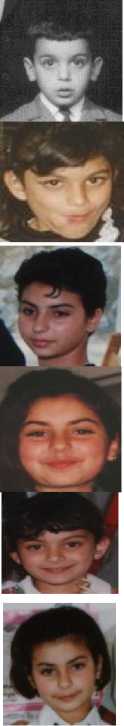
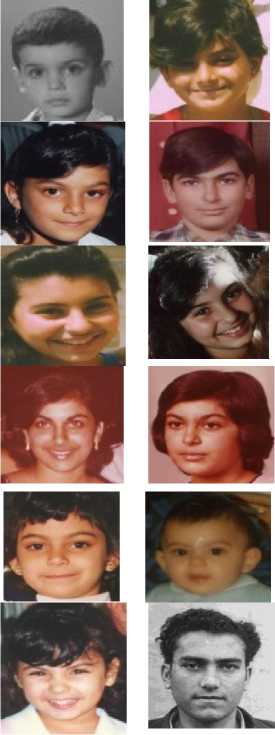
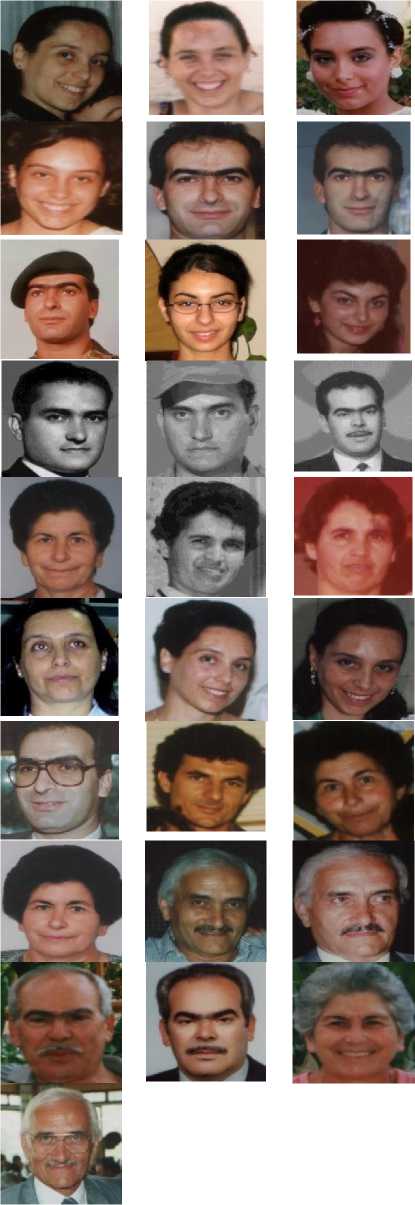
Fig.3: FG-NET aging database: 011A07, 011A05, 010A10, 010A09, 010A07b, 001A14, 019A07, 009A14, 009A13, 009A11, 008A16, 008A13, 010A05, 010A04, 010A01, 009A09, 009A05, 004A21, 002A29, 002A26, 002A23, 002A21, 001A29, 001A28, 001A22, 009A22a, 008A21, 004A28, 004A26, 006A36, 005A40, 011A40, 001A43b, 002A31, 001A33 007A37, 005A52, 005A49, 004A53, 004A51, 048A54 , 006A61, 005A61, 004A63.
Table 1: Feature set values of d-hv-lbp-glcm for child age images.
|
S No |
Image Name |
Contrast |
Correl-tion |
Energy |
Homo Geneity |
|
1 |
001A05 |
7.20958 |
0.68932 |
0.02766 |
0.49165 |
|
2 |
001A08 |
7.18185 |
0.70819 |
0.02699 |
0.50230 |
|
3 |
008A12 |
7.06797 |
0.68230 |
0.02975 |
0.49620 |
|
4 |
001A14 |
7.27466 |
0.67894 |
0.02677 |
0.49043 |
|
5 |
001A02 |
7.47466 |
0.81932 |
0.02779 |
0.48165 |
|
6 |
001A10 |
7.00958 |
0.83819 |
0.02732 |
0.51230 |
|
7 |
002A04 |
7.16797 |
0.81230 |
0.02837 |
0.48730 |
|
8 |
002A05 |
6.98185 |
0.80894 |
0.02632 |
0.48120 |
|
9 |
002A07 |
7.28185 |
0.80932 |
0.02666 |
0.47543 |
|
10 |
002A12 |
7.07466 |
0.82819 |
0.03025 |
0.50165 |
|
11 |
002A15 |
7.26797 |
0.80230 |
0.02716 |
0.48620 |
|
12 |
009A00 |
7.13185 |
0.79894 |
0.02599 |
0.46665 |
|
13 |
009A01 |
7.15958 |
0.67230 |
0.02749 |
0.48043 |
|
14 |
009A03 |
7.01797 |
0.66894 |
0.02729 |
0.50620 |
|
15 |
009A05 |
7.22466 |
0.66932 |
0.02649 |
0.47665 |
|
16 |
009A09 |
7.10958 |
0.68819 |
0.02816 |
0.47120 |
|
17 |
009A11 |
6.96797 |
0.66230 |
0.02782 |
0.49230 |
|
18 |
009A13 |
7.17466 |
0.65894 |
0.02829 |
0.50043 |
|
19 |
009A14 |
7.37466 |
0.69819 |
0.02737 |
0.47730 |
|
20 |
010A01 |
7.30958 |
0.67230 |
0.02727 |
0.46543 |
|
21 |
010A04 |
6.86797 |
0.70032 |
0.02887 |
0.49620 |
|
22 |
010A05 |
7.38185 |
0.71919 |
0.02875 |
0.47337 |
|
23 |
010A06 |
7.03185 |
0.69330 |
0.02682 |
0.47071 |
|
24 |
010A07a |
7.05958 |
0.68994 |
0.02577 |
0.46806 |
|
25 |
010A07b |
6.91797 |
0.69032 |
0.02925 |
0.46541 |
|
26 |
010A09 |
7.12466 |
0.70919 |
0.02679 |
0.46275 |
|
27 |
010A10 |
7.32466 |
0.68330 |
0.02787 |
0.48262 |
|
28 |
010A15 |
7.25958 |
0.67994 |
0.02627 |
0.46010 |
|
29 |
011A02 |
6.81797 |
0.67932 |
0.02681 |
0.45744 |
|
30 |
010A12 |
7.33185 |
0.69819 |
0.02556 |
0.45479 |
Table 2: Feature set values of d-hv-lbp-glcm for young age images.
|
Sno |
Image Name |
Contrast |
Correlati on |
Energy |
Homogeneity |
|
1 |
001A16 |
7.3658 |
0.7331 |
0.0258 |
0.4970 |
|
2 |
001A19 |
7.5204 |
0.7218 |
0.0259 |
0.4937 |
|
3 |
001A29 |
7.5762 |
0.6780 |
0.0261 |
0.4966 |
|
4 |
002A16 |
7.5262 |
0.7082 |
0.0263 |
0.4970 |
|
5 |
001A18 |
7.2458 |
0.7196 |
0.0258 |
0.4950 |
|
6 |
001A22 |
7.4004 |
0.7055 |
0.0250 |
0.4947 |
|
7 |
001A28 |
7.4562 |
0.6530 |
0.0277 |
0.4919 |
|
8 |
002A18 |
7.2791 |
0.7446 |
0.0284 |
0.4929 |
|
9 |
002A20 |
7.4338 |
0.7305 |
0.0263 |
0.4970 |
|
10 |
002A21 |
7.4896 |
0.6780 |
0.0268 |
0.4970 |
|
11 |
002A23 |
7.3991 |
0.7071 |
0.0266 |
0.4967 |
|
12 |
002A26 |
7.5538 |
0.6930 |
0.0282 |
0.4960 |
|
13 |
002A29 |
7.6096 |
0.6405 |
0.0263 |
0.4964 |
|
14 |
004A19 |
7.3958 |
0.7696 |
0.0282 |
0.4967 |
|
15 |
004A21 |
7.5504 |
0.7555 |
0.0261 |
0.4959 |
|
16 |
004A26 |
7.6062 |
0.7030 |
0.0279 |
0.4949 |
|
17 |
004A28 |
7.5158 |
0.7446 |
0.0255 |
0.4959 |
|
18 |
004A30 |
7.6704 |
0.7305 |
0.0253 |
0.4944 |
|
19 |
005A18 |
7.7262 |
0.6780 |
0.0258 |
0.4990 |
|
20 |
005A24 |
7.1958 |
0.6696 |
0.0260 |
0.4972 |
|
21 |
005A30 |
7.3504 |
0.6555 |
0.0255 |
0.4979 |
|
22 |
006A24 |
7.4062 |
0.6030 |
0.0287 |
0.4939 |
|
23 |
006A28 |
7.2208 |
0.7445 |
0.0255 |
0.4959 |
|
24 |
007A18 |
7.3754 |
0.6930 |
0.0263 |
0.4957 |
|
25 |
007A22 |
7.4312 |
0.7336 |
0.0282 |
0.4980 |
|
26 |
007A23 |
7.3408 |
0.7335 |
0.0282 |
0.4975 |
|
27 |
007A26 |
7.4954 |
0.6710 |
0.0268 |
0.4939 |
|
28 |
008A17 |
7.5512 |
0.6786 |
0.0258 |
0.4977 |
|
29 |
008A29 |
7.3158 |
0.7448 |
0.0272 |
0.4969 |
|
30 |
008A30 |
7.4704 |
0.6330 |
0.0264 |
0.4987 |
Table 3: Feature set values of d-hv-lbp glcm for middle age images.
|
S. no |
Image Name |
Contrast |
Corre lation |
Energy |
Homo geneity |
|
1 |
001A43a |
7.6185 |
0.6472 |
0.0281 |
0.4970 |
|
2 |
002A31 |
7.5360 |
0.6681 |
0.0266 |
0.4951 |
|
3 |
002A38 |
7.5829 |
0.6728 |
0.0288 |
0.4927 |
|
4 |
003A35 |
7.6185 |
0.6693 |
0.0294 |
0.4981 |
|
5 |
003A47 |
7.4068 |
0.7221 |
0.0287 |
0.5023 |
|
6 |
003A49 |
7.5360 |
0.7611 |
0.0291 |
0.4996 |
|
7 |
001A43b |
7.5310 |
0.7399 |
0.0276 |
0.5026 |
|
8 |
001A33 |
7.5829 |
0.6451 |
0.0283 |
0.4879 |
|
9 |
001A40 |
7.4068 |
0.7221 |
0.0257 |
0.4959 |
|
10 |
003A47 |
7.6185 |
0.6513 |
0.0272 |
0.4926 |
|
11 |
002A36 |
7.4568 |
0.6735 |
0.0292 |
0.4986 |
|
12 |
003A38 |
7.6185 |
0.6951 |
0.0278 |
0.5019 |
|
13 |
004A37 |
7.4068 |
0.7228 |
0.0313 |
0.4909 |
|
14 |
004A40 |
7.5329 |
0.6728 |
0.0293 |
0.5007 |
|
15 |
004A48 |
7.5360 |
0.7221 |
0.0271 |
0.4992 |
|
16 |
006A31 |
7.3568 |
0.7388 |
0.0267 |
0.4939 |
|
17 |
006A36 |
7.5360 |
0.6451 |
0.0277 |
0.5016 |
|
18 |
006A40 |
7.5360 |
0.6679 |
0.0303 |
0.4976 |
|
19 |
006A42 |
7.5860 |
0.6728 |
0.0282 |
0.4921 |
|
20 |
006A44 |
7.4068 |
0.6673 |
0.0282 |
0.5009 |
|
21 |
006A46 |
7.4318 |
0.7721 |
0.0272 |
0.4956 |
|
22 |
006A48 |
7.5829 |
0.6690 |
0.0277 |
0.4988 |
|
23 |
006A50 |
7.5829 |
0.7444 |
0.0267 |
0.4969 |
|
24 |
008A41 |
7.6079 |
0.6951 |
0.0262 |
0.4971 |
|
25 |
008A43 |
7.6685 |
0.7013 |
0.0286 |
0.5011 |
|
26 |
008A45 |
7.6435 |
0.6629 |
0.0301 |
0.4929 |
|
27 |
008A47 |
7.5685 |
0.6895 |
0.0268 |
0.4946 |
|
28 |
011A34 |
7.4860 |
0.6513 |
0.0302 |
0.4974 |
|
29 |
011A40 |
7.5610 |
0.6906 |
0.0282 |
0.4989 |
|
30 |
011A42 |
7.6329 |
0.6618 |
0.0252 |
0.5049 |
Table 4: Feature set values of d-hv-lbp-glcm for senior age images
|
S. no |
Image Name |
Contrast |
Correlati on |
Energy |
Homo geneity |
|
1 |
003A51 |
8.4213 |
0.6165 |
0.0262 |
0.4722 |
|
2 |
003A53 |
8.4213 |
0.6381 |
0.0278 |
0.4676 |
|
3 |
003A58 |
8.3158 |
0.6024 |
0.0255 |
0.4909 |
|
4 |
003A60 |
8.3658 |
0.6346 |
0.0271 |
0.4763 |
|
5 |
003A61 |
8.3543 |
0.6065 |
0.0267 |
0.4812 |
|
6 |
004A51 |
7.9646 |
0.6074 |
0.0233 |
0.4743 |
|
7 |
004A53 |
7.9212 |
0.5974 |
0.0261 |
0.4802 |
|
8 |
004A55 |
8.1146 |
0.6362 |
0.0271 |
0.4716 |
|
9 |
004A57 |
8.3713 |
0.6008 |
0.0268 |
0.4772 |
|
10 |
004A62 |
8.5488 |
0.6412 |
0.0269 |
0.4792 |
|
11 |
006A55 |
7.9146 |
0.6918 |
0.0228 |
0.4900 |
|
12 |
003A60 |
7.8212 |
0.6331 |
0.0261 |
0.4899 |
|
13 |
004A63 |
8.3213 |
0.6122 |
0.0250 |
0.4702 |
|
14 |
006A61 |
8.2658 |
0.6015 |
0.0272 |
0.4696 |
|
15 |
006A69 |
8.4488 |
0.5924 |
0.0261 |
0.4763 |
|
16 |
003A57 |
8.2043 |
0.6431 |
0.0268 |
0.4879 |
|
17 |
004A55 |
7.9212 |
0.6262 |
0.0254 |
0.4682 |
|
18 |
004A57 |
8.1543 |
0.6312 |
0.0238 |
0.4696 |
|
19 |
004A59 |
8.0146 |
0.7002 |
0.0257 |
0.4702 |
|
20 |
004A61 |
8.0212 |
0.6222 |
0.0260 |
0.4706 |
|
21 |
004A63 |
8.3658 |
0.6415 |
0.0256 |
0.4783 |
|
22 |
004A65 |
8.4988 |
0.7068 |
0.0277 |
0.4910 |
|
23 |
004A67 |
8.5213 |
0.6172 |
0.0264 |
0.4880 |
|
24 |
004A69 |
8.5488 |
0.6205 |
0.0266 |
0.4773 |
|
25 |
006A51 |
8.2543 |
0.7018 |
0.0236 |
0.4899 |
|
26 |
006A54 |
8.4658 |
0.6272 |
0.0279 |
0.4919 |
|
27 |
006A57 |
8.0146 |
0.6481 |
0.0234 |
0.4900 |
|
28 |
006A60 |
7.8712 |
0.6115 |
0.0259 |
0.4712 |
|
29 |
006A63 |
8.2543 |
0.6968 |
0.0282 |
0.4920 |
|
30 |
006A66 |
8.6488 |
0.6099 |
0.0266 |
0.4792 |
-
IV. Comparison of the proposed method with other
EXISTING METHODS
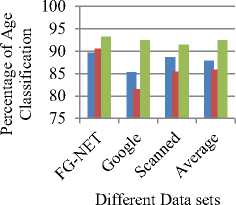
The proposed D-HV-LBP-GLCM method is compared with other existing methods like Identification of facial parts and RBF Neural Network Classifier proposed by M. Yazdi et.al [15] and two geometric features and three wrinkle features from a facial image proposed by Wen-Bing Horng [16]. The classification rates are listed in table 6. The graphical representation of this is shown in Fig.4.
Table 5: Test vector feature set values of d-hv-lbp-glcm for different dataset images.
|
Sno |
Image Name |
Contrast |
Correlation |
Energy |
Homo geneity |
Group |
Result |
|
1 |
gogle_im_01 |
7.6068 |
0.7334 |
0.0333 |
0.5109 |
Middle |
Success |
|
2 |
gogle_im_02 |
7.1457 |
0.7356 |
0.0267 |
0.4735 |
Child |
Success |
|
3 |
gogle_im_03 |
7.5497 |
0.7290 |
0.0264 |
0.4955 |
Young |
Success |
|
4 |
gogle_im_04 |
7.1462 |
0.7211 |
0.0264 |
0.4786 |
Child |
Success |
|
5 |
gogle_im_05 |
6.6068 |
0.6334 |
0.0223 |
0.4511 |
Middle |
Fail |
|
6 |
gogle_im_06 |
8.0669 |
0.6293 |
0.0244 |
0.4691 |
Senior |
Success |
|
7 |
gogle_im_07 |
7.5694 |
0.6674 |
0.0285 |
0.4946 |
Middle |
Success |
|
8 |
gogle_im_08 |
8.0377 |
0.6287 |
0.0246 |
0.4689 |
Senior |
Success |
|
9 |
gogle_im_09 |
7.5610 |
0.7238 |
0.0267 |
0.4954 |
Young |
Success |
|
10 |
gogle_im_10 |
7.5384 |
0.7342 |
0.0261 |
0.4956 |
Young |
Success |
|
11 |
076A14 |
7.1283 |
0.7557 |
0.0263 |
0.4749 |
Child |
Success |
|
12 |
077A00 |
7.1213 |
0.6691 |
0.0269 |
0.4914 |
Child |
Success |
|
13 |
082A20 |
7.4731 |
0.7625 |
0.0271 |
0.4963 |
Young |
Success |
|
14 |
082A25 |
7.5118 |
0.7590 |
0.0266 |
0.4961 |
Young |
Success |
|
15 |
067A33 |
7.5569 |
0.6662 |
0.0290 |
0.4960 |
Middle |
Success |
|
16 |
067A39 |
7.5610 |
0.6704 |
0.0293 |
0.4948 |
Middle |
Success |
|
17 |
048A52 |
6.5527 |
0.5520 |
0.0287 |
0.4971 |
Middle |
Fail |
|
18 |
048A54 |
8.2935 |
0.6068 |
0.0261 |
0.4699 |
Senior |
Success |
|
19 |
067A48 |
7.5548 |
0.6641 |
0.0289 |
0.4965 |
Middle |
Success |
|
20 |
048A65 |
7.0605 |
0.6912 |
0.0271 |
0.4953 |
Child |
Success |
|
21 |
sca.img-001 |
7.1248 |
0.7124 |
0.0266 |
0.4832 |
Child |
Success |
|
22 |
sca.img-002 |
7.4924 |
0.7608 |
0.0269 |
0.4962 |
Young |
Success |
|
23 |
sca.img-003 |
8.2797 |
0.6042 |
0.0266 |
0.4698 |
Senior |
Success |
|
24 |
sca.img-004 |
7.7123 |
0.6911 |
0.0257 |
0.4978 |
Young |
Success |
|
25 |
sca.img-005 |
6.2960 |
0.7141 |
0.0276 |
0.4835 |
Senior |
Fail |
|
26 |
sca.img-006 |
8.2866 |
0.6055 |
0.0263 |
0.4699 |
Senior |
Success |
|
27 |
sca.img-007 |
7.5073 |
0.7206 |
0.0275 |
0.4972 |
Middle |
Success |
|
28 |
sca.img-008 |
7.5451 |
0.6948 |
0.0276 |
0.4980 |
Middle |
Success |
|
29 |
sca.img-009 |
7.6983 |
0.7042 |
0.0255 |
0.4967 |
Young |
Success |
|
30 |
sca.img-010 |
7.1031 |
0.7134 |
0.0269 |
0.4844 |
Child |
Success |
Table 6: Classification rate of the proposed d-hv-lbp-glcm method with other existing methods
|
Image Dataset |
Identificatio n of facial parts and RBF Neural Network |
Geometric and wrinkle features |
Prposed D-HV-LBP-GLCM Method |
|
G-NET |
89.67 |
90.52 |
93.23 |
|
|
85.3 |
81.58 |
92.5 |
|
Scanned |
88.72 |
85.42 |
91.5 |
|
Average |
87.9 |
85.84 |
92.41 |
-
■ Identification of facial parts and RBF Neural Network
-
■ Geometric and wrinkle features
■ Prposed D-HV-LBP-GLCM Method
Fig 4: Classification chart of proposed method and other existing methods.
-
V. Conclusion
The proposed DL-LBP-GLCM reduced the computational time complexity because of the reduced size of the DL-LBP from 6561 to 14 as in the case of original LBP and 2020 to 14 as in the case of Fuzzy LBP. This new method combines the merits of both GLCM and DL-LBP for the effective age classification purpose.
References Age Classification Based On Integrated Approach
- Electronic Customer Relationship Management (ECRM). http://en.wikipedia.org/wiki/ECRM.
- G. Guo, Y. Fu, C. Dyer, and T. Huang. Image-based human age estimation by manifold learning and locally adjusted robust regression.IEEE Trans. Image Proc., 17(7):1178–1188, 2008.
- A. Lanitis, C. Draganova, andC. Christodoulou. Comparing different classifiers for automatic age estimation. IEEE Trans. on SMC-B, 34(1):621–628, 2004.
- N. Ramanathan and R. Chellappa. Face verification across age progression. IEEE Trans. on Image Processing, 15(11):3349–3361, 2006.
- E. Patterson, A. Sethuram, M. Albert, K. Ricanek, andM. King. Aspects of age variation in facial morphology affecting biometrics. InIEEE Conf. on Biomet-rics: Theory, Applications, and Systems, 2007.
- A. Gallagher and T. Chen, "Estimating Age, Gender, and Identity Using First Name Priors,"Proc. IEEE Conf. Computer Vision and Pattern Recognition, 2008.
- A. Gallagher and T. Chen, "Understanding Images of Groups of People,"Proc. IEEE Conf. Computer Vision and Pattern Recognition, 2009.
- Zak Stone, Todd Zickler and Trevor Darrell, " Toward Large-Scale Face Recognition Using Social Network Context", Proceedings of the IEEE, Vol. 98, No. 8, August 2010.
- T. Cootes, G. Edwards, and C. Taylor. Active appearance models. In European Conf. on Computer Vision, pages 484–498, 1998.
- K. Ricanek and E. Boone. The effect of normal adult aging on standard pca face recognition accuracy rates. In International Joint Conf. on Neural Networks, pages 2018–2023, 2005.
- X. Geng, Z.-H. Zhou, Y. Zhang, G. Li, and H. Dai. Learning from facial aging patterns for automatic age estimation. InACM Conf. on Multimedia, pages 307–316, 2006.
- X. Geng, Z.-H. Zhou, and K. Smith-Miles. Automatic age estimation based on facial aging patterns. IEEE Trans. on PAMI, 29(12):2234–2240, 2007.
- G. Guo, Y. Fu, T. S. Huang, and C. Dyer. A probabilistic fusion approach to human age prediction. InIEEE CVPR-SLAM workshop, 2008.
- Z. Yang and H. Ai. Demographic classification with local binary patterns. In Int. Conf. on Biometrics, pages 464–473, 2007.
- Y. Kwon and N. Lobo. Age classification from facial images. Computer Vision and Image Understanding, 74(1):1–21, 1999.
- A. R. Webb. Statistical Pattern Recognition, 2nd Edition. John Wiley, 2002.
- S. Yan, X. Zhou, M. Liu, M. Hasegawa-Johnson, and T. Huang. Regression from patch-kernel. In IEEE conf. on CVPR, 2008.
- K. Ueki, T. Hayashida, and T. Kobayashi. Subspace-based age-group classifi-cation using facial images under various lighting conditions. In IEEE conf. on FGR, 2006.
- G. Guo, Y. Fu, T. S. Huang, and C. Dyer. Locally adjusted robust regression for human age estimation. In IEEE Workshop on Applications of Computer Vision, 2008.
- S. Yan, H. Wang, T. S. Huang, and X. Tang. Ranking with uncertain labels. In IEEE conf. on Multimedia and Expo, pages 96–99, 2007.
- S. Yan, H. Wang, X. Tang, and T. Huang. Learning auto-structured regressor from uncertain nonnegative labels. InIEEE conf. on ICCV, 2007.
- V. N. Vapnik. Statistical Learning Theory. John Wiley, New York, 1998.
- S. Zhou, B. Georgescu, X. Zhou, and D. Comaniciu. Image based regression using boosting method. InIEEE conf. on ICCV, pages 541–548, 2005.
- J. Hayashi, M. Yasumoto, H. Ito, and H. Koshimizu. A method for estimating and modeling age and gender using facial image processing. In Seventh Int. Conf. on Virtual Systems and Multimedia, pages 439–448, 2001.
- M. Yazdi, S. Mardani-Samani, M. Bordbar, and R. Mobaraki "Age Classification based on RBF Neural Network" , Canadian Journal on Image Processing and Computer Vision Vol. 3 No. 2, June 2012 pages: 38-42.
- Wen-Bing Horng, Cheng-Ping Lee and Chun-Wen Chen "Classification of Age Groups Based on Facial Features", Tamkang Journal of Science and Engineering, Vol. 4, No. 3, pp. 183-192 Year: 2001.
