Agile Methodology for Identifying Original and Fake Printed Documents based on Secret Raster Formation

Author: Mariia Nazarkevych, Victoria Vysotska, Vasyl Lytvyn, Yuriy Ushenko, Dmytro Uhryn, Zhengbing Hu
Journal: International Journal of Computer Network and Information Security @ijcnis
Article in issue: 2 vol.17, 2025.
Free access
A method of identification of original and fake prints has been developed. Security elements are printed using an offset printing method, which we will call original printing. In parallel, we will print bitmap security elements on copiers. We will call this process fake printing. Such types of rasterisation were developed to make the difference between an original print and a fake print visible to the naked eye. A method of detecting fake printing has also been developed by measuring the change in the percentage of raster dot, dot gain, trapping, optical density, ∆lab, and change in tonality. The protection of the printed document is created when the image is transformed by amplitude-modulated rasterisation based on the mathematical apparatus of Ateb-functions. During rasterisation, we create thin graphic elements that have different shapes and are calculated according to developed methods. The size of a single dot of a raster element depends on the selection of the rasterisation method and the tonal gradation value of each corresponding pixel in the image. During rasterisation, a raster structure is formed, in which the value of each raster element is related by the value of the Ateb-function with tonal gradation, as well as a change in the angle, lines and shapes of the curves of a single raster. We offer raster image printing on various paper samples that are widely used today.
Secret Raster, Information Security, Rasterisation, Fake Printing, Printed Document, Ateb-functions
Short address: https://sciup.org/15019789
IDR: 15019789 | DOI: 10.5815/ijcnis.2025.02.04
Text of the scientific article Agile Methodology for Identifying Original and Fake Printed Documents based on Secret Raster Formation
It is common knowledge that the means and methods of protection become more modern and effective yearly. Nowadays, printed documents have ceased to play an essential role in the life of society. Still, the demand for them is rapidly growing because they are used to identify a person and to certify certain legal aspects. Such documents usually need protection, as they can easily be counterfeited. Therefore, there is a great need to develop effective means of protection for printed documents. Improving reliability is possible through security elements, namely raster elements. Security elements and latent elements have the property of changing the visibility of image elements when changing the observation conditions [1]. Using latent elements to protect printed documents from copying is particularly interesting to our research. However, nowadays, many technologies have been developed specifically for detecting hidden images in the original image and its fake printing [2]. Graphic protections are formed into a specific group, which consists of micrographics, hidden elements, vignettes, and rosettes. [3]. Reproduction difficulties are due to the complex geometric structure and the minimum possible line thickness. Even the most advanced digital technologies cannot create a reliable forgery of fine graphics and rasterisation [4]. The complex geometric structure in a group of geometric elements is determined by printing thin lines, which are very difficult to reproduce. By printing minimally thick lines in thin graphics, we create reliable means of protection against counterfeiting. [5]. A raster image can be detected using optical methods and digital filtering methods. Optical methods consist of creating a hidden image that becomes visible at a certain angle [6]. Images with security elements are printed using an offset printing method, which we will call original printing. In parallel, we will print a bitmap image on copiers. We will call this printing fake printing. We propose a method for designing security features that protect a printed document during transmission over a computer network. The method of protecting printed documents is based on developing an algorithm for splitting a halftone image into elements of a secret raster formed by Ateb functions. Therefore, the printed document will have information security, as it will be formed by a little-known mathematical apparatus based on the selection of parameters that will provide a secret raster shape that is securely transmitted over the network. A document is generated using the method developed by the publication's authors. Then, the generated secret elements are transmitted to the network, where they are transmitted and can be printed on offset printing machines with good reproduction quality. In contrast, non-professional printing equipment, such as office printers or digital printing machines, will print a document poorly, as the secret elements will 'disintegrate' due to the inability to reproduce micrographics.
2. Related Works
Although electronic media have become indispensable daily, paper remains one of the most common media for storing information. Consequently, the demand for the protection of paper documents is growing. Our development allows users to create templates with micro-raster graphics, possibly with variable information containing the customer's data or other confidential information, allowing them to monitor available data and view it in real-time. Entering variable data into the body of the program will enable us to adjust the print settings according to customer needs. In this way, we allow the customer to create a ready-to-print PDF file in real-time, allowing the customer to take responsibility for the print settings. Internet networks also make the production process faster and more efficient by creating automated steps. After ordering a PDF file, a working file containing all the order specifications is automatically created. The PDF file is then moved to a folder where it can be accessed by software that turns it into a ready-to-print template. The order template is transferred to the offset printing machine. When lighting the printing plate for further printing on an offset machine, single dots' size and shape change depending on the parameters with which the document is formed.
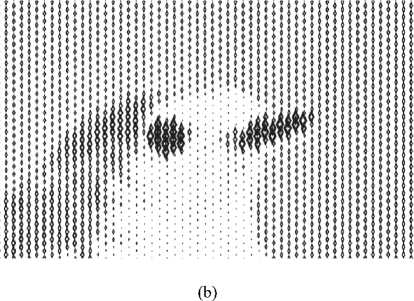
Security elements transmitted over the network and printed with isolated dots by an offset typewriter tend to look with significant tonal distortion and reveal changes in the tone of the page (Fig. 1). If a copy of the security elements is made, this method detects them and captures the fake printing.
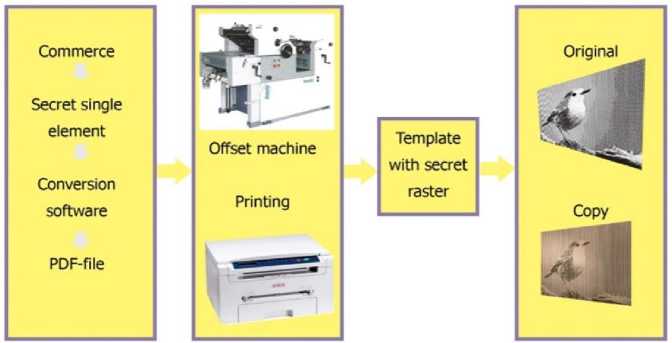
Fig.1. Scheme of the proposed method of protection of latent elements and creation of fake printing
To reduce the number of counterfeits [7], the printing industry uses many security technologies. Different printing combinations can achieve a higher level of security for a printed document. By implementing new types of rasterisation, a lower level of falsification of printed documents can be achieved.
The development of 3D printing is being observed as new technologies allow for the construction of threedimensional 3D models. In [8], the formation of 3D models is considered, where a 3D model is created layer by layer using a raster. For 3D images, it is necessary to use very thick inks, which is an unsolved problem for forming a secret raster.
3D printing with a secret raster will be an effective means of protection since very few users have 3D printing equipment. The manuscript briefly mentions the use of 3D printing in future work but does not explain how this relates to the current research. More context on how 3D printing could enhance document protection would be helpful.
The role of 3D printing in document protection. One of the promising areas for improving document protection is the use of 3D printing to create multi-level protective structures.
Advantages of 3D Printing
-
• Relief protective elements are created based on the formation of microscopic protrusions and depressions that cannot be reproduced using conventional copying.
-
• Dynamic visual effects, i.e. elements that change appearance depending on the viewing angle, increase the complexity of counterfeiting.
-
• Possibility of integration into existing printing processes, in particular, the use of 3D printing together with traditional printing methods.
Use within the Framework of the Current Study
-
• Modification of the secret raster based on the use of Ateb functions to create a microrelief.
-
• Combination with densitometric methods based on the analysis of changes in the reflective properties of the
document surface.
-
• Adaptation to offset printing based on the development of hybrid technologies combining 2D and 3D printing.
In [9], in the industrial production of products using the digital printing method, the task is to ensure stable visual characteristics of images on different paper types. Evaluation of the performance of digital prints on various materials is based on determining the optical characteristics of prints, measuring image gradation, colour tone and brightness, and uniformity of ink layer distribution on prints. In [9], the values of the predicted printing results were obtained considering the papers' properties.
In [10], algorithms for authenticating 3D printing models on cost-effective equipment were developed. New methods for authenticating commercial raster printing are identified as critical.
The human eye can distinguish [11] printed documents printed with a resolution of 0.072 mm or 350 lpi at a distance of 250 mm. The human eye does not distinguish two dots or lines closer to this distance as 2 separate elements. According to Nyquist's theorem, the distance between raster dots at the focal point of the eye should be half the specified dimensions for reliable distinction by the human eye. Applying this theorem when viewing an object at a distance of 250 mm, size variations can still be detected at 700 lpi (2 x 350). This study shows the numerical values of the resolution. The exact dimensions of raster dots are taken from the literature. Measuring the precise dimensions of raster dots is not a simple task since all raster dots have different sizes and undergo complex stages of conversion from computer size to paper.
The relevance of the size of the raster dots to the overall objectives of the study. One of the key objectives of the article is to develop a unique secret raster that cannot be reproduced qualitatively using conventional copying devices. The choice of the exact size of the raster dots plays a critical role in achieving this goal:
• The size of the dots from 40 to 100 microns allows you to create a structure that is perceived as a solid tone by the human eye but changes when copying.
• The optimal line spacing of 150-200 LPI ensures that the secret elements are clearly displayed on the original print but lose quality in counterfeits.
• The minimum line thickness of 60-80 microns for favourable execution and 80-100 microns for negative execution provides a balance between detail and resistance to distortion during printing and copying.
• The shape of the dots, selected using Ateb functions, guarantees the uniqueness of the structure, which cannot be accurately reproduced by laser or inkjet printers.
3. Methods
3.1. Method for Creating Security Printed Documents and Fake Printing
Thus, the precise dimensions of the raster dots are directly related to the overall research objectives, ensuring uniqueness, difficulty of reproduction, and resistance to copying. It allows for the creation of documents with a high level of security without the need for expensive materials or equipment.
Rasterisation transforms vector elements into a raster map [12]. A raster map can be displayed on a computer, video, or printer or saved as a bitmap. The bitmap can be transmitted securely over the network since the relationship with the mathematical engine that generated the raster elements is lost. If there is a threat of falsification of the document, it will be detected because the shape and contours of the raster element are unknown to the user. To change the document, it is necessary to once again convert the vector elements into a bitmap using the mathematical support developed by the authors. However, there is no consideration of which mathematical apparatus performs this transformation, and the expediency of introducing a particular mathematical apparatus is not substantiated.
In the MEBES eXara system [13], documents with a line thickness of 90 nm were created, which is achieved by the high resolution required to develop transparent backgrounds. Ensuring the high quality of printed documents is achieved by introducing specific masking and creating a pattern generator.
In [14], a new algorithm is proposed that allows embedding secret messages in the bitmap for hiding using compression. This operation is performed in three main phases: the first phase is when the original image is converted to a bitmap; the second phase is steganography, in which a binary secret message is hidden inside the bitmap using a 4×4 array as a secret key; and the third phase is when the bitmap is compressed using a wavelet packet. The result is a highly efficient algorithm that quickly hides information, thus protecting against information disclosure. In lossless compression, compression is achieved by eliminating spatial and spectral iterations, leading to document quality changes that are not observable to the human eye. One of the main requirements of information acquisition is that such information should be invisible.
The purpose of the research is to develop a method for protecting and authenticating documents based on a new form with secret raster formation. When the raster form is associated with a unique mathematical formula unknown to anyone except the developers, this creates protection for both electronic and printed documents. The purpose of this research was also to show various forms of a raster cell that are particularly difficult to reproduce in print and require specialised software to create them. These include complex geometric shapes, voids inside a raster cell, or raster cells generated by fractal curves. The use of the unknown mathematical apparatus of Ateb functions allows you to introduce secrecy into electronic documents since the shape of the raster cell will depend on the two parameters that generate the Ateb function. Verification of the authenticity of the document occurs visually, which is especially valuable because it does not require additional capital investments. Also, devices that allow you to assess the quality of printing reproduction and, therefore, consider the shape of the raster cell.
In this article, we propose a new method for creating security printed elements and identifying them on prints [15] to confirm the document's authenticity. The technique combines a regular raster (AM) and a stochastic raster (FM) and is screened in a single document. There are two ways to separate documents for AM and FM visualisation. The first is to select several random intervals in the shadows of the tonal distribution, and according to the values in these intervals, the original document is divided into two parts. The second is to split by structure, using FM visualisation of edges or textures. It is implemented using the Canny edge detector and local binary templates. With the help of random parameters, you can generate some print runs or even individual prints. The large number of variants of separation zones gives reason to believe that the proposed method is reliable. Authentication is implemented by obtaining a digital document of the print by scanning or photographing it and comparing the spectral composition of the original document and the digital document. An expert survey showed that after our methodology, a combination of AM and FM screening in the document on prints is barely noticeable.
Raster generator (SRG) [16] implements digital processes in the form of a median filter, histogram transformation, amplitude thresholding, Gaussian filters, low-pass filters, high-pass filters, Laplace filters, and edge smoothing (Roberts, Prewitt, Sobel).
In [17], the characteristics, properties, and generating sequences of line tracking algorithms for incremental devices are summarised, and the mappings of one to another are discussed. A new separation method based on derived code sequences and code templates is presented, which leads to significant compression of the code sequence (more than 40%) in most cases and, more importantly, to a significant overall reduction of 20% to 43% of the total CPU usage. The algorithm of sequence coding is presented.
Today, the most widely used security technology is the detection of counterfeit printing, but the implementation of such methods is not sufficiently considered. A critical task for implementation is the availability of reproduction of printed documents on offset printing machines and, as a counterweight to such machines, reproduction on photocopying equipment or equipment that works by electrographic reproduction. These are two fundamental differences in the reproduction of printed documents.
To assess the effectiveness of different methods of document authentication, it is essential to consider how they work in actual printing conditions and using various materials.
-
• The influence of the type of printing machines. Different printing technologies can have different effects on the reproduction of secret raster elements. Offset printing (traditional printing machines Heidelberg, Komori, Roland) provides high accuracy in the transmission of raster details, which makes it the best option for document authentication. Laser printing (Canon, Xerox, HP) has limited accuracy in reproducing the raster structure, which leads to the loss of fine details when copying attempts. Inkjet printing (Epson, Brother) is prone to ink
bleeding, which can lead to additional distortions of the secret elements. Digital printing (Indigo, Ricoh) can partially imitate offset quality, but secret raster elements are still subject to distortions due to a different printing principle.
-
• The influence of paper materials. The quality and texture of the paper also play an essential role in preserving the secret raster. Glossy paper preserves the precise contours of raster dots well, which improves protection against counterfeiting. Matte paper can partially absorb ink, which causes a change in the shape and contrast of raster elements. Porous or watercolour paper can significantly distort the raster structure, making it difficult to verify authenticity. Plastic media (polymer documents, ID cards) provide stability for the secret raster but require unique printing methods.
-
• Real applicability of identification methods. Different authentication methods may have different effectiveness depending on the conditions of use. Spectrophotometric analysis is adequate for offset printing on high-quality paper and is less effective on porous surfaces. Optical analysis using Canny Edge Detection works well for documents printed by laser or offset but may give errors when printing inkjets.
-
3.2. Algorithm for Modelling and Developing Secret Elements
The secret exchange of digital bitmaps was studied in [18]. Digital bitmaps are encrypted using an Arnold transform scrambling technique, and the encrypted images are shared to implement secret map sharing. The effectiveness of secret sharing is verified using independently developed software.
Lines of fine graphics are determined by the minimum thickness of the line that the printing press can reproduce. Line thickness for favourable execution of lines varies between 40-80 μm and negative - 60-100 μm [19]. The main element of a raster image is a dot. The more raster points per unit area, the more natural the image looks [20].
The dot size of a raster image depends on the image's rasterisation settings. During rasterisation, a grid of lines is superimposed on the original, one cell of which forms a raster element. The grid frequency is measured in lines per inch (LPI) [21]. Since a raster dot consists of individual pixels, the number of gradation levels is determined by the size of the raster cell and the resolution in dots per inch (DPI).
It is known that the human eye, when observing a raster structure with a lineature of more than 60 lines/cm (150 lines per inch) from an average distance of about 30 cm, ceases to distinguish individual raster points [22].
Many typewriters print images with a maximum raster line size of 120-160 lines per inch. To reliably reproduce pictures, it is vital to create elements that are well printed by an offset printing machine. Such an imprint is considered to be the original. However, copying the original document on a photocopier may often be necessary. The number of gradations also depends on the optical density, namely the range of optical densities.
Not all secret methods for constructing printing elements are freely available, so it is challenging to make a comparison. However, there are well-known, established printing methods and known printing materials, which are described in sufficient detail in this study. Although the document mentions experiments on paper samples and copiers, it does not contain enough technical information about the experimental setup, the parameters used, or the method of measuring the results. Established methods for authenticating printed documents include paper-based authentication, authentication based on special types of ink, authentication based on a unique printing method, or a combination of different printing methods and visual cryptography and optical watermarks [23]. Cryptographic protection methods are used for electronic documents, which are being improved every day, as the power of computer technology increases and attacks on electronic documents increase. The method we propose combines protection for both electronic ones since it is based on a secret mathematical apparatus, and for printed ones, since it reproduces a raster of a unique form. Methods for authenticating the reproduction of the electronic form of a raster cell are not given in this study. It is the topic of another work. The main emphasis is on the authentication of printed documents, which is the basis for the experiment. The results were measured using the Spectrophotometer X Rite Spectroeye, which allows for a full range of measurements.
To assess the effectiveness of the proposed method, it is essential to compare it with other widely used document authentication methods (Table 1).
Table 1. Comparison with traditional document authentication methods
|
Method |
How it works |
Advantages |
Disadvantages |
|
Holographic protection [23] |
Using holograms that change the image at different angles of illumination |
High level of visual complexity for counterfeiting, possibility of verification without special equipment |
High production cost, requires special equipment for production |
|
Microtext [22] |
Printing small text that is not visible to the naked eye |
Easy to verify using magnifying devices |
Can be reproduced by high-quality copiers |
|
UV labels [23] |
Printing visible or invisible markings that appear under ultraviolet light |
Relatively easy to implement, accessibility of verification |
Requires UV lighting for verification, can be counterfeited with similar inks |
|
Watermarks [23] |
Embedded images in paper that are visible in the lumen |
High reliability, difficulty of counterfeiting |
Requires special paper, high production cost |
|
Proposed method (secret raster based on Ateb functions) |
Creating complex graphic elements that distort when copied or digitally reproduced |
Easy implementation in printed products, low cost, automated verification via spectrophotometry |
It may lose some effectiveness on low-quality paper or in unstable printing conditions |
Advantages of the proposed method
-
• Low implementation cost – unlike holograms and watermarks, the method does not require special paper or expensive equipment.
-
• Possibility of automated verification – the use of a spectrophotometer allows for accurate detection of counterfeits.
-
• Resistance to copying – when attempting to digitally copy or print on laser printers, the secret raster elements are distorted, making counterfeiting easily detectable.
-
• Flexibility in application – the method can be used in various areas, including documents, securities and product labels.
The incomplete Beta function is a representation of the integral [24]:
^ x,p,q
_ rXU ^ 1(1-u') 1
= J 0
Beta(p,q)
(
lx,p,g ^ x,p,g
1 +
V
a i
^ 2 2^ .
X in
+ bn J
where di, a2, а з , ..., on b i , b2, b3, ..., b n
coefficients calculated by formulas:
■ pf(q-1)
q(p+1) if n> 2
p2f2(n-1)(p+q+n-2)(p+n-1)(q-n)
. q2(p+2n-3)(p+2n-2)(p+2n-1)
b
n
_ 2(pf+2q)n 2 +2(pf+2q)n+pq(p—2—pf )
q(p+2n-2)(p+2n)
r — qx p(1-x)
P n+1 , q m+1
V n+1 , Q m+1
n+1
where m are nrational numbers. If p > 0, q > 0 then /x , p , q is definite and continuous, and for other actual values p, q it also goes to infinity (Table 2).
Table 2. Simulation and visualisation of a raster cell (secret element) with incomplete Beta function, which formed the basis of the formation of secret elements
|
# |
m |
n |
of a raster cell visualisation |
# |
m |
n |
of a raster cell visualisation |
|
a) |
0.1 |
1 |
Mt |
f) |
1 |
0.333 |
Mt |
|
b) |
0.01 |
0.1 |
Mt |
g) |
7 |
1 |
H |
|
c) |
1 |
0.2 |
Mt |
h) |
7 |
0.333 |
H |
|
d) |
1 |
1 |
Mt |
i) |
7 |
0.1 |
♦^ |
|
e) |
0.1428 |
1 |
"M |
j) |
0.1 |
7 |
MM |
Ateb-functions constructed for values (6) are called periodic [25], and for values (7) – aperiodic Ateb-functions[26].
-
3.3. Raster Image with New Forms of Raster Dots
The advantage of Ateb functions is that it is a mathematical apparatus unknown to the general public, which also has a relatively high computational complexity [3]. The formation of a raster cell, that is, the transformation of a number obtained by calculating a complex mathematical apparatus into a graphical representation, is also an element of protection and is more protected than other known protection methods. Ateb functions, along with other little-known functions, have a number of advantages. Among them are the following: high computational complexity. Ateb functions are incomplete compared to beta functions; therefore, they are inverse functions and incomplete. To calculate them, you need to develop your software. It makes it possible to create protection against the implementation of the developed method. Today, inaccurate methods of constructing curves, such as Bezier curves based on splines, are used to form a raster cell. These curves are constructed in good shape, but the points of the curves do not pass through the exact values of certain mathematical expressions. A good shape of the curves is achieved by losing the accuracy of the calculations. The authors proposed the implementation of precise values of mathematical expressions with a good and non-standard shape of the curves, which is shown in Table 1. The construction of the secret elements described in (1) - (2) made it possible to create new forms of raster points. New forms of raster dots will protect the printed document when copying [27]. An example of such an implementation is shown in Fig. 2.
Enter the width and height of the image
Enter the size and shape of the raster cell

Introduction of the method of changing the size of the raster cell
Fig.2. Raster method
The next experiment will be devoted to the construction of asymmetric single-raster elements. Therefore, we further assume that m=n and use the superellipse curve instead of the generalised superellipse to construct the raster.
The calculated and rasterised elements of the raster with a change in the filling of the area of the raster cell from 0 to 100% are presented in Fig. 3. To change the shape of the raster elements, the values of parameters m and n were changed from 0.1 to 7 (see Table 2).
(a)
Fig.3. Secret elements based on periodic Ateb-functions (m = 1, n = 1)
To create a full-colour image, we needed to replicate the same steps in the CMYK colour palette. A rotation of 15 ° or 105 ° is used for blue paint, 75 ° or 15 ° for magenta paint, 0 ° or 90 ° for yellow paint, and 45° or 135 for black paint. The presence of colour printing makes the document more secure. In future research, we plan to build secret elements with 3-D printing. It allows for an increase in the secrecy of the document.
-
3.4. Secret Raster Function
In the work, a series of experiments on the formation of various types of secret elements was carried out. All works were performed in shades of grey. However, these developments could be transferred to a colour image by applying the same steps to Cyan, Magenta, Yellow, and Black. It is also possible to use non-standard paints. In addition, this, in turn, additionally increases the degree of protection. Also, as a development of this technology, it is possible to build secret elements in 3-D dimensional space, which will further increase the degree of protection.
A circular secret element was chosen because it proved the easiest way to reproduce and print on all materials. When implemented by the offset printing method, the single element is round. Accordingly, copies made from a round shape will have the least distortion. Accordingly, other secret elements have an even greater degree of protection. Data from densitometric measurements between the original and the copy will be more critical in determining the authenticity of the printed document. Therefore, using various secret elements is considered more desirable and practical in protecting the document's network transmission.
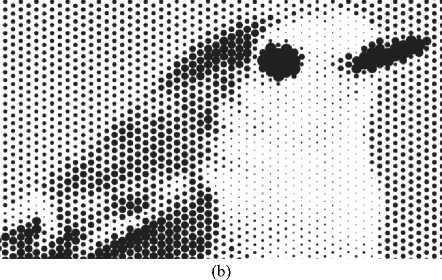
A raster form of other geometric shapes has also been developed. The raster based on the calculation of the area of Ateb functions is shown in Fig. 4. The filling of the area is 50%. Accordingly, during rasterisation, pixels with smaller grayscale values have a smaller fill area. It is visually represented in Fig. 5 a and Fig. 5 b. The raster points will have the same concave diamond shape if the print is made of quality materials. When making a copy of such an image, the concavity on the rhombus will be filled with paint or powder. As a result, originality will be lost.
+++++++++++ +++++++++++ ++++++-H+++ +++++>++♦+♦ ^¥^¥^k
Fig.4. Secret cells with 50% filling of the plane. The shape point is calculated based on the Ateb-functions
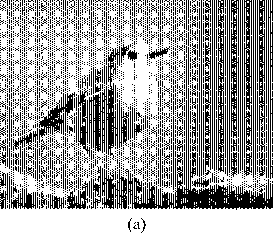
Fig.5. (a)- some elements of the printed document, based on Ateb-functions; (b)- an enlarged fragment
(b)
Fig. 6 and Fig. 7 represent a raster based on a rhombus with an inside with a gap. When creating a copy, the gap will be filled with powder and black paint due to the heat transfer phenomena used in copying.
wwww wwww «wwww wwww «wwww
Fig.6. The form of a secret element, 50% filling of the plane
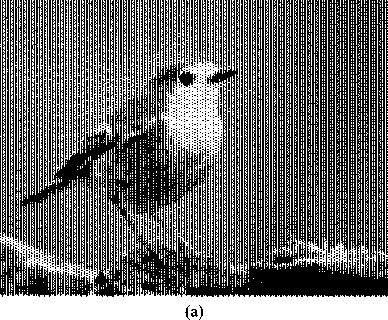
Fig.7. (a) some elements of the printed document based on a secret raster; (b)- an enlarged fragment
Also, it is proposed to use 3-D rasterisation in [28]. The work was reviewed from the standpoint of our methods of rater formation. We consider this study promising, and in the future, we plan to try to perform rasterisation in 3-D format.
Suppose we use the form of a secret element by a fractal curve, for example, a Koch snowflake [29]. In that case, we obtain protection against forgery, which will have an even higher level of protection against (Fig. 8) copying. The security of a fractal curve lies in creating an infinite fractal curve, which is limited to reproducing a single minimal object by a typewriter.
(a)
Fig.8. (a)- some elements of the printed document based on Koch fractal snowflake; (b)- an enlarged fragment
(b)
The secret raster function is formed on the basis of the solution of Ateb functions with specific parameters, and as a result, a secret raster form is formed. A particularly complex reproduction of a raster dot, as shown by numerous experiments, was demonstrated by the raster dots in Fig. 6, 7. Also, excellent results are presented by the raster dot, which is built on fractals., as shown in Fig. 8.
-
3.5. Densitometric Measurements of Originals and Fakes
The results were measured using the X Rite Spectroeye Spectrophotometer, which allows for a full range of measurements.
Description of the experimental setup, parameters and measurement methods used in the study.
-
A. Experimental Setup
-
• Printing equipment. Two different types of equipment were used to print the original documents and their copies. The original printing was performed on an offset printing machine, which provides high printing accuracy and the possibility of using a secret raster. Printing was performed using amplitude-modulated (AM) and frequency-modulated (FM) rasterisation. Ateb functions were used to generate the secret raster. Fake printing (Fake Printing) was performed using copiers (Canon, Xerox, Hewlett-Packard). These devices use digital image reproduction, which distorts the secret raster elements.
-
• Paper samples. Experiments were performed on 14 different types of paper, which differed in density, texture and ink absorption capacity. Among the samples are Canson, tracing paper, 90 g/m², 4CC silk fibre paper, Optima Adhesive, Folia Fotokarton, Canon Plus Glossy II PP-201 and Star Dream Moon Stoo. Each sample was used to print 50 copies, which were then analysed and compared.
-
• Raster structure and formation of a secret image. The study used secret raster elements based on Ateb functions. The parameters m and n in the Ateb function equations determined the size and shape of individual dots. In the
process of printing on offset equipment, round, diamond-shaped or fractal raster dots were formed. For colour printing, standard CMYK angles were used (for example, black - 45° or 135°, blue - 15° or 105°).
-
B. Experimental Parameters. The following parameters were measured during the experiment:
-
a. Raster properties
-
• Raster line (lines per inch, LPI): from 60 to 150 LPI.
-
• Dot shape and size: determined by Ateb functions that created periodic or aperiodic structures.
-
• Raster dot fill percentage: analysed the relationship between the original print and the counterfeit.
-
b. Printing properties
-
• Ink spread (Dot Gain):
o Mechanical and optical dot gain measurements were performed.
o Changes from 0% to 20% were determined depending on the type of paper.
-
• Tonal gradation:
o The change in brightness was measured for four levels of black: 25%, 50%, 75% and 100%.
o For each level, deviations in the print and copy were determined.
-
• Trapping:
o The extent to which the inks mix on the printed surface was assessed.
o Optical density coefficients for two-color fields were determined.
-
C. Methods of Measuring Results
During optical analysis (densitometry), X-Rite Spectro Eye spectrophotometers were used to measure, in particular, optical density (comparison between the original and the counterfeit), ink distribution in raster elements and tonal range (∆Lab). In the original print, the secret elements remained clear and stable. In the counterfeit copies, lost details, changes in brightness, and smearing of dots were observed.
When measuring the raster structure, the Canny edge detector algorithm was used to analyse the contours of raster elements. An automated comparison of the spectral composition of the original and the copy was performed. Changes in the geometry of raster dots in counterfeit documents were detected.
A comparison of characteristics between the original and the copies is given in Table 3.
Table 3. Investigated parameters
|
N |
Name |
Research object |
Range |
Disadvantages |
|
1 |
Dot Fill Percentage |
Originals |
74% – 100% |
The loss of detail in copies reached 50-80% |
|
Copies |
1.5% – 13% |
|||
|
2 |
Dot Gain |
Original |
80 – 105 |
Significant ink bleeding was observed in copies. |
|
Copies |
0.02 – `20.4 |
|||
|
3 |
Tonal Shifts (∆Lab) |
Original |
L = 88 – 108, a = 42 – 80, b = 15 – 41 |
Significant changes in colour reproduction |
|
Copies |
L = 73 – 102, a = 2.5 – 14.2, b = 4.8 – 23.9 |
Secret rasterisation based on Ateb functions effectively protects documents from counterfeiting. Copiers cannot accurately reproduce fine raster elements, which allows for the identification of counterfeits using densitometric analyses. Spectrophotometric measurements allow for the automatic identification of counterfeit documents due to discrepancies in optical density and tonal gradations. A series of experiments with different types of paper and equipment have confirmed the effectiveness of the method.
Identifying a copy from the original is based on densitometric measurements of the percentage change in raster linearity, percentage change in the raster point, point increment of a secret element, trapping, optical density, tonal change, ∆Lab.
Raster linearity significantly affects the size of a secret element in the rasterisation process. Being equivalent to the level of natural noise of the reproduction process, they are determined by the smoothness of the paper, the type of printing machine, the properties of the plate and ink, as well as the specifics of the interaction of the latter with the plate and paper during the printing process. In particular, in the case of random offset printing, the average raster line is 60 lines/cm, corresponding to a value of 150 LPI with a minimum raster dot of 20 microns. The printability of raster elements is 397% [5].
However, the number of reproducible gradations and smoothness of tone reproduction decrease if the lineation is increased without adequate reduction of the level of natural noise of the plate and printing processes [30]. The quantitative expression of this trade-off is the value of the relative areas of minimum points and gaps.
Percentage change in the raster point. Protecting the minor print elements and gaps is critical in the raster elements printing process. However, originals sometimes vary significantly in their content. Some fine details and contours are predominant and of primary importance. As the geometric dimensions increase, the deviation gradually increases, reaching a maximum negative value of -25%, and then gradually decreases and tends to zero. Since the secret element's relative area corresponds to the printed document's optical density, the component's average size lightens the document's mid-tones compared to the original. Thus, the raster transformation distorts the tone [31]. The nonlinearity of the normalised raster transform distorts the tone reproduction. Namely, light tones are brightened, and grey tones are darkened. Therefore, you need to adjust the document transformation for round elements.
As the rhombic element's geometric dimensions increase, the rhombus's surface is gradually limited to a raster square. It distorts its shape and becomes an octagon.
Point increment of a secret element . Dot gain is an increase in the size of raster elements on the print compared to their size on the printing plate. The effect of increasing the size of secret elements is caused by mechanical and optical factors [32].
Mechanical enlargement of the dot occurs due to the leakage of printing ink beyond the boundaries of the printing elements. The amount of mechanical expansion is influenced by the following factors: printing pressure, ink viscosity, the amount of ink transferred to the printing material, and paper characteristics.
The increase in optical dots is due to the scattering of light in the thickness of the paper. Light penetrating the unprinted surface of the paper is scattered and coloured as it passes through the ink layer. This results in an increase in optical density. This phenomenon affects the gradation characteristics of the document and can lead to significant distortion. Currently, correction is used at the prepress stage to compensate for the increase in the size of raster elements. [33].
To control the expansion during the printing process, measuring the optical density of 40 and 80% of the fields of the control scale is necessary. The spreading amount is defined as the difference between the actual (measured) and nominal areas of the raster fields [34].
Trapping. The trapping value is determined using a densitometer or spectrodensitometer by measuring the reference scale's optical density of two-colour (binary) fields. To calculate the ink application score, we also need to measure the optical density of one colour in 100% of the fields of the respective inks. Densitometric measurements are usually carried out through the second paint's zonal light filter, which causes its characteristics to have a significant impact on the score.
The trapping process aims to compensate for inaccuracies in the printing press when printing in multiple colours, especially when text or other elements are printed inverted [35].
Optical density. Optical density is a value that describes the opacity of a material layer and is measured by the decimal logarithm of the inverse of the transmittance. This value represents the degree of attenuation of optical radiation in layers of various substances due to the absorption and scattering of light as it passes through the layer under study. The optical density of transparent originals should be checked by measuring the transmitted light with a densitometer. And the optical density of opaque originals requires measuring the reflected light [35, 36].
The value of the minimum optical density should be measured in the lightest neutral areas. The lowest values obtained should be taken as the minimum optical density of the original. Most of the values obtained should be considered the maximum optical density of the original [37].
Tonality changes . Depending on the type of paper and its printing and technical properties, offset printing can change the tone of the ink. If the paper is soft, it requires less pressure than hard and coarse paper. You need to determine the amount of print pressure. If the pressure is insufficient, less ink is transferred to the printed surface, and the prints remain unprintable. Excessive pressure causes the ink to shrink, which distorts the document: the change in tone increases the size of strokes and raster elements [38].
∆Lab. The original's optical densities range should be checked by calculating the difference between the maximum and minimum optical densities of the document on the original. The optical density is affected by the thickness of the ink layer and the intensity of the ink, paper moisture, and moulds. The clarity of the document reproduction on the original must be checked visually. The boundaries of the blurred transition zone should be determined visually, looking for the initial beginning and end of a visually noticeable change in optical density. [39, 40].
4. Experiments and Results and Discussion
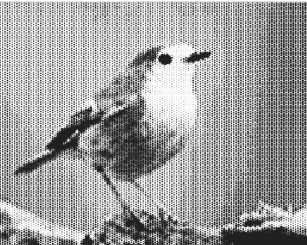
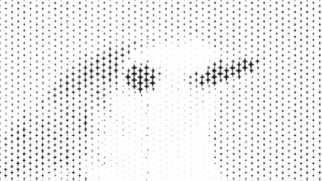
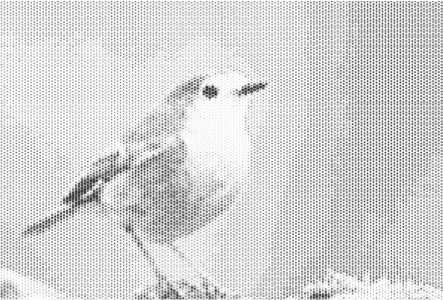
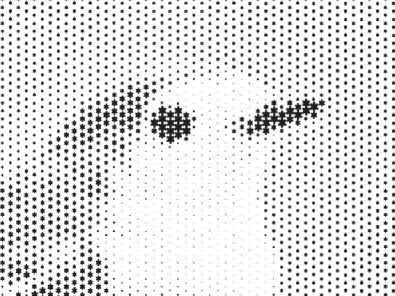
During the study, experiments were conducted on 14 paper samples, on which a document with rasterised secret elements was displayed. Three copies of each document were printed on different Canon, Xerox, and Hewlett-Packard copiers (Fig. 9). Originals and copies of various types of documents were studied, as well as the ability to detect copies [41, 42]. The X-Rite spectroeye spectrophotometer was used to determine the originality of the document [43, 44, 45].
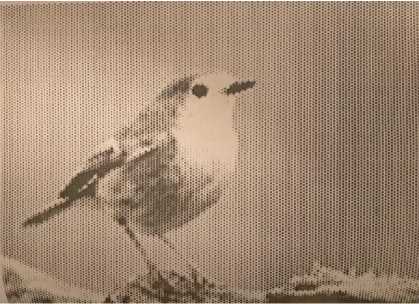
Fig.9. A copy of the document projected by the Ateb-functions. Fake printing
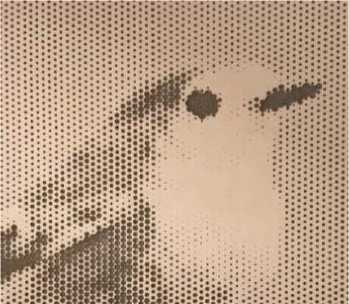
Table 4. Comparative characteristics of the percentage of the raster dot in the original document and fake printing
|
N |
Name |
% of raster point |
Copy 1 |
Copy 2 |
Copy 3 |
|
1 |
Canson, tracing paper, 90g/m2, France |
80 |
1.9 |
6.62 |
4.88 |
|
2 |
4CC silk fibre paper |
96 |
5.23 |
3.68 |
2.06 |
|
3 |
4CC calendered paper |
90 |
8.52 |
1.5 |
1.03 |
|
4 |
Sirio Pearl oyster shell |
74 |
8.24 |
5.94 |
1.14 |
|
5 |
Optima Adhesive |
99 |
7.9 |
3.5 |
1.02 |
|
6 |
Folia Fotokarton |
62 |
11.04 |
2.25 |
7.36 |
|
7 |
Embossed aquarelle card paper |
98 |
1.48 |
1.5 |
3.03 |
|
8 |
Canson tracing paper, 200 g/m2 |
99 |
7.63 |
2.7 |
1.7 |
|
9 |
Fedrigoni constellation jade riccio |
87 |
5.87 |
12.5 |
1.04 |
|
10 |
Constellation ivory. |
66 |
1.9 |
1.4 |
2.51 |
|
11 |
Two-sided coated paper. Art-Tech - Gold East Paper |
56 |
9.6 |
11.4 |
2.2 |
|
12 |
Stardream peridot |
98 |
9.8 |
9.01 |
2.8 |
|
13 |
Canon Plus Glossy II PP-201 |
95 |
9.5 |
7.2 |
5 |
|
14 |
Star Dream Moon Stoo |
100 |
13 |
1 |
3 |
Table 5. Comparative characteristics of raster element dot gain in the original document and fake printing
|
N |
Name |
Dot gain, ∆G |
Copy 1 |
Copy 2 |
Copy 3 |
|
1 |
Canson, tracing paper, 90g/m2, France |
80 |
0.07 |
1.12 |
0.08 |
|
2 |
4CC silk fibre paper |
81 |
1 |
0.04 |
1.06 |
|
3 |
4CC calendered paper |
84 |
2.04 |
0.7 |
0.03 |
|
4 |
Sirio Pearl oyster shell |
96 |
3.06 |
5.94 |
0.014 |
|
5 |
Optima Adhesive |
80 |
4.08 |
2.02 |
0.02 |
|
6 |
Folia Fotokarton |
100 |
5.02 |
8 |
0.1 |
|
7 |
Embossed aquarelle card paper |
99 |
6.02 |
8.024 |
0.03 |
|
8 |
Canson tracing paper, 200 g/m2 |
86 |
8.06 |
7.027 |
8.1 |
|
9 |
Fedrigoni constellation jade riccio |
95 |
10.02 |
8.63 |
20.4 |
|
10 |
Constellation ivory. |
87 |
6.05 |
7.14 |
1.1 |
|
11 |
Two-sided coated paper. Art-Tech - Gold East Paper |
100 |
7.03 |
6.05 |
0.5 |
|
12 |
Stardream peridot |
94 |
20.2 |
5.4 |
0.8 |
|
13 |
Canon Plus Glossy II PP-201 |
98 |
18.01 |
20.2 |
0.8 |
|
14 |
Star Dream Moon Stoo |
105 |
0.05 |
0.5 |
0.7 |
A small circulation of about 50 copies was printed on each paper sample. Then, copies of each original were made on the copiers mentioned above, such as Canon, Xerox, and Hewlett-Packard. Here are some paper samples on which a document with a secret raster was printed.
Printed elements were analysed for the originality levels of printing on paper with the help of a spectrophotometer Spectro Eye. Indicators are identified by measuring density, compression, raster point area, trapping, and contrast. Spectro Eye includes CIE L * a * b * colourimetric functions (ISO 13655 certified) for accurate colour control and measurement.
Visual inspection is often used to assess the accuracy of document reproduction, which allows obtaining specific qualitative characteristics.
Tables 4-9 present comparative characteristics of change raster point, trapping, optical density, and dot gain measurements in the original document and fake printing. Fig. 10-13 shows the visualisation of densitometric measurements. The red colour shows the curve densitometric indicators of the original, and other colours, including green and blue - show densitometric indicators of copies.
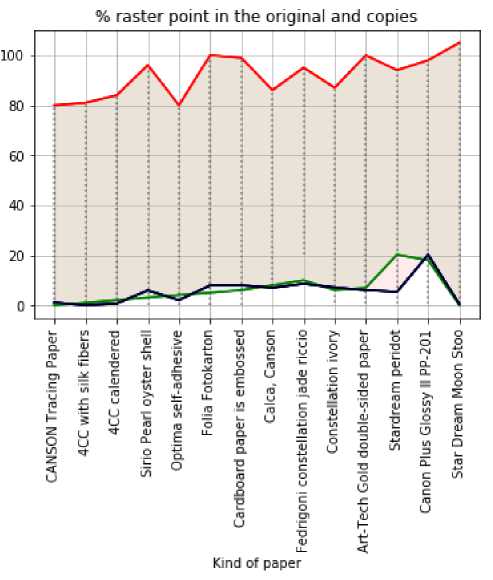
Fig.10. Comparison of experimental data percentage change of raster points measured with an X-Rite Spectro Eye spectrophotometer on the original document and fake printing
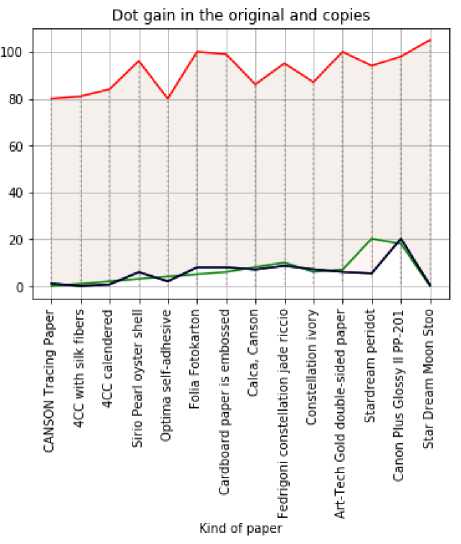
Fig.11. Comparison of experimental dot gain measured by spectrophotometer X-Rite Spectro Eye on the original document and copies
Table 6. Comparative characteristics of trapping in the original document and fake printing
|
№ |
Name |
Trapping, ∆Т |
Copy 1 |
Copy 2 |
Copy 3 |
|
1 |
Canson, tracing paper, 90g/m2, France |
6.2 |
0.2 |
0.77 |
0.88 |
|
2 |
4CC silk fibre paper |
7.4 |
0.6 |
0.71 |
0.06 |
|
3 |
4CC calendered paper |
9.5 |
2.9 |
0.74 |
0.03 |
|
4 |
Sirio Pearl oyster shell |
9.4 |
4.8 |
0.06 |
0.14 |
|
5 |
Optima Adhesive |
4.5 |
0.99 |
0.08 |
0.02 |
|
6 |
Folia Fotokarton |
7.8 |
2.82 |
0.02 |
0.7 |
|
7 |
Embossed aquarelle card paper |
8.9 |
2.98 |
0.02 |
0.3 |
|
8 |
Canson tracing paper, 200 g/m2 |
7.7 |
3.99 |
-0.16 |
-0.1 |
|
9 |
Fedrigoni constellation jade riccio |
8.5 |
2.87 |
0.32 |
0.4 |
|
10 |
Constellation ivory. |
4.7 |
1.2 |
0.25 |
1.1 |
|
11 |
Two-sided coated paper. Art-Tech - Gold East Paper |
5.5 |
2.96 |
0.03 |
2.3 |
|
12 |
Stardream peridot |
8.7 |
1.98 |
0.02 |
3.8 |
|
13 |
Canon Plus Glossy II PP-201 |
8.2 |
1.95 |
0.16 |
0.8 |
|
14 |
Star Dream Moon Stoo |
6.8 |
1.14 |
0.15 |
0.7 |
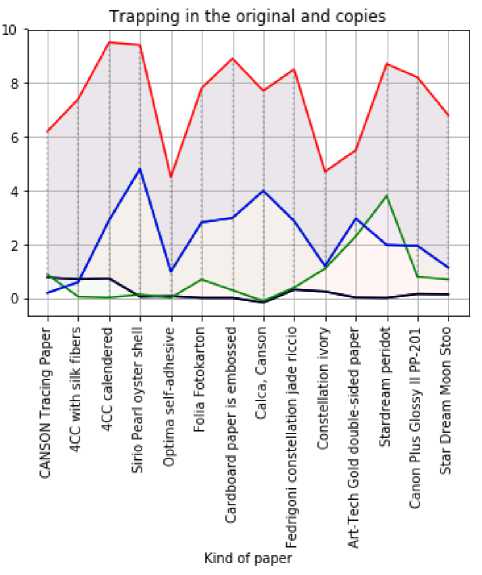
Fig.12. Comparison of experimental trapping data measured by X-Rite Spectro Eye spectrophotometer on the original document and fake printing
Comparative characteristics of ∆Lab in the original document and on the copy. The use of printing with similar tones or non-translucent dyes makes it impossible to restore the original raster grids of all applied colours on the scanned document, and the use of dyes not reproduced by CMYK devices eliminates the possibility of imitation or faking the elements using copiers. Thus, this method provides a relatively high degree of protection without requiring non-standard equipment and expensive materials, allowing it to be widely used in practice.
The following points are vital when determining the authenticity of the sample:
-
• the presence of a protective document,
-
• its clarity and the absence of moire;
-
• colour matching of dyes;
-
• compliance with the methods of rasterisation of each colour;
-
• The correct shape of the raster points is shown, and there are no signs of retouching.
Furthermore, text or security marks are applied on top of the working template's raster grid to eliminate the possibility of using the template in case of falsification. In addition, it should not contain images and may have a different way (and even angle) of rasterisation. In most cases, 40% raster filling of the control film can be considered optimal. It is desirable to choose the tone of the dye so that the differences would be as noticeable as possible.
Our experiment was performed to compare the original and copies in the Lab system. The experiments are represented in Table 6.
Table 7. Comparative characteristics of optical density in the original document and on fake printing
|
№ |
Name |
Optical density, AR |
Copy 1 |
Copy 2 |
Copy 3 |
|
1 |
Canson, tracing paper, 90g/m2, France |
88 |
6.2 |
3.2 |
2.7 |
|
2 |
4CC silk fibre paper |
90 |
7.4 |
2.6 |
3.1 |
|
3 |
4CC calendered paper |
90 |
6.5 |
2.9 |
3.4 |
|
4 |
Sirio Pearl oyster shell |
94 |
9.4 |
3.8 |
15.6 |
|
5 |
Optima Adhesive |
95 |
4.5 |
9.9 |
6.8 |
|
6 |
Folia Fotokarton |
97 |
6.7 |
10.2 |
12.1 |
|
7 |
Embossed aquarelle card paper |
98 |
7.8 |
2.8 |
12.2 |
|
8 |
Canson tracing paper, 200 g/m2 |
99 |
8.9 |
5.98 |
13.2 |
|
9 |
Fedrigoni constellation jade riccio |
100 |
2.7 |
9.9 |
11.6 |
|
10 |
Constellation ivory. |
100 |
8.5 |
3.7 |
13.2 |
|
11 |
Two-sided coated paper. Art-Tech - Gold East Paper |
100 |
4.7 |
1.2 |
12.5 |
|
12 |
Stardream peridot |
101 |
5.5 |
2.6 |
13.3 |
|
13 |
Canon Plus Glossy II PP-201 |
103 |
7.7 |
5.8 |
12.2 |
|
14 |
Star Dream Moon Stoo |
105 |
8.2 |
1.5 |
1.6 |
Optical density in the original and copies
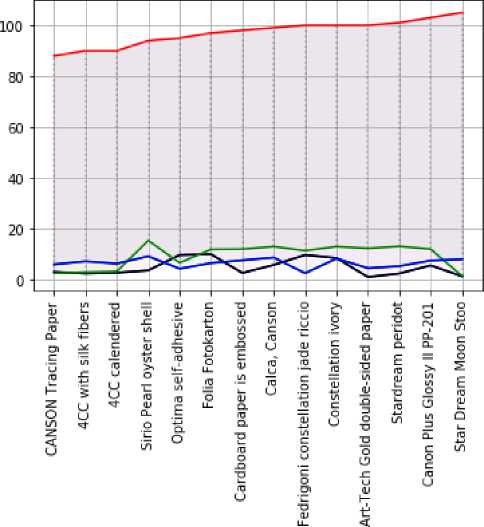
Kind of paper
Fig.13. Comparison of experimental data of optical density measured by spectrophotometer X-Rite Spectro Eye on the original document and fake printing
We experimented with changes in the pitch of black 25%, 50%, 75%, and 100% to study a comparative description of the original document and its copy. The experiments are described in Table 7.
All experimental data are performed within the permissible norms and standard deviations of printing reproduction. The various data presented in Tables 2-7 show the difference in the reproduction of the secret raster on different paper samples, which is obvious. In Figures 10-13, we see the difference between the original printed document and its copy.
A statistical analysis of the experimental data was performed. In particular, the mean values, standard deviations, and errors were calculated, and the significance of the differences between the original prints and the counterfeits was checked using the t-test.
Table 8. Comparative characteristics of ∆Lab in the original document and fake printing
|
№ |
Name |
Original |
Fake |
||||
|
∆L |
∆a |
∆b |
∆L |
∆a |
∆b |
||
|
1 |
Canson, tracing paper, 90g/m2, France |
88.81 |
42 |
24 |
99.89 |
12 |
12 |
|
2 |
4CC silk fibre paper |
102 |
53 |
36 |
100 |
3.5 |
14.5 |
|
3 |
4CC calendered paper |
101.7 |
80 |
41 |
86.29 |
5.1 |
4.8 |
|
4 |
Sirio Pearl oyster shell |
99.8 |
72 |
36 |
98.77 |
11.4 |
7.11 |
|
5 |
Optima Adhesive |
100 |
60 |
22 |
99.61 |
2.5 |
10.2 |
|
6 |
Folia Fotokarton |
100 |
65 |
32 |
87.6 |
21.1 |
8.02 |
|
7 |
Embossed aquarelle card paper |
108.6 |
42 |
37 |
95.13 |
12.1 |
5.31 |
|
8 |
Canson tracing paper, 200 g/m2 |
99.91 |
58 |
24 |
99.84 |
5.01 |
9.02 |
|
9 |
Fedrigoni constellation jade riccio |
104 |
75 |
34 |
78.92 |
14.2 |
23.9 |
|
10 |
Constellation ivory. |
97.64 |
59 |
37 |
73.8 |
13.4 |
22.63 |
|
11 |
Two-sided coated paper. Art-Tech - Gold East Paper |
100 |
63 |
21 |
99.87 |
7.02 |
6.02 |
|
12 |
Stardream peridot |
91.59 |
43 |
28 |
73.65 |
13.65 |
22.39 |
|
13 |
Canon Plus Glossy II PP-201 |
99.84 |
78 |
22 |
78.82 |
12.29 |
21.46 |
|
14 |
Star Dream Moon Stoo |
106 |
45 |
15 |
102.59 |
4.17 |
13.53 |
Table 9. Comparative characteristics of the changing tonality in the original document and fake printing
|
№. |
Name |
Original |
Copy |
||||||
|
25% |
50% |
75% |
100% |
25% |
50% |
75% |
100% |
||
|
1 |
Canson, tracing paper, 90g/m2, France |
4.6 |
8.04 |
12.4 |
16,9 |
0.89 |
0.02 |
0.01 |
0.075 |
|
2 |
4CC silk fibre paper |
4.2 |
9.03 |
10.5 |
18,3 |
0.21 |
0 |
0.01 |
0.25 |
|
3 |
4CC calendered paper |
7.9 |
8.8 |
10.4 |
15.7 |
0.29 |
0.51 |
0.08 |
0.02 |
|
4 |
Sirio Pearl oyster shell |
4.8 |
9.7 |
10.6 |
18.9 |
0.77 |
0.14 |
0.11 |
0.1 |
|
5 |
Optima Adhesive |
1.2 |
5.1 |
11.2 |
17.5 |
0.61 |
0 |
0 |
0.33 |
|
6 |
Folia Fotokarton |
1.01 |
4.02 |
14.2 |
18.25 |
0.6 |
0.01 |
0.02 |
0.15 |
|
7 |
Embossed aquarelle card paper |
3.61 |
7.2 |
14.7 |
19.75 |
0.13 |
0.01 |
0.31 |
0.22 |
|
8 |
Canson tracing paper, 200 g/m2 |
2.91 |
7.02 |
13.4 |
20.15 |
0.84 |
0.01 |
0.02 |
0.01 |
|
9 |
Fedrigoni constellation jade riccio |
4 |
6.01 |
12.4 |
22.85 |
0.92 |
0.2 |
0.9 |
0.17 |
|
10 |
Constellation ivory. |
4.64 |
5.95 |
13.7 |
25.73 |
0.8 |
0.4 |
0.63 |
0.33 |
|
11 |
Two-sided coated paper. Art-Tech - Gold East Paper |
2.57 |
8.01 |
12.1 |
24.11 |
0.87 |
0.02 |
0.02 |
0.01 |
|
12 |
Stardream peridot |
1.59 |
6.03 |
10.8 |
23.12 |
0.65 |
0.65 |
0.39 |
0.21 |
|
13 |
Canon Plus Glossy II PP-201 |
3.84 |
7.02 |
10.2 |
19.27 |
0.82 |
0.29 |
0.46 |
0.32 |
|
14 |
Star Dream Moon Stoo |
3.43 |
5.59 |
8.05 |
19.22 |
0.59 |
0.17 |
0.53 |
0.24 |
For each type of paper, the following was calculated (Table 10):
-
• Mean Copy Optical Density;
-
• The standard deviation of copies (Std Copy Optical Density) shows the variation of the results;
-
• The p-value of the t-test checks whether the differences between the original print and the counterfeits are
statistically significant.
Analysis of the results:
-
• The differences between the originals and the copies are statistically significant. All p-values (t-test)< 0.05 indicate substantial differences between the original print and the copies. The slightest deviation was found for Sirio Pearl oyster shell (p = 0.001626), the largest for Canson tracing paper (p = 0.000169).
-
• High variability in copies. The standard deviations in copies range from 1.55 to 4.82, indicating significant variations in the reproduction of optical density. It shows instability in the reproduction of the secret raster in counterfeits.
-
• Low average values of optical density in copies. The originals have a high optical density (88-105), while in copies, the values decrease to 3.77 - 9.67. It means that photocopiers cannot accurately reproduce secret raster elements.
The results confirm the effectiveness of the proposed document protection method - photocopiers significantly distort raster elements. Adding statistical analysis increases the reliability of the study, eliminating possible errors in interpretation. Further analysis can be performed for other parameters (for example, ∆lab or trapping) to assess the effectiveness of document protection more fully.
Table 10. Results of statistical analysis
|
Paper |
Optical density (original) |
Average optical density (copy) |
The standard deviation of copies |
p-value (t-test) |
|
Canson tracing paper, 90g/m² |
88 |
4.03 |
1.55 |
0.000169 |
|
4CC silk fibre paper |
90 |
4.37 |
2.15 |
0.000316 |
|
4CC calendered paper |
90 |
4.27 |
1.59 |
0.000172 |
|
Sirio Pearl oyster shell |
94 |
9.60 |
4.82 |
0.001626 |
|
Optima Adhesive |
95 |
7.07 |
2.21 |
0.000316 |
|
Folia Fotokarton |
97 |
9.67 |
2.24 |
0.000328 |
|
Embossed aquarelle card paper |
98 |
7.60 |
3.84 |
0.000901 |
|
Canson tracing paper, 200g/m² |
99 |
9.36 |
2.97 |
0.000547 |
|
Fedrigoni constellation jade riccio |
100 |
8.07 |
3.86 |
0.000879 |
|
Constellation ivory |
100 |
8.47 |
3.88 |
0.000896 |
|
Two-sided coated paper |
100 |
6.13 |
4.72 |
0.001264 |
|
Stardream peridot |
101 |
7.13 |
4.52 |
0.001157 |
|
Canon Plus Glossy II PP-201 |
103 |
8.57 |
2.68 |
0.000404 |
|
Star Dream Moon Stoo |
105 |
3.77 |
3.14 |
0.000479 |
To summarise the presented research, we present Fig. 14, where the left represents the minimum and maximum values of the densitometric measurement of the original document, and the right shows the densitometric measurements of copies. According to the numerical values on the left and right in the figure, an estimation of the level of reproduction % loss of the raster point, compression, trapping, optical density, ∆Lab, and tonality when playing the original document and its copy. The change of the values when using different papers indicates that the ink attaches differently to smooth and rough papers.
Densitometric measurements
|
Original |
Copy |
|
|
56-100 |
% raster dot |
1,02-12,5 |
|
80-100 |
Dot gain |
0,04-20,2 |
|
4,5-9,5 |
Trapping |
-0,16-4,8 |
|
88-100 |
optical density |
1,2-15,6 |
|
88-108 |
A Lab |
88-108 |
|
1,59-25,73 |
Changes tonality |
0-0,92 |
-
Fig.14. Generalised scheme of densitometric measurements on the original and copies
The advantages of the developed method include being cheap and simple. Also, it can be used to protect a wide range of goods and requires only specialised software to form rasterisation. By creating some rasterisation methods, a unique result can be achieved, which can not be reproduced without the software developed by the authors. The accuracy of the quality of the prints in the documents is essential as we strive to improve the efficiency of detecting the original document or its copy.
The data in the tables clearly illustrate that the devices involved in colour reproduction processes work with hardware data measured in various documents, which allows the user to detect counterfeits.
This section describes the method for creating and identifying secure printed documents by forming a secret raster structure based on Ateb functions. The proposed approach allows the detection of counterfeit printed copies by analysing optical characteristics, such as optical density, dot gain, trapping, and changes in the ΔLab colour space.
-
A. Formation of a Secret Raster Function
The secret raster structure is based on the use of Ateb functions, which are a generalisation of trigonometric functions and allow the creation of complex geometric raster shapes. The main characteristics of the formed raster:
-
• Variable geometry of raster points: points can have the shape of a circle, rhombus, superellipse, or fractal structure.
-
• The dependence of raster parameters on Ateb functions, in particular, the angle of inclination, the density of points, and their sizes, are determined by the parameters m, n, which are chosen experimentally.
-
• Protection against copying, in particular, when attempting to copy or digitally reproduce the original, the geometry of the secret elements is distorted due to the mechanical and optical features of the copying process.
The process of forming a secret raster includes the following stages:
-
• Generation of Ateb-functions with specified parameters.
-
• Construction of a raster structure by discretisation of functions.
-
• Determination of the optimal scale and angular orientation of the raster.
-
• Application of the combined rasterisation algorithm (AM/FM) to ensure protection.
-
B. The Process of Printing and Obtaining Control Samples
For the experimental study, original protected documents were created by offset printing. Forgeries were obtained by copying on digital printing devices (Canon, Xerox, Hewlett-Packard). Printing was performed on 14 paper samples with different textural and physicochemical properties.
-
• Professional printing equipment was used for offset printing (originals). The raster structure was applied with a resolution of 150-200 LPI. Control printing was performed on different types of paper to analyse the interaction of the ink with the surface of the material.
-
• When copying (forgery), standard digital copying devices with a resolution of 600-1200 dpi were used, and the changes in secret raster structures after copying were analysed.
-
C. Methods of Analysis of Counterfeit Identification
The following methods were used to assess the safety of the secret raster:
Optical analysis was based on the measurement of optical characteristics of the print using an X-Rite Spectro Eye spectrophotometer. The following parameters were evaluated:
-
• Optical density (ΔR) - the degree of light absorption by printed elements.
-
• Dot Gain - changes in the size of raster dots due to mechanical and optical effects.
-
• Trapping - the ability of printing inks to adhere during multilayer printing.
-
• Color analysis (ΔLab) – comparison of colour shades between the original and the copy.
For the analysis of geometric distortions, the Canny Edge Detection algorithm was used to detect differences in the contours of raster dots. A comparative assessment of the spectral composition of the images was performed.
-
D. Statistical Analysis
To increase the reliability of the experimental results, statistical data analysis was performed:
• Calculate mean values and standard deviations of printing parameters for each paper sample.
• t-test to check the significance of differences between originals and copies.
• Graphical presentation of data in the form of boxplots and histograms.
5. Conclusions
The results showed that p-value < 0.05 for most parameters, which confirms significant differences between originals and copies and confirms the effectiveness of the proposed document protection method.
The secret raster method, developed based on Ateb functions, showed high efficiency in detecting counterfeit printed documents. The experimental differences in the identified optical and geometric parameters allow for the automated detection of counterfeits. Further research will focus on the application of 3D printing to increase the level of security of printed documents.
A method for creating documents with a secret raster has been developed, which is based on the use of a little-known mathematical apparatus of Ateb-functions, which makes it possible to protect both electronic and printed documents. Electronic documents are protected by using software developed by the authors, which converts a raster image into a vector image with the formation of a unique form of a raster cell of Ateb-functions. The printed image is protected from forgery by printing with printing equipment with various optical secrets that cannot be reproduced on copying equipment.
The developed method detects forgeries in printed documents at 90%-95%.
Criteria for evaluating parameters that affect the accuracy of determining the original or fake are proposed. The proposed method provides a high degree of uniqueness of the result. It allows you to choose the presence of a secret pattern and the absence of signs of forgery (the examination will take a minimum of time). The X Rite Spectroeye spectrophotometer detects the original or fake. Methods for forming a document using fine graphics, a secret raster, and fractals give the best results in detecting the original or copy of a document. The proposed method of detecting the original or forgery is especially noticeable on large samples and copies of documents. If the paper is of poor quality, then printing and reproducing the document becomes difficult. This method does not work for low-quality paper. If protection is needed, then we print on paper that reproduces this print, and not copies.
Limitations of the proposed method
-
• Sensitivity to paper quality – low-quality or porous paper may cause partial ink bleeding, which may affect the preservation of secret raster elements.
-
• Influence of printing conditions – variations in pressure, speed and ink viscosity can change the accuracy of secret raster reproduction.
-
• Limited efficiency on laser printers – laser printing can partially imitate some raster structures, although the overall differences remain significant.
-
• Complexity of automated analysis – in real-world conditions, recognition may require complex machine learning algorithms to accurately identify counterfeits.
Ways to improve the proposed method
-
• Optimisation of the raster structure – development of new mathematical models to increase the stability of the secret raster to changes in printing.
-
• Use of alternative materials – experiments with new types of paper and ink to improve the stability of reproduction.
-
• Machine learning integration – creating deep learning algorithms for automated counterfeit detection.
-
• 3D printing research – using 3D rasterisation to increase the level of security of printed documents.
Thus, based on the analysis of the results obtained, practical recommendations for ensuring the authenticity of printed documents, as well as on the basis of the obtained dependencies of the original and the copy, taken by a spectrophotometric device, the effectiveness of the method of identifying a document rasterised with a secret raster has been proven.
Acknowledgement
The research was carried out with the grant support of the National Research Fund of Ukraine, "Information system development for automatic detection of misinformation sources and inauthentic behaviour of chat users", project registration number 33/0012 from 3/03/2025 (2023.04/0012). Also, we would like to thank the reviewers for their precise and concise recommendations that improved the presentation of the results obtained.
