
AI-Ready Regional Remote Sensing Database and Pre-Modelling Decision Support for Rapid Oil Spill Impact Scenario Generation in the Azerbaijan Sector of the Caspian Sea
Journal: Bulletin of Science and Practice @bulletennauki
Section: Технические науки
Article in issue: 7 т.12, 2026.
Free access
A major problem in responding to a marine oil spill is obtaining operational data quickly and reliably. The very close location of offshore platforms, subsea pipelines, vessel traffic, ports, and sensitive coastal zones in the Azerbaijan part of the Caspian Sea means even a short delay in the initial assessment can affect response priorities. Current oil spill models, such as GNOME and OSCAR, are typically used after scenario-specific inputs, such as spill location, wind, current, shoreline, and oil characteristics have been produced. These models are useful, however, for broad trajectory, fate, weathering, and response studies. To mitigate this initial delay, this research proposes a pre-modeling decision-support framework and an AI-ready regional remote sensing database. The database includes Sentinel-1 SAR, Sentinel-2 optical imagery, thermal observations, AIS vessel movement, offshore infrastructure layers, hydrological and meteorological fields, historical spill data, and environmental sensitivity data. When an oil-like anomaly is detected, the framework produces initial impact scenarios of high, medium, and low risk, checks for nearby vessels and infrastructure, compares with regional baseline conditions, and screens for potential false positives. It is not proposed as a replacement for OSCAR or GNOME. Rather, it is designed as an upstream operational layer that offers structured inputs and a first-response intelligence package for subsequent comprehensive modeling. It integrates artificial intelligence, real-time verification of maritime traffic, knowledge of the regional baseline, and rapid impact scenario generation to be ready for any oil spill in the Caspian Sea.
Short address: https://sciup.org/14138579
IDS: 14138579 | UDC: 004.89: 528.88 | DOI: 10.33619/2414-2948/128/04
Региональная база данных дистанционного зондирования, готовая к применению ИИ, и предварительная система поддержки решений для быстрого формирования сценариев воздействия нефтяных разливов в Азербайджанском секторе Каспийского моря
При реагировании на разливы нефти в морской и прибрежной среде обеспечение оперативного доступа к достоверным данным имеет решающее значение. Даже небольшая задержка в первичной оценке может повлиять на приоритеты реагирования, поскольку морские платформы, подводные трубопроводы, судоходные маршруты, порты и экологически чувствительные береговые зоны в азербайджанском секторе Каспийского моря расположены в относительно компактном пространстве. Существующие модели разливов нефти, такие как GNOME и OSCAR, необходимы для тщательного анализа траектории, распространения, выветривания и мер реагирования. Однако их использование обычно начинается после подготовки входных данных для конкретного сценария, таких как координаты разлива, ветер, течения, береговая линия и свойства нефти. В статье предлагается система поддержки решений на этапе предварительного моделирования и региональная база данных дистанционного зондирования, готовая к применению искусственного интеллекта. Цель состоит в том, чтобы сократить время между обнаружением аномалии и первичной оперативной оценкой. База данных включает оптические данные Sentinel-2 и Sentinel-1 SAR, тепловые наблюдения, данные AIS о движении судов, слои морской инфраструктуры, гидродинамические поля и сведения о прошлых разливах, а также экологически чувствительные объекты. При обнаружении нефтеподобной аномалии система сопоставляет ее с региональными базовыми условиями, проверяет близость судов и инфраструктуры, чтобы снизить вероятность ложных интерпретаций и создает предварительные сценарии воздействия с высоким, средним и низким уровнем риска. Метод используется не как замена GNOME или OSCAR, а как предварительный оперативный слой, создающий основной пакет данных и структурированные входные данные для последующего детального моделирования.
Text of the scientific article AI-Ready Regional Remote Sensing Database and Pre-Modelling Decision Support for Rapid Oil Spill Impact Scenario Generation in the Azerbaijan Sector of the Caspian Sea
Бюллетень науки и практики / Bulletin of Science and Practice
УДК 004.89: 528.88
Oil spills are still a severe environmental threat to coastal and marine areas. The risk is greater when sensitive coastal receptors are near offshore production, subsea pipelines, terminals, ports, and busy navigation routes. Such a confluence of circumstances exists in the Azerbaijani sector of the Caspian Sea. For a country with a long tradition of offshore and coastal oil and gas production, early discovery and quick initial assessment are especially important, as a slow reaction may increase ecological damage and make operational decision-making more difficult. One of the most effective techniques for monitoring oil pollution over large water bodies is satellite remote sensing. Synthetic Aperture Radar (SAR) is particularly useful because it can image at night and in cloud cover. Oil slicks tend to appear as dark patches in SAR images because oil layers tend to reduce radar backscatter and suppress short surface waves [14].
But a dark SAR object is not always an oil spill. Similar signs can be created by low-wind zones, rain cells, natural films, internal waves, algae, or ship wakes. Therefore, SAR detection needs to be supplemented by contextual data before an operational decision can be made. This paper proposes the concept of a regional database that is created in advance of an incident. Instead of searching for all input layers only once a spill is detected, the database is continually updated with historical and current data for the Azerbaijani area of the Caspian Sea. If an oil-like anomaly is detected, these pre-generated layers are immediately available to estimate local conditions, identify nearby infrastructure and vessels, estimate initial directions of movement, and support early response until more detailed GNOME or OSCAR modeling is initiated. The first few hours after an oil spill are normally the most crucial in planning the response. However, in practice, some tasks could delay the start of the evaluation: identification and processing of satellite imagery, collection of wind and current fields, mapping the surrounding infrastructure, and setup of the modeling case. Web GNOME is a trajectory and fate model that simulates oil transport and weathering due to winds and currents [1]; however, the user still sets the spill scenario and may need to supply data on wind, current, and shoreline. OSCAR provides a more complete oil fate, effect, weathering, and reaction modeling environment for hindcasting, forecasting, and contingency analysis [2]. These tools are still useful, but they don’t eliminate the need for a quick preliminary image right after detection. The study topic is thus both scientific and practical: how can an initial operational assessment be created before a complete modeling scenario is prepared? The system should quickly identify the location of the anomaly, whether it is likely to be oil or a lookalike, which vessels and platforms are nearby, which direction the slick might initially move, which industrial or environmental objects could be affected, and whether the initial risk level should be high, medium, or low.
Materials and methods
The essay provides a conceptual and methodological framework based on contextual verification and data readiness. It combines layers of environmental sensitivity, offshore infrastructure mapping, satellite remote sensing, real-time maritime traffic data and AI-based data fusion. Table 1 summarizes the main components of the database.
Table 1
MAIN DATA LAYERS OF THE PROPOSED REGIONAL DATABASE

Continuously updated regional baseline database (Azerbaijan sector of the Caspian Sea)
/~\ Meteo-hydrodynamic data
------ wind-waves-currents
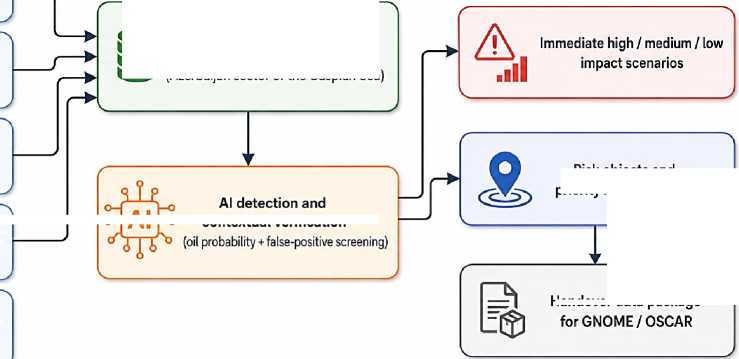
Figure 1. Conceptual architecture of the proposed rapid pre-modelling oil spill decision-support system


AIS vessel tracks position-speed-course

Platforms, pipelines, ports fixed risk objects
|
Data layer |
Examples |
Operational purpose |
|
Remote sensing data |
Sentinel-1 SAR, Sentinel-2 optical, thermal infrared observations |
Detection of oil-like anomalies, shoreline impact and surface condition changes |
|
AIS vessel data |
Vessel identity, position, speed, course and time of passage |
Verification of ship-related sources, wake effects and possible illegal discharge |
|
Oil and gas infrastructure |
Platforms, subsea pipelines, terminals, ports and pipeline corridors |
Identification of fixed risk objects and possible anthropogenic sources |
|
Meteorological data |
Wind speed, wind direction, air temperature and visibility |
Initial transport estimation and false-positive screening |
|
Hydrodynamic and hydrophysical data |
Surface currents, wave height, wave direction and sea surface temperature |
Preliminary movement scenario generation |
|
Historical baseline |
Previous SAR/optical scenes, known look-alike areas and historical pollution records |
Comparison of new anomalies with normal regional conditions |
|
Environmental sensitivity |
Protected areas, fisheries, bird habitats, beaches and settlements |
Impact scenario classification and response prioritisation |
Sentinel-1 SAR (dark ocean areas)
Risk objects and priority response zones о-A! - contextual verification
Handover data package
SAR-based detection and radiometric basis . The first detection step uses SAR backscatter analysis. After calibration, the radar backscatter coefficient can be expressed in decibels as follows [4, 5]:
о^в = 101og]o(cT0) (1)
Here, sigma nought is the radar backscatter coefficient. In practical terms, oil films tend to smooth the sea surface by reducing small-scale roughness. As a result, oil-like areas usually have lower backscatter values than the surrounding water. An initial dark-spot mask can be produced with an adaptive threshold:
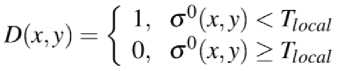
In this expression, D(x,y) is the binary candidate slick mask, while T_local is a local threshold calculated from neighbouring sea-surface statistics. The output of this step is only a candidate layer. It highlights dark objects that require further checking, but it does not by itself prove that the object is an oil spill.
AI-based classification and contextual verification. Next, an AI model trained on the regional data is used. The model does not depend only on pixel brightness. It also considers the shape of the dark object, its texture, edge behavior, local wind conditions, AIS vessel information, proximity to platforms or pipelines and the historical behavior of the same area. Oil probability is expressed conceptually as:
Foil f^SARt ^shape i Ftexture- ^wind 7 Fais ^ Fpia^ortm ^history)
In this formulation, F_SAR refers to backscatter features; F_shape to the geometry of the candidate slick; F_texture to textural properties; F_wind to wind conditions; F_AIS to vessel movement; F_platform to proximity to oil and gas infrastructure; and F_history to historical baseline patterns. Deep learning models such as FC-DenseNet, U-Net and graph-based segmentation approaches have already been used in the literature for SAR oil slick or dark-spot detection [7-10].
The function f should be read as a conceptual AI classification function rather than a fixed analytical equation. It defines the groups of input variables that would be used by a regional AI model trained on remote sensing and contextual datasets.


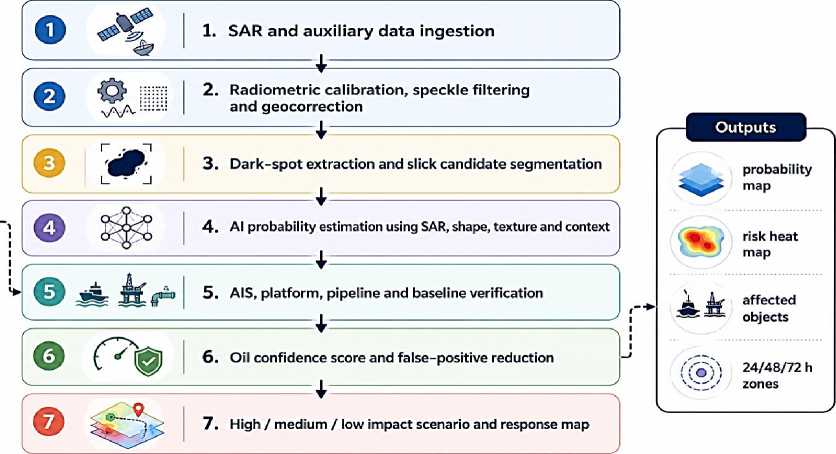
Figure 2. Proposed algorithmic sequence for rapid pre-modelling decision support
Integration of real-time AIS, platforms and pipeline data. AIS data are used because vessel movement is one of the most important contextual checks in the interpretation of offshore oil spills. AIS is frequently used for marine situational awareness and offers vessel identity, position, course, speed and navigational information [3]. Thus, the SAR dark spot is evaluated in the current system not only as an image object, but also in relation to fixed oil and gas infrastructure and vessel tracks. This helps to differentiate between operational discharges, ship wakes and other vessel related signals and possible oil contamination. The distance between the detected slick candidate and a vessel position is calculated as:

where S_oil represents the centroid or polygon of the detected candidate slick, and V_i is the AIS-derived position of vessel i. The vessel association score can then be written as:

where Delta t_pass is the time difference between the vessel passage and the SAR acquisition time. This function checks whether the anomaly may be associated with a moving vessel, ship wake, operational discharge, collision or another maritime activity. A vessel passing close to the slick shortly before image acquisition would increase the vessel-association score and mark the case for further verification.
The same logic is applied to fixed oil and gas infrastructure. Offshore platforms, subsea pipelines, terminals, port areas and industrial facilities are introduced as static spatial layers. The distance between the detected anomaly and infrastructure object j is calculated as:
dinfra = distance^,If) (6)
where I_j may be a platform, pipeline, terminal, port or other industrial object. Since a direct distance value can distort the risk calculation when different units or scales are used, infrastructure-related risk is expressed through a normalised distance function:
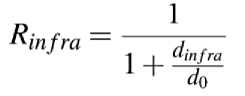
where d_0 is a reference distance selected for the operational scale of the study area, such as 1 km, 5 km or 10 km. With this form, a slick candidate located close to a platform or pipeline receives a higher infrastructure-related risk score, while a candidate located farther away receives a lower score.
For practical application, this simple distance function can be refined. It may be replaced by weighted proximity zones, pipeline risk corridors, site-specific probability surfaces or infrastructure vulnerability classes. This would allow the model to distinguish, for example, between a small port facility, a major offshore production platform and a high-risk pipeline corridor.
When a SAR dark spot is found, this step operates by asking two straightforward questions: is the anomaly near platforms, pipelines, terminals, or ports, and did a vessel recently pass close to this location? The case is given more contextual attention if the response is in the affirmative. Although it helps identify potential sources, prioritize inspection, and lower false alarms, this does not prove an oil spill.

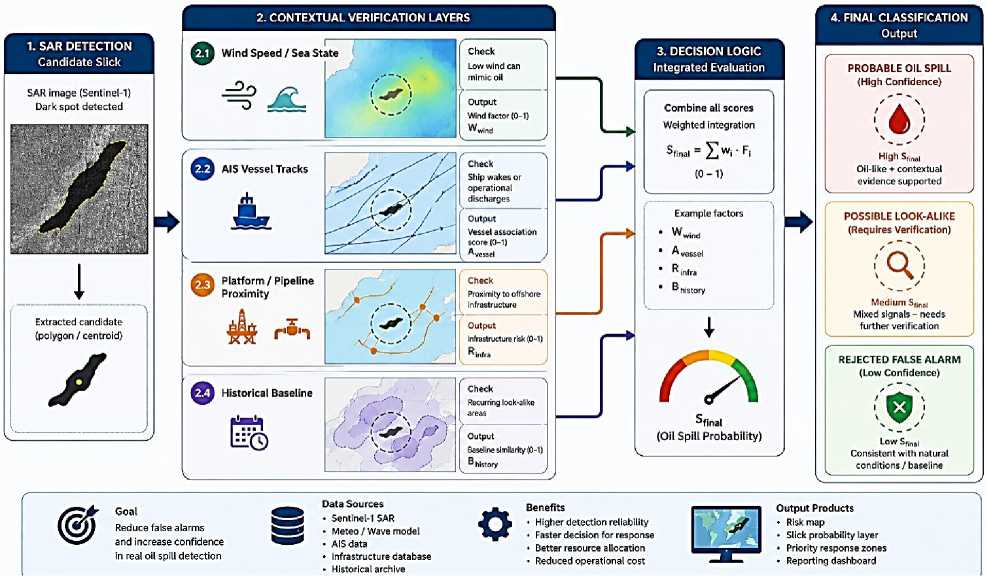
Figure 3. Contextual screening reduces false interpretation of SAR dark spots as oil spills
Contextual verification is used to reduce the misinterpretation of SAR dark-spot candidates. In SAR data, oil slicks are often black because they dampen short gravity-capillary waves. However, similar fingerprints can also be created by low-wind cells, natural surface films, algae, ship wakes, rain cells and other hydrometeorological events. The framework, therefore, does not classify all SAR dark objects as oil. Each applicant is evaluated based on historical baseline behaviour, proximity to platform and pipeline, wind and sea conditions, and AIS vessel movement.
The anomaly is classified as a probable oil spill with high confidence, assuming that the context and picture data match. If the data is conflicting, then a drone, outdoor observation or further photography should be used to confirm the case as it could be a lookalike. If the anomaly corresponds to natural recurring patterns or poor detection conditions, it is classified as a low-confidence false alarm. This multi-layer check makes the decision making less risky when relying only on SAR brightness.
False-positive reduction and confidence scoring. False positives remain one of the main disadvantages of SAR based oil spill detection. Dark areas that resemble oil can be caused by low winds, natural films, internal waves, rain cells, algae, plankton and ship wakes. The framework provides a false positive probability that depends on the operational and environmental context:
Pfalse = h(W,C,H^IS,B) (8)
where W denotes wind and sea-state conditions, C denotes current and wave context, H denotes historical look-alike frequency, AIS denotes vessel activity and B denotes the baseline background behaviour of the local area. The final oil confidence value is then calculated as:
^-oil ~ Poll ^ (1 Pfalse} (9)
A high C_oil value indicates a probable oil spill. A moderate value suggests that the case should remain under verification. A low value indicates a likely look-alike or false alarm.
Pre-modelling movement and scenario generation. Before detailed physical modelling is carried out, the system generates a first-order estimate of slick movement. This estimate is not intended to replace GNOME or OSCAR. It is a quick approximation for the first response period, when decision-makers need an initial direction of movement before detailed model outputs are available. A simple vector-based displacement can be expressed as [1, 5]:
^+д/ — Xt + (Uc + aUw)^i (10)
where X_t is the current slick position, X_{t+Delta t} is the estimated position after the time interval Delta t, U_c is the surface current vector, U_w is the wind vector and alpha is the windage coefficient. The result provides an initial indication of possible movement direction. The system then combines this movement estimate with oil confidence, environmental sensitivity, shoreline proximity, infrastructure exposure and vessel association.
Riot al ~ ^ I Coll + V^R-infra “Ь ^З^ет 4“ ^^Rshore “b ^^Rvessel (11)
where R_total is the total risk score; R_env is the environmental sensitivity risk; R_shore is the shoreline impact risk; R_vessel is the vessel association risk; and w1, w2, w3, w4 and w5 are weighting coefficients assigned by expert judgement or calibrated from historical cases.
( High, Rtotai>0:i0
Risk = < Medium. 0.40 < Rlotai < 0 70 [ Low, Riotal < 0.40
The threshold values in Equation (12) are illustrative. In a real operational system, they should be adjusted using historical spill records, expert review, field verification and comparison with detailed GNOME or OSCAR outputs. Table 2 summarises the scenario logic.
|
Table 2 PRELIMINARY SCENARIO CLASSIFICATION LOGIC |
|
|
Scenario |
Typical conditions Operational meaning |
|
High risk |
High oil confidence, strong wind/current, short Immediate response mobilisation and distance to sensitive objects or infrastructure priority modelling required |
|
Medium risk |
Moderate oil confidence and/or moderate Targeted monitoring, drone transport conditions, possible interaction with verification and model preparation selected objects required |
|
Low risk |
Low transport potential or low confidence after Continue surveillance and verification false-positive screening before full emergency mobilisation |
Results and discussion
This framework gives rise to a two-stage response procedure. The regional database initially provides quick pre-modeling knowledge by comparing the anomaly with predefined baseline data, current AIS data, adjacent infrastructure and false-positive situations before creating initial risk scenarios. Second, the verified data can be imported into GNOME, OSCAR, or another oil spill model for more detailed trajectory, fate, weathering and reaction analysis.
This is an important distinction. The framework is not put forward as yet another full trajectory model. It helps to reduce the operational gap between accurate modeling and detection. It does this through AI-based contextual validation, the necessary regional layers in place, and a structured first-response image when a candidate slick is detected.
This strategy is particularly important for the Caspian Sea region of Azerbaijan. A relatively concentrated regional system includes ports, shipping lanes, platforms, subsea pipelines and sensitive coastal receptors. Regular updating of the database will lead to better preparedness, allow early warning and reduce the need to collect important input data only after the event has already occurred.
This approach may also involve thermal remote sensing. Thermal infrared observations can be useful for assessing oil pollution, as oil coatings can alter the thermal and emissive properties of the water surface, as noted in [11]. Thus, in the present paradigm, thermal layers are treated as extra information to aid SAR and optical interpretation, where appropriate thermal data from satellites or drones are available.
LEGEND
Detected spill
Q| Platform (infrastructure)
IMMEDIATE
Pipeline corridor i Sensitive shoreline
AIS vessel route
Proximity risk buffer (near platforms)
SOURCE VERIFICATION RISK
(closest platforms -high priority for inspection and source assessment)
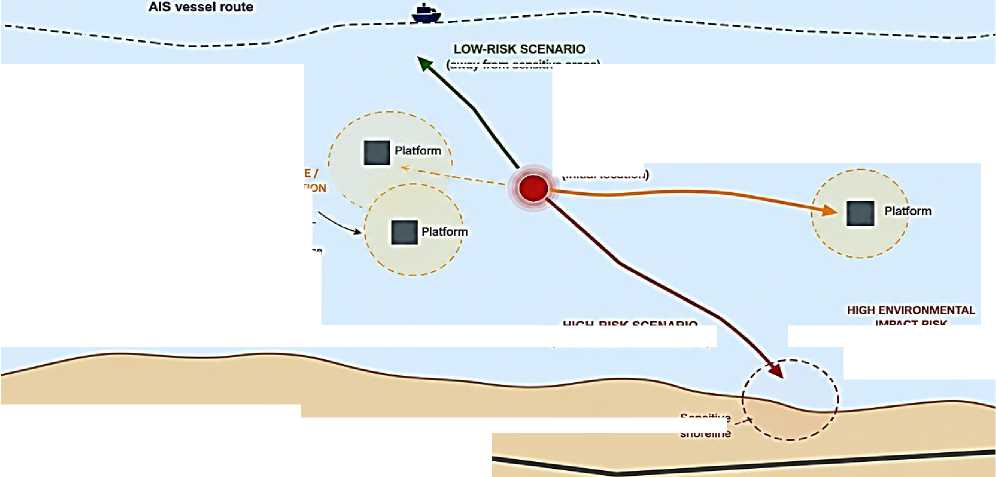
(away from sensitive areas)
INFRASTRUCTURE EXPOSURE SCENARIO (potential impact on offshore facility)
IMPACT RISK (potential shoreline contamination and ecosystem damage)
Pipeline corridor
KEY MESSAGE
SCENARIO SUMMARY
Detected spill (initial location)
HIGH-RISK SCENARIO (towards sensitive shoreline)
Sensitive shoreline

Nearby platforms = source / proximity risk (important for verification and operational safety)
Shoreline path = environmental impact risk (highest consequence if oil reaches the coast)
— ■► High risk: movement towards sensitive shoreline
----► Medium risk: potential impact on offshore infrastructure
► Low risk: movement away from sensitive and infrastructure areas
Figure 4. Example of high-, medium- and low-risk impact pathways generated immediately after detection
Limitations and validation . To make this framework work the incoming data must be consistent and of good quality. Sea state affects SAR interpretation, AIS signals can be too weak or deliberately switched off, wind and current fields may be too coarse for local-scale movement, and previous labelling might not be sufficient for reliable AI training. For these reasons, the framework should be used as a decision support tool rather than as a fully independent final decision maker.
Validation should be based on a weight of evidence. Results should be compared with AIS and platform activity logs, drone or field verification, expert interpretation of SAR images, previous oil spill data, and GNOME or OSCAR outputs where possible. Metrics such as accuracy, recall, F1-score, false alarm rate, and intersection-over-union can be used to evaluate the model’s performance in segmentation tasks.
Conclusion
The research proposes an AI-ready regional remote sensing database and pre-modeling decision-support system for rapid generation of oil spill damage scenarios in the Azerbaijan part of the Caspian Sea. The system employs Sentinel-1 SAR, Sentinel-2, thermal observations, AIS vessel tracks, offshore platforms, pipelines, hydrological and meteorological data, historical baseline data and environmental sensitivity layers.
The main contribution is a fast intelligence layer that works before the deep GNOME or OSCAR modeling. Once an oil-like anomaly is identified, the framework provides high, medium and low risk impact scenarios, exposes objects, reduces false positives, and verifies the case with regional context. The strategy can help promote environmental protection in the Caspian region and improve early reaction planning by reducing the time between detection and first operational assessment.
