Algorithm for Detecting Weak Pulses Against a Powerful Pulse for RF Spectrum Management
Автор: Podstrigaev A.S., Kalinin D.A., Tran Huu Nghi, Nguyen Trong Nhan
Журнал: Журнал Сибирского федерального университета. Серия: Техника и технологии @technologies-sfu
Рубрика: Математическое моделирование. Численный эксперимент
Статья в выпуске: 5 т.18, 2025 года.
Бесплатный доступ
This paper proposes an algorithm for detecting weak pulses against a powerful pulse. Justification of the parameters of the developed algorithm was performed using computer modelling in the MATLAB. The thresholds for detecting weak pulses against a powerful unmodulated radio pulse were obtained depending on the signal-to-noise ratio (SNR) for different types of weighting windows, the number of fast Fourier transform (FFT) points and the probability of false detection for a weak pulse. It is shown that at the SNR of a relatively powerful unmodulated radio pulse of at least 30 dB, the required threshold value of weak pulse detection for the Hamming window is 7.5…8 dB lower than for the Hann window, and 27.5…29 dB lower than for a rectangular window. Increasing the number of FFT points from 256 to 1024 allows us to reduce the threshold value of weak pulse detection by 3…6 dB. Reducing the probability of false detection for a weak pulse from 10–3 to 10–7 requires increasing the threshold value for weak pulse detection by 1.2…5.2 dB.
Pulse overlap, weak pulse detection, fast Fourier transform, window weighting
Короткий адрес: https://sciup.org/146283155
IDR: 146283155 | УДК: 621.396.62
Текст научной статьи Algorithm for Detecting Weak Pulses Against a Powerful Pulse for RF Spectrum Management
Signal detection is the first and essential step in signal processing in RF spectrum management [1–4]. In radio systems of various purposes, the following types of signals have become widespread: unmodulated radio pulse (URP), signals with linear frequency modulation (LFM), binary (BPSK) and quadrature phase manipulation (QPSK) [5–9]. It is necessary to detect these signals in RF spectrum management.
One of the most common approaches to signal detection is spectral analysis based on the fast Fourier transform (FFT) [10–12]. In this case, the input signal is divided in time into analysis windows. In each window, the detection of a signal (or a fragment of a signal) is made and its time-frequency parameters are determined. Advantages of FFT include fast performance and relative simplicity of technical implementation, which ensures close to real-time signal processing [13–15].
However, when a large number of emitting radio electronic devices operate simultaneously, the probability of pulse time overlap at the input of the wideband receiver increases [16–18]. As a result, the side lobes of a powerful pulse mask the spectrum of a weak pulse and the process of detecting weak pulses becomes more difficult [19]. Consequently, missed detections and abnormal errors in determining the timefrequency parameters of pulses reduce the probability of recognizing signals and emitting devices [20–22].
The purpose of the work is to develop an algorithm for detecting weak pulses against a powerful pulse and to justify its parameters.
-
I. Algorithm development
The structural diagram of the algorithm includes the following functional blocks (Fig. 1): window weighting block (WWB); FFT block; powerful pulse detector (PPD) and weak pulses detector (WPD).
S^t)
WPD --►
Fig. 1. Block diagram of the algorithm for detecting weak pulses against a powerful pulse
The developed algorithm works as follows
The algorithm is fed sequentially with analysis windows, each window contains a signal realization x ( t ) This signal is a mixture of the sum of several overlapped pulses in time s i ( t ) and additive white Gaussian noise (AWGN) η ( t ):
^) = YSi^ + r/^
where L is the number of pulses that overlap in time t
Then, to suppress side lobes in the spectrum, the received signal is weighted by a window function w ( t ) in WWB:
xw(t)^x(t)w(t).
The amplitude spectrum of the weighted signal X (2π f ) is calculated using the Fourier transform:
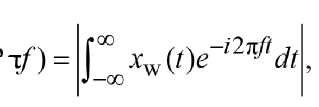
where f is the frequency.
PPD detects powerful signal against the AWGN at a given threshold G thr (Fig. 2). Since the amplitude of the FFT outputs is approximated by the Rayleigh distribution, the threshold value G thr can be set as a function of the probability of false alarm P FA [23]:
^ь^Жм^аЖ
where m is the mean of measured noise distribution in the frequency domain.
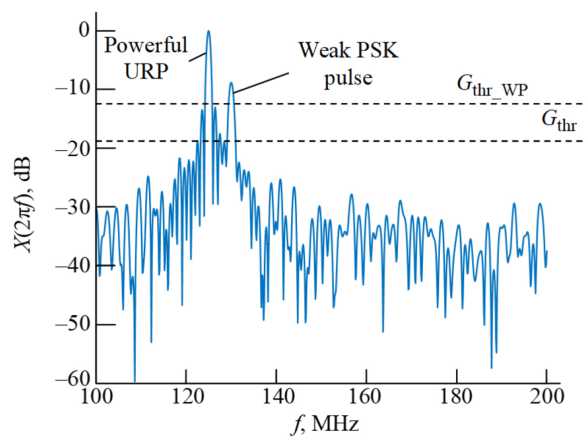
Fig. 2. Amplitude spectrum of two pulses that overlap in time on a normalized logarithmic scale
If the powerful signal is detected, weak pulses are then detected in the WPD based on a comparison of local maxima exceeding the threshold G thr with the second threshold G thr_WP . Fig. 2 shows the value G thr_WP in the amplitude spectrum of two pulses that overlap in time in a normalized logarithmic scale. The justification of this threshold is given in the next section.
Next, a decision is made on the number of overlapped in the analysis window pulses whose amplitudes exceeded the threshold values G thr and G thr_WP .
-
II. Justification of the weak pulse detection threshold
Let us consider the case of receiving two pulses that overlap in time – a powerful unmodulated radio pulse and a weak pulse of an arbitrary type (URP, LFM, BPSK, or QPSK)
For a powerful URP, the shape of the side lobes of the amplitude spectrum and their position on the frequency axis are known and depend on the type of weighting window [24]. However, the maximum amplitudes and central frequencies of the side lobes may deviate from the expected values. This may be related to both spectral leakage and the presence of weak pulses. Therefore, in order to detect a weak pulse in the analysis window, it is necessary to justify the detection threshold G thr_WP taking into account the spectral leakage of a powerful URP. It is also necessary to take into account the dependence of the spectral leakage on the number of FFT points N FFT and the type of weighting window for a given probability of false detection P FD
The threshold value G thr_WP can be set based on the probability density function (PDF) of the maximum value of the most powerful side lobe of the URP.
For this purpose, one must obtain a histogram of the maximum value of the most powerful side lobe of the URP (normalized to the spectral maximum) for a given number of iterations N it . Then, the PDF is determined by normalizing the bin values of the histogram relative to the total bin width.

where v i is the normalized i -th bin value, c i is the i -th bin value, w i is the i -th bin width.
Examples of the corresponding PDF for N it = 106 iterations, Hamming window weighting and two different SNR values q PP = 20; 30 dB are shown on Fig. 3.
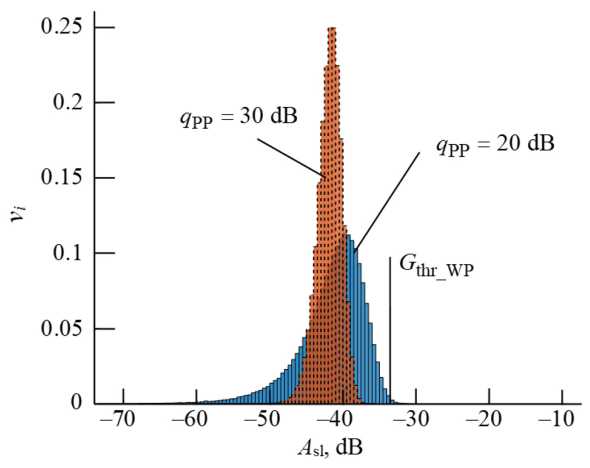
Fig. 3. PDF of the maximum value of the most powerful side lobe of the URP for q PP = 20; 30 dB
The threshold value G thr_WP can be obtained based on the given probability of false detection of a weak signal P FD, which, taking into account the normalization performed, will correspond to the area of the PDF to the right of the selected threshold.
Fig. 3 clearly shows the dependence of the PDF shape on the SNR. Accordingly, the threshold value G thr_WP will also depend on the q PP It is worth noting that at a low SNR, the maximum of the spectrum may not correspond to the carrier frequency of the signal, which will lead to incorrect normalization. For q PP <–10 dB, the probability of correct detection of a powerful URP (against the AWGN in the absence of a weak pulse) is already less than 0.8 at N FFT = 512 and P FD = 10–7 [23]. Since the detection of weak pulses is carried out only when a powerful one is detected, further cases are considered when q PP <–10 dB.
To justify the threshold value G thr_WP using modelling, one must obtain the PDF for different values q PP, and then for each q PP, based on the probability P FD, select the detection threshold G thr_WP
Since weak pulses are detected against the side lobes of a strong pulse, it is beneficial to use window functions with the maximum possible suppression of side lobes. This allows us to reduce the minimum amplitude of a weak pulse at which detection occurs. However, reducing the level of side lobes leads to an expansion of the main lobe as a result of window processing. This increases the probability of “masking” a weak pulse under the main lobe of a strong pulse. For this reason, the authors selected Hann and Hamming windows for comparison as compromise options, which are therefore frequently encountered in practice [25]. In addition, these types of windows require a small amount of memory compared to other window types [26]. A rectangular window is also considered for comparison as the worst case in terms of side lobe suppression.
During the simulation, it was assumed that the input URP completely filled the processing window. Initial data: sampling frequency – 1 GHz; carrier frequency – random from 10 to 490 MHz; types of weighting windows – rectangular, Hann and Hamming; N FFT = 256; 512; 1024; P FD = 10–7; 10–5; 10–3; the width of the histogram bins is 0.25 dB. The results of modelling in the MATLAB environment with 107 iterations for each q PP are presented in Fig. 4–6.
The analysis of the results presented in Fig. 3–6 allows us to draw the following conclusions regarding the choice of the threshold for detecting a weak pulses G thr_WP:
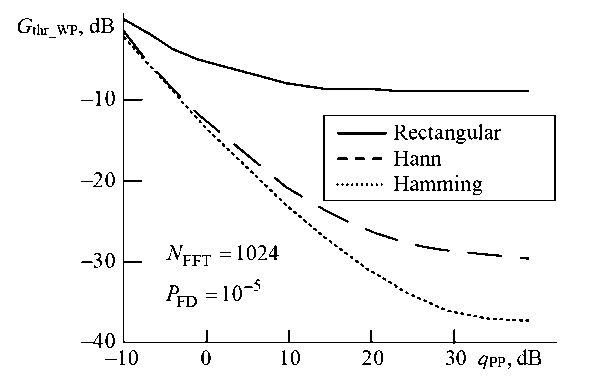
Fig. 4. Dependences of the required value G thr_WP on q PP for different types of weighting window
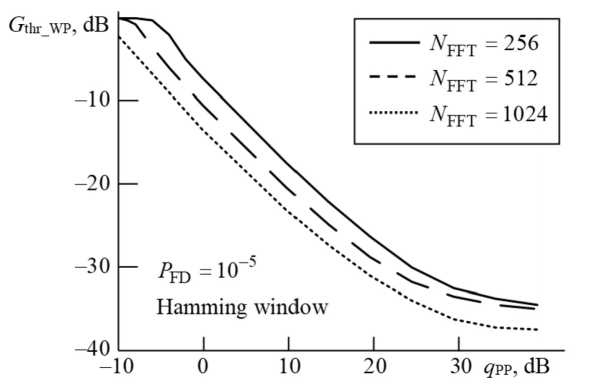
Fig. 5. Dependences of the required value G thr_WP on q PP with N FFT = 256; 512; 1024
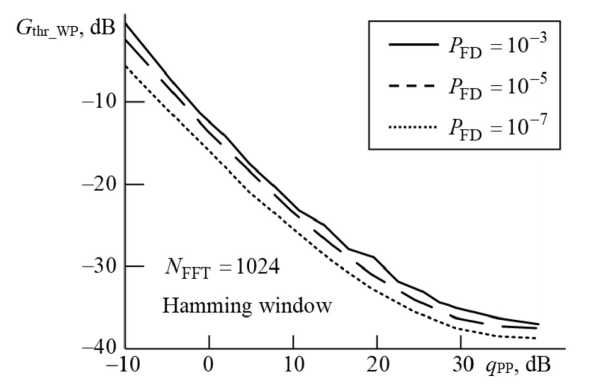
Fig. 6. Dependences of the required value G thr_WP on q PP with P FD = 10–7; 10–5; 10–3
-
1. With the increase of q PP, PDF becomes sharper (Fig. 3). Therefore, to maintain a given P FD, a lower G thr_WP value is required. At q PP ≥ 30 dB, the PDF has the sharpest shape and with further growth of the SNR changes insignificantly. This leads to the fact that the graphs G thr_WP( q PP) at these SNR values reach a plateau (Fig. 4–6).
-
2. Due to the use of Hann and Hamming windows, with q PP increase, a decrease in the required threshold G thr_WP is observed (Fig. 4). Thus, at q PP = 10 dB, G thr_WP for the Hann and Hamming windows is lower than for the rectangular window by 13 and 15 dB, respectively, and at q PP = 40 dB by 21 and 29 dB.
-
3. The Hamming and Hann windows expand the main lobe approximately equally (about two times) compared to the rectangular window. At the same time, at q PP ≥ 30 dB, the required threshold value G thr_WP for the Hamming window is 7.5…8 dB lower compared to the Hann window. Therefore, it is recommended to use the Hamming window to expand the range of amplitudes of detected weak signals. However, its implementation requires approximately 5 times more memory than the implementation of the Hann window [26].
-
4. Increasing N FFT from 256 to 1024 allows to decrease G thr_WP by 3…6 dB with the same P FD.
-
5. For a given window function and N FFT , a decrease in the probability P FD from 10–3 to 10–7 requires an increase in the threshold G thr_WP by 1.2…5.2 dB (Fig. 6).
-
III. Dependences of the probability of correct detection for a weak pulse from on ratio of the amplitudes of the weak and strong pulses
To obtain the dependences of the probability of correct detection of a weak pulse R CDWP on the ratio of the amplitudes of the weak and strong pulses R WP-PP for different types of weak pulses (URP, LFM, BPSK and QPSK) and q PP a simulation was carried out in the MATLAB environment.
The input signal was a mixture of a powerful URP, a weak pulse, and an AWGN with zero mean and unit standard deviation. It was assumed that the powerful URP and the weak pulse completely filled the analysis window, and the frequency of a weak pulse fell in the frequency range of the most powerful side lobe of the powerful pulse.
Input signal parameters: code duration of weak pulses with QPSK and BPSK – from 0.5 to 1 μs with a step of 0.1 μs; rate of change of frequency (frequency slope) of weak LFM pulse – from 0.8 to 24 MHz/μs with a step of 0.05 MHz/μs; initial phase of weak and powerful pulses – random; phase alternation of weak pulses with QPSK and BPSK – random. Carrier frequencies of powerful URP and weak pulses fell in the range from 10 to 490 MHz. The required q PP and R CDWP values were formed by changing the corresponding amplitudes of powerful URP and weak pulse.
The parameters of the developed algorithm are: sampling frequency of 1 GHz, N FFT = 1024, Hamming window. The threshold G thr is set for P FA = 10–7 according to formula (4), and the threshold G thr_WP is obtained for P FD = 10–5 (Fig. 6).
The simulation results for different q PP with 105 measurements at each point of the graph are presented in Fig. 7 and 8.
Based on the obtained results, the following conclusions can be drawn:
-
1. At q PP = 10 dB, the required R WP-PP , providing R CDWP ≥ 0,9 for all types of weak pulses is at least minus 16 dB. An increase from q PP = 10 dB to q PP = 30 dB leads to a decrease in this required R WP-PP
-
2. For q PP = 10 dB and R CDWP ≥ 0,9 required R WP-PP for detection of URP is minus 21.3 dB, for a QPSK pulse – 0.8 dB higher, for a BPSK pulse – 1.3 dB higher, for a LFM pulse – 5.1 dB higher. This difference in required R WP-PP values is due to the difference in the maximum amplitudes of the spectra of weak pulses. Thus, the spectrum of a weak URP has the sharpest shape with the maximum amplitude. The shapes of the spectra of pulses with BPSK and QPSK depend on the code duration and the value of the phase shifts. In the general case, for a fixed signal energy, the spectrum of the QPSK pulse is wider than the URP spectrum, and the spectrum of the BPSK pulse is even wider. Accordingly, the amplitude of the QPSK pulse is lower than the amplitude of the URP, and the amplitude of the BPSK pulse is even lower than that of the URP. The spectrum shape of the LFM pulse depends on the rate of frequency change. For the fixed duration of the LFM pulse, with an increase in the rate of frequency change, the spectrum widens and the maximum of spectrum decreases.
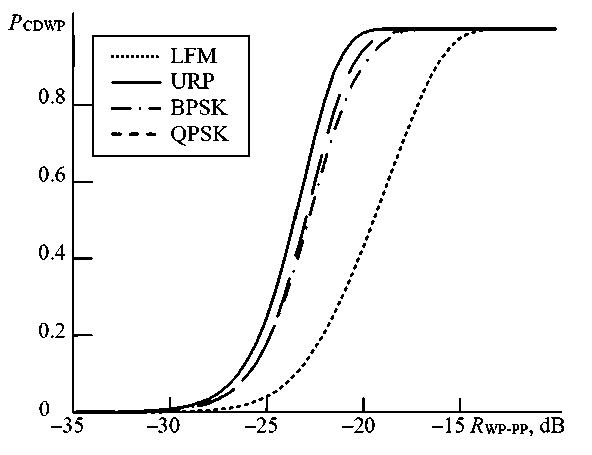
Fig. 7. R CDWP ( R WP-PP ) dependences with q PP = 10 dB
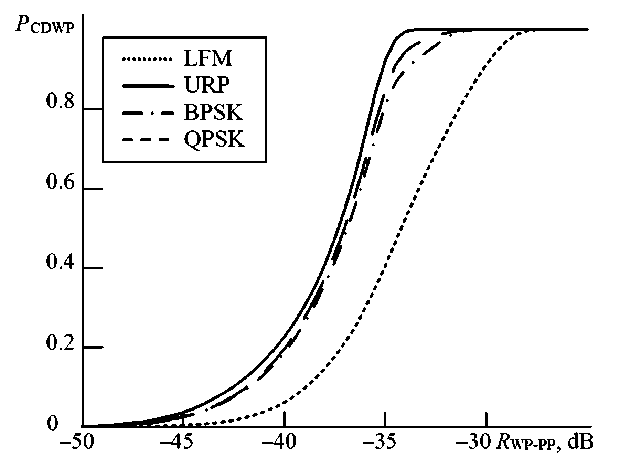
Fig. 8. RCDWP(RWP-PP) dependences with qPP = 30 dB by 14 dB. This is due to a decrease in the influence of AWGN with an increase in SNR, which allows us to detect a weak pulse at lower RWP-PP values.
Conclusion
The paper proposes an algorithm for detecting weak pulses against a powerful pulse. The key feature of the developed algorithm is the use of an adaptive threshold G thr_WP for detecting weak pulses.
Quantitative estimates are given of the effect of the type of window function, the number of FFT points N FFT, the probability of false detection of a weak pulse P FD, the SNR for a powerful pulse q PP, and the ratio of the amplitudes of the weak and powerful pulses R WP-PP on the probability of correct detection of a weak pulse R CDWP.
Based on the research results, the following practical recommendations can be formulated:
-
1. To detect pulses that overlap in time, it is advisable to perform weighting using the Hamming window according to the compromise between the expansion of the main lobe and the extension of the range of amplitudes of detected weak signals.
-
2. For many practical cases, the threshold for detecting a weak pulse G thr_WP can be selected according to the dependencies presented in Fig. 4–6, based on the current SNR for a powerful pulse. The dependencies R CDWP ( R WP-PP , q PP ) presented in Fig. 7 and 8 for typical processing parameters allow us to estimate the probability of correct detection of a weak pulse R CDWP depending on its amplitude relative to a powerful pulse R WP-PP .
Further authors’ research will be aimed at solving the following problems: improving the quality of intra-pulse modulation recognition when the received pulses overlap in time; studying the effect of false detections (caused by side lobes of a powerful signal) and missed detections of weak pulses on the efficiency of further processing stages in the RF spectrum management; studying the same issue when receiving signals in the sub-Nyquist sampling mode.

