Amelioration of fluoride toxicity with the use of indigenous inputs

Author: Maitra A., Datta J.K., Mondal N.K.
Journal: Журнал стресс-физиологии и биохимии @jspb
Article in issue: 3 т.9, 2013.
Free access
An assessment was undertaken to study the efficacy of bacterial consortia isolated from different sources viz. rhizosphere of rice plant, oil spill sites of a petrol pump and from the sludge of a pharmaceutical waste water drain against the impact of fluoride. The experiments were conducted with two crops. In this mung bean experiment Vigna radiata was selected as a test crop. The seeds were sown in the field with bacterial consortia, compost and reduced dose (25% less nitrogen than recommended dose) of chemical fertilizer. After 30days of seed sowing (DAS), plants were collected from the field and dipped into the sodium fluoride solution with different concentrations for 48 hours. Thereafter, the impact of fluoride on chlorophyll, sugar, proline and relative water content (%) were evaluated. Scanning electron microscopy (SEM) of the stem section was performed. SEM studies revealed that anatomical structure deformed with 1.5 mg/l sodium fluoride solution. It was observed that such treatment combination during the sowing of crops leads to combat the impact of lower doses of sodium fluoride (0.2 mg/l). Another experiment was also conducted within plastic pots with and without bacterial consortia isolated from rhizosphere of rice plant and oil spilled soil of petrol pump with the same field soil. Each pot was filled with 5 kg of soil + 2lt of water (on the basis of soil saturation). Oryza sativa seedlings were transplanted with different strength of sodium fluoride solution (25 mgNaF/kg, 50 mgNaF/kg, 100 mgNaF/kg and 500mgNaF/kg) within the above pots. In second experiment, rice plants dried in all pots after 500 mgNaF/kg concentration of sodium fluoride. In this pot experiment bacterial strain are capable of reducing fluoride content in soil as noted by measuring fluoride in the pot soil after the experiment.
Bacterial consortia, compost, fluoride, oil spilled site, rhizosphere, sludge
Short address: https://sciup.org/14323766
IDR: 14323766
Text of the scientific article Amelioration of fluoride toxicity with the use of indigenous inputs
Abbreviations: F- Fluoride, DAS- Days after sowing, SEM- Scanning electron microscope, SEM(±)-Standard error mean. CV(%)- Coefficient of variance, cv- Cultivar, DMRT- Duncan’s multiple range test, WHO- World health organisation, m-Meter
Fluoride is one of the 13thelement in the earth for human (0.6mg/l as per WHO) bone and teeth crust. To a certain extent fluoride ingestion is useful development. But excessive fluoride ingestion can cause disease known as fluorosis (Kugali and Yadawe, 2010; Beg et al., 2011). The sources of fluoride in the environment are soil, air and water. In case of plant/ crop species they can uptake fluoride from the soil as a free ion or it can enter into the plant body through the stomata from the air (Stevens et al.,1997; Mezghani et al.,2005). From the literature survey it is revealed that after uptake of fluoride through plant root from the soil it can accumulated in leaves (Ruan et al., 2003). The presence of fluoride in the soil depends upon the soil type, plant species, pH of soil etc. Fluoride has deleterious effect not only on animal species but also on plants. It is well documented (Fornasiero, 2003; Chang and Thompson, 1966; Bhargava and Bhardwaj, 2010; Gautam et al., 2010) that fluoride causes deleterious effects on plant species. But meagre numbers of work have been so far undertaken for the remediation of adverse effect of fluoride on plant (Alharbi, 2008). There are few microorganisms which has the capability to assimilated fluoride under laboratory conditions. Maximum work is restricted under laboratory conditions. In this study, an attempt have been taken to evaluate whether the application of bacterial consortia, compost and chemical fertilizer (with reduced dose) is able to overcome the adverse effect of fluoride or not. For such evaluation, some physiological parameters and scanning electron microscopic studies were performed.
MATERIALS AND METHODS
Experimental setup
One field experiment was conducted with mung bean ( Vigna radiata ) at Crop Research and Seed Multiplication farm, The University of Burdwan, West Bengal, India. The seeds of mung bean (20g)
were coated with bacterial consortia and gum (50%:50%) for overnight and in the next morning applied in the field. The experiment was conducted in randomized block design. The plot size was 5m x 2.5m. There were three replica i.e., R1, R2 and R3, and ten treatments including control (Chemical fertilizer). Other nine treatments were treated with consortia (Isolated from different sources viz. rhizospheric soil, petrol pump water and soil, pharmaceutical waste water sludge etc). Bacterial consortia were isolated from five different rhizospheric zones viz. T1, T2, T3, T4 and T8. For T6 and T7, bacterial consortia were isolated from soil and water of petrol pump. For T9 and T10 consortia were isolated from two different spots of a pharmaceutical waste water drain. The treatment groups were designed as T1 (bacterial consortium isolated from rhizosphere of rice plant+ compost+ chemical fertilizer), T2 (bacterial consortium isolated from rhizosphere of rice plant+ compost+ chemical fertilizer), T3 (bacterial consortium isolated from rhizosphere of rice plant+ compost+ chemical fertilizer), T4 (bacterial consortium isolated from rhizosphere of rice plant+ compost+ chemical fertilizer), T6 (bacterial consortium isolated from water oil spilled of petrol pump+ compost+ chemical fertilizer), T7 (bacterial consortium isolated from water oil spilled of petrol pump+ compost+ chemical fertilizer), T8 (bacterial consortium isolated from rhizosphere of rice plant+ compost+ chemical fertilizer), T9 (bacterial consortium isolated from the sludge of pharmaceutical waste water + compost+ chemical fertilizer) and T10 (bacterial consortium isolated from the sludge of pharmaceutical waste water + compost+ chemical fertilizer). Here, T5 designed as control (recommended dose of chemical fertilizer 120:50:50 of N:P:K). After 30 DAS of seed sowing seedlings were collected washed in distilled water and dipped into culture tube filled with sodium fluoride solutions of different concentrations (0.2 mg/l, 0.6mg/l, 1.0 mg/l, 1.5 mg/l and 1.75 mg/l).
Parameter studied
After 48 hours of incubation biochemical parameters viz. chlorophyll (Arnon, 1949), total soluble sugar (McCready et al., 1950), proline (Bates et al., 1973) and relative water content % (Bars and Weatherley, 1962) were measured. For the SEM study, stem sections were taken from those stem dipped into culture tube with sodium fluoride solution of different strength. For SEM study preparation stem sections were dipped into glutaraldehyde (2.5%) for 2 hours and then in 50% ethyl alcohol for 5 minutes, next in 70% alcohol for 30 minutes in successive two changes. Finally, samples were dried in the air and the effect of fluoride on anatomical structure was undertaken with the help of scanning electron microscope (SEM). Side by side another experiment was conducted without fluoride treatment. Duncan’s multiple range test (DMRT) was done with MINITAB software package (version 16) and analysis of variance (ANOVA) was done by following method of Gomez and Gomez, 1984. SEM (±) and CV% were performed to study the significance of different fluoride concentration on different parameters studied.
Pot culture
In another experiment with rice plant under pot culture with two sets were conducted. One with fluoride plus bacterial consortia and another with fluoride minus consortia. Each pot filled with 5 kg soil + 2 lt water. The water was poured in each pot on the basis of soil saturation. The design was randomized block design and number of treatments were four. The test species i.e., rice was treated with different sodium fluoride under pot culture. Here, pots were designed as T1 (Control i.e., no sodium fluoride + 5 kg soil + 2lt water + recommended dose of chemical fertilizer: 120:50:50), T2 (25 mgNaF/kg fluoride treatment : 0.111g of sodium fluoride + 5 kg soil + 2lt water), T3 (50 mgNaF/kg fluoride treatment: 0.222g of sodium fluoride salt+ 5 kg soil+2 lt water), T4 (100 mgNaF/kg fluoride treatment : 0.442 g of sodium fluoride salt+ 5kg soil+ 2 lt water) and T5 (500 mgNaF/kg fluoride treatment: 2.210 g salt of sodium fluoride+ 5 kg soil+ 2 lt water). In this experiment fluoride content was estimated in chemical fertilizer, soil and water used in both the sets of pot experiment with the help of Orion ion selective electrode (ORION STAR A214 pH/ISE meter). Soil fluoride content was estimated by partial leaching method (Paul et al., 2011) and measured its quantity through Orion ion selective electrode. Beside this fluoride content in the paddy leaves were also measured by digestion method (Paul et al., 2011) and ion selective electrode.
RESULTS
Data on chlorophyll level on 30 DAS of seed sowing have been presented in Table 1 for T 1. Here seed treatments were performed with bacterial strain obtained from rhizospheric soil at four different sites where soil type is alluvium. Four treatment represents four different field site viz. T 1 , T 2 , T 3 , T 4 and T 8 along with a control (120N:50P:50K). We find that even with fluoride treatment from 0.2 mg/l to 1.75 mg/l in all cases (Chlorophyll “a”, Chlorophyll “b” and Total chlorophyll) the level of chlorophyll was above the value of control set with 0.2 mg/l treatment and were highest among all the treatments. The data shows differences among themselves from the
DMRT wording. For T 1 to T 10 data have been presented in Table 1. On 30 DAS, in T 2 , T 3 , T 4 and T 8 the trend was similar to T 1 . For T 6 and T 7 , treated with consortia isolated from soil and water of petrol pump highest level of chlorophyll (Chlorophyll “a”, Chlorophyll “b” and Total chlorophyll) took place with 0.2 mg/l of sodium fluoride treatment. The trend was similar toT 1 , T 2 , T 3 , T 4 and T 8. The data for T 9 and T 10 have been presented in Table 1. Here also 0.2 mg/l fluoride treatment showed highest value. Data for chlorophyll level on 45 DAS have been presented in Table 2. The general trend with all the treatment indicate a decrease in chlorophyll level on 45 days with all the bacterial strains isolated from rhizospheric soil, petrol pump oil spilled soil and biomedical waste water drainage soil except T 7 and T 10 where the level increased with 0.2 and 0.6 mg/l sodium fluoride treatment.
Data for relative water content (%) have been presented in Table 3. The trend of enhanced rate of relative water content (%) over all treatments was noted with 0.2 except T 6 , T 8 , T 9 and T 10 . For sugar and proline content data have been presented in Table 4. In all the treatments maximum accumulation of total soluble sugar and proline in physiologically active leaves took place with 1.75 mg/l sodium fluoride except T 6.
From the pot culture it was noted that fluoride level in soil decreased in those pots which were treated with bacterial consortia as compared to the fluoride level of those soil treated without bacterial consortia (Table 5). Fluoride level were within the permissible limit range of water, soil, urea and muriate of potash used in pot experiment (Table 5) except single super phosphate where fluoride level was above the permissible limit (Table 5). Fluoride content in leaf samples were within the range and highest value detected in 500 mgNaF/kg fluoride treatment (Table 7).
Results of SEM study showed deleterious effect of fluoride on anatomical structure of mung bean stem and side by side the extent at which bacterial consortia was able to combat against this effect and protected the stem’s vascular tissues.
With T 2 1.75 mg/l concentration blockage was took place and it is prominent (Fig. 1a). From the observation it may be concluded that the effect of fluoride concentration was more prominent in the stem as compared to root as because rupturing of the vessels of the conducting tissues took place as appeared in the SEM photograph. With T 6 1.5 mg/l no such distortion took place. But thin film of blockage took place (Fig. 1b). With T 7 (1.75mg/l fluoride plus bacterial consortia) treatment similar results were obtained but some short of distortion was also observed (Fig. 1c). With T 10 1.5 mg/l superficial blockage but intact nature of vessels were observed (Fig. 1d).
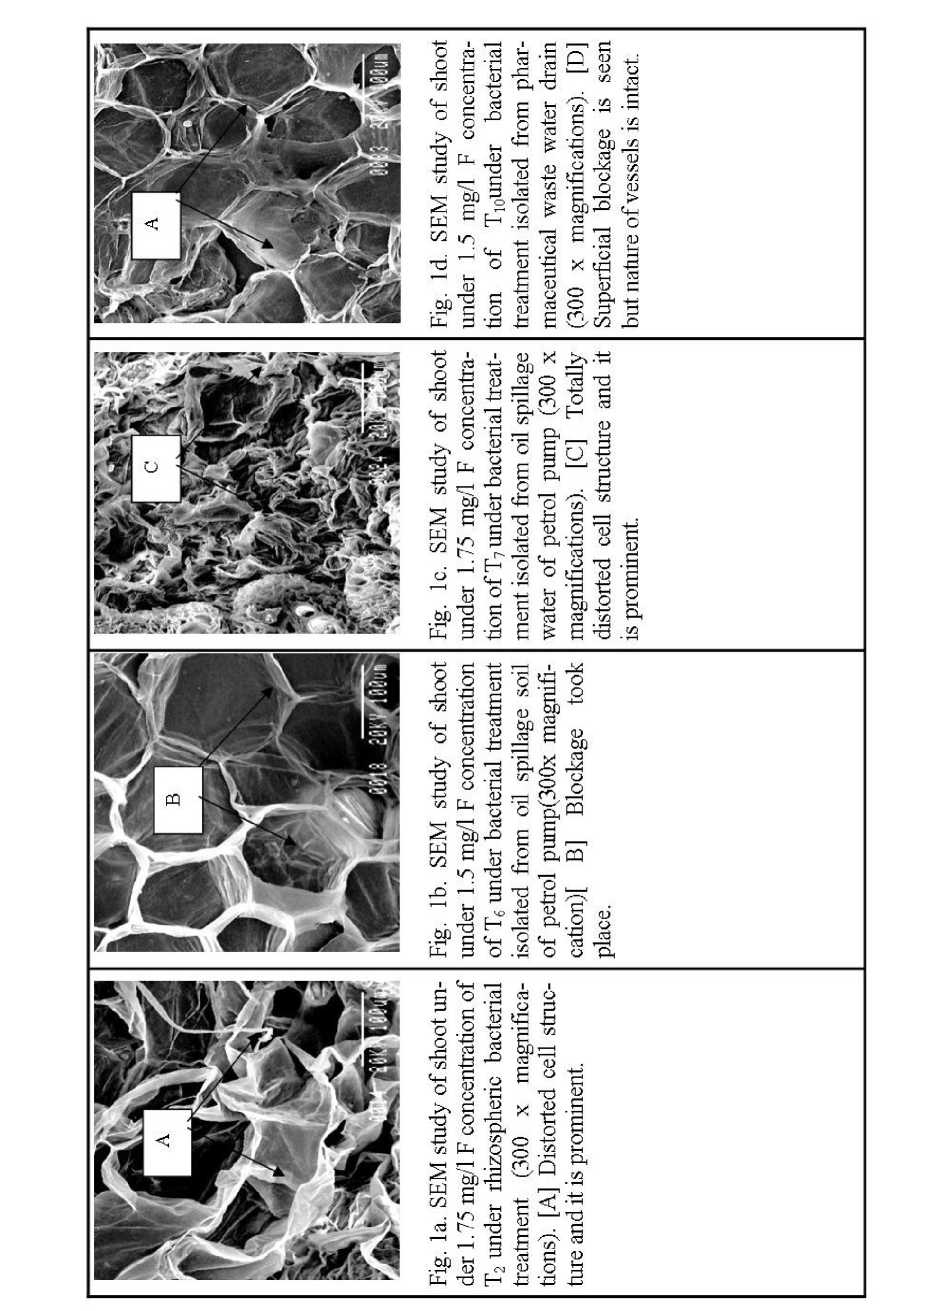
Table 1. Effect of F on chlorophyll on 30 DAS in leaves of seedlings (T 1 -T 10 bacterial consortia).
|
Variant |
Treatments (mg/l) |
Chlorophyll “a” (mg/g FW) |
Chlorophyll “b” (mg/g FW) |
Total Chlorophyll (mg/g FW) |
|
T 1 |
Control |
0.626 f |
0.412 e |
1.007 f |
|
0.2 |
3.007 a |
1.735 a |
5.431 a |
|
|
0.6 |
2.955 b |
1.706 b |
5.408 b |
|
|
1.0 |
2.726 c |
0.934 c |
3.869 c |
|
|
1.5 |
2.414 d |
0.897 d |
3.382 d |
|
|
1.75 |
1.104 e |
0.370 f |
1.440 e |
|
|
SEM(±) |
0.002 |
0.008 |
0.005 |
|
|
CV% |
0.2 |
1.0 |
0.3 |
|
|
T 2 |
Control |
0.626 f |
0.412 e |
1.007 f |
|
0.2 |
1.787 a |
0.598 a |
2.379 a |
|
|
0.6 |
1.582 b |
0.460 b |
1.986 b |
|
|
1.0 |
1.131 c |
0.360 d |
1.449 c |
|
|
1.5 |
0.913 d |
0.314 e |
1.182 d |
|
|
1.75 |
0.863 e |
0.287 f |
1.122 e |
|
|
SEM(±) |
0.001 |
0.03 |
0.002 |
|
|
CV% |
0.2 |
1.3 |
0.3 |
|
|
T 3 |
Control |
0.626 e |
0.412 e |
1.007 e |
|
0.2 |
3.042 a |
2.152 a |
6.083 a |
|
|
0.6 |
2.970 b |
2.013 b |
5.485 b |
|
|
1.0 |
2.902 c |
1.340 c |
4.482 c |
|
|
1.5 |
0.724 d |
0.683 d |
1.400 d |
|
|
1.75 |
0.481 f |
0.303 f |
0.980 e |
|
|
SEM(±) |
0.004 |
0.005 |
0.009 |
|
|
CV% |
0.3 |
0.8 |
0.5 |
|
|
T 4 |
Control |
0.626 e |
0.412 f |
1.007 f |
|
0.2 |
3.086 a |
1.855 a |
4.452 a |
|
|
0.6 |
2.873 b |
1.274 b |
4.219 b |
|
|
1.0 |
1.348 c |
0.674 c |
1.963 c |
|
|
1.5 |
1.345 c |
0.575 d |
1.769 d |
|
|
1.75 |
0.921 e |
0.494 e |
1.637 e |
|
|
SEM(±) |
0.002 |
0.004 |
0.004 |
|
|
CV% |
0.5 |
0.8 |
0.3 |
|
|
T 6 |
Control |
0.626 f |
0.412 e |
1.007 f |
|
0.2 |
2.972 a |
1.878 a |
5.527 a |
|
|
0.6 |
2.696 b |
1.027 b |
3.799 b |
|
|
1.0 |
2.313 c |
1.023 b |
3.310 c |
|
|
1.5 |
1.548 d |
0.599 c |
2.396 d |
|
|
1.75 |
1.037 e |
0.432 d |
1.400 e |
|
|
SEM(±) |
0.004 |
0.002 |
0.134 |
|
|
CV% |
0.4 |
0.4 |
8.0 |
|
|
T 7 |
Control |
0.626 e |
0.412 a |
1.007 e |
|
0.2 |
0.975 a |
0.308 b |
1.239 a |
|
|
0.6 |
0.884 b |
0.296 b |
1.149 b |
|
|
1.0 |
0.804 c |
0.291 bc |
1.093 c |
|
|
1.5 |
0.782 d |
0.273 c |
1.043 d |
|
|
1.75 |
0.403 f |
0.202 d |
0.566 f |
|
|
SEM(±) |
0.004 |
0.002 |
0.004 |
|
|
CV% |
0.5 |
0.4 |
0.6 |
|
|
T 8 |
Control |
0.626 b |
0.412 a |
1.007 a |
|
0.2 |
0.675 a |
0.200 b |
0.845b |
|
|
0.6 |
0.561c |
0.190 b |
0.726c |
|
|
1.0 |
0.503d |
0.167 c |
0.631d |
|
|
1.5 |
0.491e |
0.149 d |
0.627d |
|
|
1.75 |
0.359f |
0.145 d |
0.487e |
|
|
SEM(±) |
0.002 |
0.005 |
0.004 |
|
|
CV% |
1.2 |
3.8 |
0.5 |
|
|
T 9 |
Control |
0.626 c |
0.412 e |
1.007 b |
|
0.2 |
0.817 a |
1.878 a |
1.020 a |
|
|
0.6 |
0.668 b |
1.027 b |
0.830 c |
|
|
1.0 |
0.623 c |
1.023 b |
0.773 d |
|
|
1.5 |
0.278 d |
0.599 c |
0.358 e |
|
|
1.75 |
0.129 e |
0.432 d |
0.182 f |
|
|
SEM(±) |
0.004 |
0.005 |
0.003 |
|
|
CV% |
1.3 |
3.8 |
0.7 |
|
|
T 10 |
Control |
0.626 b |
0.412 d |
1.007 c |
|
0.2 |
0.829 a |
0.950 a |
1.855 a |
|
|
0.6 |
0.676 b |
0.583 b |
1.247 b |
|
|
1.0 |
0.479 d |
0.481 c |
0.927 d |
|
|
1.5 |
0.471 d |
0.287 e |
0.882 e |
|
|
1.75 |
0.308 e |
0.146 f |
0.571 f |
|
|
SEM(±) |
0.004 |
0.007 |
0.007 |
|
|
CV% |
1.2 |
6.6 |
0.8 |
Table 2. Effect of F on chlorophyll on 45 DAS in leaves of seedlings (T 1 -T 10 bacterial consortia)
|
Variant |
Treatments (mg/l) |
Chlorophyll “a” (mg/g FW) |
Chlorophyll “b” (mg/g FW) |
Total Chlorophyll (mg/g FW) |
|
T 1 |
Control |
0.766 a |
0.206 a |
0.945 a |
|
0.2 |
0.166 b |
0.047 b |
0.238 b |
|
|
0.6 |
0.155 bc |
0.081 b |
0.226 b |
|
|
1.0 |
0.135 cd |
0.067 b |
0.175 c |
|
|
1.5 |
0.128 d |
0.060 b |
0.169 cd |
|
|
1.75 |
0.094 e |
0.056 b |
0.152 d |
|
|
SEM(±) |
0.004 |
0.013 |
0.007 |
|
|
CV% |
4.8 |
27.1 |
3.6 |
|
|
T 2 |
Control |
0.766 a |
0.206 a |
0.945 a |
|
0.2 |
0.301 b |
0.166 b |
0.401 b |
|
|
0.6 |
0.298 b |
0.131 c |
0.378 c |
|
|
1.0 |
0.275 c |
0.106 d |
0.371 c |
|
|
1.5 |
0.267 c |
0.098 e |
0.353 d |
|
|
1.75 |
0.249 d |
0.092 e |
0.326 e |
|
|
SEM(±) |
0.006 |
0.002 |
0.004 |
|
|
CV% |
2.6 |
2.9 |
1.6 |
|
|
T 3 |
Control |
0.766 a |
0.206 a |
0.945 a |
|
0.2 |
0.717 b |
0.154 b |
0.960 a |
|
|
0.6 |
0.380 c |
0.107 c |
0.530 a |
|
|
1.0 |
0.320 d |
0.087 d |
144.260a |
|
|
1.5 |
0.099 e |
0.063 e |
0.160 a |
|
|
1.75 |
0.079 f |
0.060 e |
0.140a |
|
|
SEM(±) |
0.006 |
0.003 |
58.7 |
|
|
CV% |
2.6 |
5.0 |
415.2 |
|
|
T 4 |
Control |
0.766 a |
0.205 a |
0.945 a |
|
0.2 |
0.347 b |
0.119 b |
0.452 b |
|
|
0.6 |
0.285 c |
0.096 c |
0.367 c |
|
|
1.0 |
0.176 d |
0.079 d |
0.252 d |
|
|
1.5 |
0.167 d |
0.073 e |
0.236 e |
|
|
1.75 |
0.140 e |
0.064 f |
0.195 f |
|
|
SEM(±) |
0.005 |
0.002 |
0.004 |
|
|
CV% |
2.9 |
2.5 |
1.7 |
|
|
T 6 |
Control |
0.766 a |
0.206 f |
0.945 a |
|
0.2 |
0.612 b |
0.187 b |
0.794 b |
|
|
0.6 |
0.407 c |
0.097 c |
0.556 c |
|
|
1.0 |
0.263 d |
0.095 c |
0.351 d |
|
|
1.5 |
0.227 e |
0.064 d |
0.319 e |
|
|
1.75 |
0.089 f |
0.050 d |
0.134 f |
|
|
SEM(±) |
0.005 |
0.006 |
0.002 |
|
|
CV% |
2.1 |
8.2 |
0.7 |
|
|
T 7 |
Control |
0.766c |
0.206b |
0.945c |
|
0.2 |
1.226a |
0.349a |
1.553a |
|
|
0.6 |
1.108b |
0.344a |
1.436b |
|
|
1.0 |
0.397d |
0.139c |
0.506d |
|
|
1.5 |
0.289e |
0.098d |
0.318e |
|
|
1.75 |
0.107f |
0.067e |
0.148f |
|
|
SEM(±) |
0.004 |
0.006 |
0.005 |
|
|
CV% |
1.2 |
5.3 |
1.1 |
|
|
T 8 |
Control |
0.766 a |
0.206 b |
0.945 b |
|
0.2 |
0.351 bcd |
0.137 d |
2.160 a |
|
|
0.6 |
0.217 cd |
0.088 e |
0.740 c |
|
|
1.0 |
0.070 d |
0.054 f |
0.472 d |
|
|
1.5 |
1.357 a |
0.524 a |
0.287 e |
|
|
1.75 |
0.563 bc |
0.177 c |
0.115 f |
|
|
SEM(±) |
1.39 |
0.004 |
0.030 |
|
|
CV% |
43.3 |
3.8 |
6.6 |
|
|
T 9 |
Control |
0.766 c |
0.206 c |
0.945 c |
|
0.2 |
2.409 a |
0.761 a |
3.230 a |
|
|
0.6 |
1.676 b |
0.489 b |
2.094 b |
|
|
1.0 |
0.738 d |
0.195 c |
0.897 d |
|
|
1.5 |
0.185 e |
0.090 d |
0.256 e |
|
|
1.75 |
0.131 f |
0.080 d |
0.199 f |
|
|
SEM(±) |
0.006 |
0.005 |
0.005 |
|
|
CV% |
1.0 |
2.7 |
0.7 |
|
|
T 10 |
Control |
0.766 c |
0.206 c |
0.945 b |
|
0.2 |
1.652 a |
0.453 a |
2.379 a |
|
|
0.6 |
0.827 b |
0.240 b |
1.062 b |
|
|
1.0 |
0.675 d |
0.206 c |
0.895 b |
|
|
1.5 |
0.339 e |
0.131 d |
0.471 c |
|
|
1.75 |
0.275 f |
0.126 d |
0.402 c |
|
|
SEM(±) |
0.006 |
0.006 |
0.121 |
|
|
CV% |
1.4 |
4.8 |
20.4 |
Table 3. Effect of F on relative water content (%) on 45 DAS in leaves of seedlings (Ti-Тю bacterial consortia)
|
£ С 0J о |
1-^ |
00 СО СП м |
e об oo |
00 |
8 |
co |
гЧ |
8 d |
d |
|
н' |
00 со aS 00 |
о CO 00 |
5 |
cn о i—i |
* CD |
q co CD |
о d |
o |
|
|
н |
3 00 |
aj oo |
№ 00 |
8 d 00 |
aS |
q aS |
e-4 О d |
о |
|
|
н |
DO со aS DO |
oq co Ch |
9 8 |
о m Ci |
aS DO |
O) q DO |
3 d |
d |
|
|
н |
00 CD aS 00 |
00 |
ГЧ O) CD |
rn 1—1 d 03 |
CD q r? |
CO CD co |
q |
||
|
н |
3 aS 00 |
9 CD Ch |
5 8 |
m |
от |
8 8 |
5 d |
о |
|
|
н |
3 aS oo |
oo CD О ai |
d Ch |
В |
8 |
о q 00 |
m q d |
H d |
|
|
н4 |
3 aS 00 |
oq m |
DO O1 s |
8 |
d oo |
3 |
8 d |
d |
|
|
н |
00 co aS DO |
d a^ |
00 8 |
M |
CO |
3 |
о d |
о |
|
|
И Е 1— |
1 e о u |
d |
CD 6 |
q |
1Л |
s 2 LU V) |
^ u |
||
|
HI о |
s 1= |
у |
гЧ о d |
8 о |
ап о о |
00 О о |
8 О |
О |
8 О |
СО |
|
О = -Q b > £ 9 9 £ » |
о 00 |
5 |
й |
о |
S m |
го |
ОО |
00 о |
||
|
1- |
2 is |
гч В о |
ю ОТ |
1 |
о о ОТ |
00 о гЧ |
о 1-4 |
гЧ о о |
о |
|
|
3 2 S> «§ £ 8 3 £ t>o |
о гч |
6 |
о q |
о aS |
3 |
о Ch |
-т СО О |
со гЧ |
||
|
H |
H? |
о о |
00 |
от |
гч |
о св |
ID О о о |
о |
||
|
ш 8 3 = a ™S |
о 00 |
о |
о |
тЧ |
8 aS сч |
е |
СП о |
гЧ 00 е—1 |
||
|
1- |
O 00 > £ з£ |
о о |
5 |
ОТ со |
СЛ |
о СП о |
о СП |
о о о |
о |
|
|
g з з £ 9 9 £ w |
о об 1—1 |
d |
о со о гч |
-7 |
m aS |
СО 8 О |
о |
|||
|
H |
S aS |
1*4 о о |
8 |
о о |
R |
m |
Ор |
8 О |
гЧ о |
|
|
з = a^s о з „ |
8 г-1 |
о |
о со |
R |
s |
8 об |
гЧ О |
LfS |
||
|
H |
lis |
О О |
00 о |
3 |
О 00 о т-i |
о 1—i |
со |
д) О О о |
СО о |
|
|
о з = a » S |
О 00 |
ГП |
8 |
О |
о СП со |
гЧ гЧ О |
СЛ гЧ |
|||
|
H |
о о |
о о |
Ji о о |
СП о о |
DO СО о о |
со о о |
8 О |
СО со |
||
|
з = a^ £ 9 9 £ =<> |
я об Н |
8 |
о |
о гч |
о |
о |
СП о |
|||
|
1—4 |
01 1 is |
О о |
я о |
3 d |
гЧ |
ф гЧ |
СО 1—1 |
о о |
о |
|
|
s a g |
о 00 |
5 |
1 Г-1 |
j! 9 гЧ |
л гЧ |
S |
W |
|||
|
H |
SIS |
о о |
о о |
8 о |
1 О о |
СО а о |
g о |
о О о |
S |
|
|
ш 8 з з a ™ g £ 9 9 £ |
о об г-1 |
о |
о ГО |
ъ to |
со об |
S |
гЧ о |
|||
|
и E l— |
1 о U |
d |
СО о |
о |
1Л |
S S LU 1Л |
^ U |
|||
Table 5. Comparative study related to fluoride content in soil with & without bacterial consortia treatment
|
Treatments (mgNaF/kg) |
Fluoride plus bacterial consortia (mgNaF/kg) |
Fluoride minus bacterial consortia (mgNaF/kg) |
|
25 |
0.10 |
0.14 |
|
50 |
0.19 |
0.28 |
|
100 |
0.28 |
0.45 |
|
500 |
0.54 |
2.3 |
Table 6. Fluoride content in soil, water and fertilizers used in pot experiment
|
Substance |
Fluoride (mg/l) |
|
Soil |
0.17 |
|
Water |
0.64 |
|
Single super phosphate |
10 |
|
Mureate of potash |
0.47 |
|
Urea |
0.58 |
Table 7. Fluoride content in plant leaves
|
Treatments (mg/l) |
Fluoride plus bacterial consortia (mg/l) |
Fluoride minus bacterial consortia (mg/l) |
|
25 |
0.005 |
0.012 |
|
50 |
0.019 |
0.025 |
|
100 |
0.025 |
0.039 |
|
500 |
0.038 |
0.044 |
DISCUSSION any earlier worker particularly in relation to the impact of fluoride ion on anatomical structural From the available data it is revealed that with change within the plant due to the additive effect of all the treatment i. e., from T1 to T10 maximum level bacterial consortia and its interaction with fluoride of chlorophyll was obtained with 0.2 mg/l fluoride ion. Macromolecular level change took place within treatment. From this result it may concluded that the plant due to bacterial consortia inoculation 0.2 mg/l of fluoride treatment resulted to positive under field study and that developed the higher influence towards the accumulation of more level of chlorophyll in mung bean leaf and this level chlorophyll on 30 DAS of crop growth. The results was higher even the plant twig kept within the related to stress enduring metabolites viz. total fluoride solution for 48 hours continuously. Since soluble sugar and proline clearly indicate that due among the crop plant, the leguminous crop (here to higher concentration of sodium fluoride the species is Vigna radiata) have the highest treatment (1.75 mg/l) highest level of sugar and pollution tolerance index value, the crop plant proline accumulated in the physiologically active resisted the impact of fluoride effect due to the leaf (Datta et al., 2012). From literature survey it synergistic effect of bacterial consortia as well the appears that there is meagre work have taken by inherent character of leguminous crop. Choudhary and Bohra (1989) suggested in their work that fluoride ion induced some metabolic changes which played a decisive role in the adaptation towards stress. In our experiment we have found higher level of sugar and proline with 1.75 mg/l sodium fluoride treatment. In all cases, it was also observed that above the level (0.2 mg/l) of fluoride level the chlorophyll did not increased. This suggest that bacterial consortia were able to overcome the deleterious effect of fluoride up to 0.2 mg/l strength in this crop species related to chlorophyll biosynthesis grown under old alluvial soil zone of Burdwan, West Bengal, because above this level (0.2 mg/l) chlorophyll biosynthesis decreased. Therefore, it could be concluded that under field condition crop species could be saved if we change our agricultural practice with compost and bacterial inoculation. Since India is an agricultural based country this type of work may be very useful if we can isolate our indigenous soil bacterial population for other soil types in our country. In our study, we recorded higher level of proline and sugar accumulation with higher concentration of fluoride treatment (1.75 mg/l). It corroborates the findings of earlier workers like Yang and Miller, 1963; Singh et al., 1972; Stewart and Lee, 1974 and Yu, 1966. They suggested that enhancement of sugar, proline level enhanced the tolerance capacity of plant under stress condition. The relative water content (%) increased up to 0.2 mg/l concentration and beyond that it decreased might be due to the higher concentration of fluoride ion blocked the water flow (Choudhary and Bohra, 1989) along with deformation of water conducting vascular tissues leads to a passive effect on water uptake capacity (Zhang et al., 2012). From the above study it is clear that our observations with leguminous crop used in this experiment i.e., Vigna radiata with different bacterial strain isolated from different sites such as rhizosphere of rice plant, petrol pump soil and pharmaceutical waste water have some potentiality in combating fluoride effect. From the micrograph study it can be concluded that in vascular tissues of shoot remain intact under treatment of bacterial consortia which were isolated from pharmaceutical waste water and oil spillage soil of petrol pump over the other bacterial consortia treated stem tissues used in this experiment. The potentiality of bacterial consortia not only showed in field based laboratory method but it is really clear from further pot experiment where such consortia reduced the fluoride level in both soil and leaf of test species used in pot culture.
ACKNOWLEDGEMENT
The work was carried out with the financial support from Department of Science and Technology, Government of India in the form of INSPIRE Fellowship to Miss A. Maitra. We are thankful to Miss Shampa Datta, Assistant Professor, Microbiology, (contractual) for her help in microbiological work. For field work we are thankful to field staff of Rural Technology Centre, Burdwan University. Authors are also grateful to Dr. S Chakrabarty, USIC, Burdwan University, for his active cooperation during SEM study and photography.
References Amelioration of fluoride toxicity with the use of indigenous inputs
- Alharbi, S.A. (2008) In vitro solubilization of insoluble fluorides by selected fungi. Afr. J.Microbiol.Res., 2, 319-321.
- Arnon, D.I. (1949) Copper enzymes in isolated chloroplast. Polyphenol Oxidase in Beta vulgaris. Plant Physiol., 24, 1-15.
- Barrs, H.D. and Weatherley, P.E. (1962) A re-examination of the relative turgidity technique for estimating water deficit in leaves. Aust. J. Biol. Sci., 15, 413-428.
- Bates, L.S., Waldren, R.P. and Teare, I.D. (1973) Rapid determination of free proline for water stress studies. Plant Soil., 39, 205-207.
- Beg, M.K., Srivastav, S.K., Carranza, E.J.M. and de Smeth, J.B. (2011) High fluoride incidence in ground water and its potential health effects in parts of Raigarh district, Chattisgarh, India. Curr. Sci., 100(5), 750-754.
- Bhargava, D. and Bhardwaj, N. (2010) Effect of sodium fluoride on seed germination and seedling growth of Triticum aestivum Var. Raj. 4083. J. Phytol., 2(4), 41-43.
- Chang, C.W. and Thompson, C.R. (1966) Site of fluoride accumulation in Navel orange leaves. Plant Physiol., 41, 211-213.
- Choudhary, S. and Bohra, S.P. (1989) Effect of sodium fluoride on certain enzymes and proline content in Cenchrus leaves. Bot. Bull. Academia Sinica., 30, 9-14.
- Datta, J.K., Maitra, A., Mondal, N.K. and Banerjee, A. (2012) Studies on the impact of fluoride toxicity on germination and seedling growth of gram seed (Cicer arietinum L. cv. Anuradha). J. Stress Physiol. Biochem., 8(1), 194-2012.
- Dey, U., Mondal, N.K., Das, K. and Datta, J.K. (2012) Dual effects of fluoride and calcium on the uptake of fluoride, growth physiology, pigmentation, and biochemistry of bengal gram seedlings (Cicer arietinum l.). Fluoride, 45(4), 389-393.
- Fornasiero, R.B. (2003) Fluoride effects on Hypericum perforatum plants: first field observations. Plant Sci., 165(3), 507-513.
- Gautam, R., Bharadwaj, N. and Saini, Y. (2010) Fluoride accumulation by vegetables and crops grown in Nawa Tehsil of Nagpur district (Rajasthan, India). J. Phytol., 2(2), 80-85.
- Gomez, K.A. and Gomez, A.A. (1984) Statistical procedures for Agril. Res., (2nd ed.), John Willey and Sons, New York.
- Kugali, N.M. and Yadawe, M.S. (2010) Pollution of drinking water due to fluoride and dental fluorosis at hunagund taluk of bagalkot district, Karnataka. Int. J. Appl Biol.Pharm Technol.,1(2), 322-328.
- McCready, R.M., Goggolz. J., Siliviera, V. and Owens, H.S. (1950) Determination of starch and amylase in vegetables. Analytical Chemistry., 22, 1156-1158.
- Mezghani, I., Elloumi, N., Abdallah, F.B., Chaieb, M. and Boukhris, M. (2005) Fluoride accumulation by vegetation in the vicinity of a phosphate fertilizer plant in Tunisia. Fluoride., 38(1), 69-75.
- Paul, E.D., Gimba, C.E., Kagbu, J.A., Ndukwe, G.I. and Okibe, F.G. (2011) Spectrophotometric determination of fluoride in water, soil and vegetables from the precinct of river Basawa, Zaria, Nigeria. J. Basic. Appl Chem.,1(6), 33-38.
- Ruan, J., Ma, L., Shi, Y. and Han, W. (2003) Uptake of fluoride by tea plants(Camellia sinensis L.) and the impact of aluminium. J. Sci Food. Agri., 83, 1342-1348.
- Singh, G., Kaur, P. and Sharma, R. (1985) Effect of ccc and kinetin on certain biochemical parameters in wheat under different salinity levels. Plant Physiol. Biochem., 12, 104-111.
- Stevens, D.P., McLaughlin, M.J. and Alston, A.M. (1997) Phytotoxicity of aluminium-fluoride complexes and their uptake from solution culture by Avena sativa and Lycopersicon esculentum. Plant Soil., 192, 81-93.
- Stewart, G.R. and Lee, J.A. (1974) The role of proline accumulation in hydrophytes. Planta (Berl)., 120, 279-289.
- Yang, S.F. and Miller, G.W. (1963) Biochemical studies on the effect of fluoride on higher Plants. 1. Metabolism of carbohydrates, organic acids and amino acids. J. Biochem., 88, 505-509.
- Yu, M.H. (1996) Effect of hydrogen fluoride on growth and soluble sugars in germinating mung bean (Vigna radiata) seeds. Fluoride, 29(1), 3-6.
- Zhang, L., Li, Q., Ma, L. and Ruan, J. (2012) Charaterization of fluoride uptake by roots of tea plants (Camellia sinensis (L.) O. Kuntze). Plant Soil., DOI10.1007/s11104-0012-1466-2.
