An Analysis on Performance of Decision Tree Algorithms using Student’s Qualitative Data

Author: T.Miranda Lakshmi, A.Martin, R.Mumtaj Begum, V.Prasanna Venkatesan
Journal: International Journal of Modern Education and Computer Science (IJMECS) @ijmecs
Article in issue: 5 vol.5, 2013.
Free access
Decision Tree is the most widely applied supervised classification technique. The learning and classification steps of decision tree induction are simple and fast and it can be applied to any domain. In this research student qualitative data has been taken from educational data mining and the performance analysis of the decision tree algorithm ID3, C4.5 and CART are compared. The comparison result shows that the Gini Index of CART influence information Gain Ratio of ID3 and C4.5. The classification accuracy of CART is higher when compared to ID3 and C4.5. However the difference in classification accuracy between the decision tree algorithms is not considerably higher. The experimental results of decision tree indicate that student’s performance also influenced by qualitative factors.
Decision Tree Algorithm, ID3, C4.5, CART, student’s qualitative data
Short address: https://sciup.org/15014546
IDR: 15014546
Text of the scientific article An Analysis on Performance of Decision Tree Algorithms using Student’s Qualitative Data
Published Online June 2013 in MECS DOI: 10.5815/ijmecs.2013.05.03
Data mining applications has got rich focus due to its significance of classification algorithms. The comparison of classification algorithm is a complex and it is an open problem. First, the notion of the performance can be defined in many ways: accuracy, speed, cost, reliability, etc. Second, an appropriate tool is necessary to quantify this performance. Third, a consistent method must be selected to compare with the measured values.
The selection of the best classification algorithm for a given dataset is a very widespread problem. In this sense it requires to make several methodological choices. Among them, in this research it focuses on the decision tree algorithms from classification methods, which is used to assess the classification performance and to find the best algorithm in obtaining qualitative student data.
Decision Tree algorithm is very useful and well known for their classification. It has an advantage of easy to understand the process of creating and displaying the results [1]. Given a data set of attributes together with its classes, a decision tree produces sequences of rules that can be used to recognize the classes for decision making. The Decision tree method has gained popularity due to its high accuracy of classifying the data set [2]. The most widely used algorithms for building a decision tree are ID3, C4.5 and CART.
This research has found that the CART algorithm performs better than ID3 and C4.5 algorithm, in terms of classifier accuracy. The advantage of CART algorithm is to look at all possible splits for all attributes. Once a best split is found, CART repeats the search process for each node, continuing the recursive process until further splitting is impossible or stopped, for that the CART algorithm has been used to improve the accuracy of classifying the data.
Educational Data Mining is an emerging field that can be applied to the field of education, it concerns with developing methods that discover knowledge from data originating from educational environments [3]. Decision tree algorithms can be used in educational field to understand performance of students [4].
The ability to obtain student’s performance is very important in educational environments. The student academic performance is influenced by many qualitative factors like Parent’s Qualification, Living Location, Economic Status, Family and Relation support and other factors. Educational data mining uses many techniques such as Decision Trees, Neural Networks, Naïve Bayes, K- Nearest neighbor and many others techniques. By applying these classification techniques useful hidden knowledge about student performance can be discovered [5].
The discovered knowledge can be used for finding the performance of students in a particular course, alienation of traditional classroom teaching model, detection of unfair means used in online examination, detection of abnormal values in the result sheets of the students, prediction about student’s performance and so on [3]. The aim of this research work is to find performance of decision tree algorithms as well as the influence of qualitative factors in student’s performance.
The rest of the paper is organized as follows, section 2 describes about literature survey on student’s performance using data mining techniques. Section 3 describes about decision tree algorithms, qualitative parameters, and computations used to form decision tree and section 4 describes about experimental design and section 5 describes about results with discussion and section 6 concludes the paper with future work.
-
II. LITERATURE SURVEY
82.52%. But when it is measured with the F-measure, it is found that the C4.5 algorithm is not appropriate for all data types, but Bayesian Belief Network Algorithm that yields accuracy of 82.4% [8].
This literature survey studies about the performance of classification algorithms based on student data. The working process for each algorithm is analyzed with the accuracy of classification algorithms. It also studies about various data mining techniques applied in finding the student academic performance.
(Aman and Suruchi, 2007) have conducted an experiment in WEKA environment by using four algorithms namely ID3, C4.5, Simple CART and alternating decision tree on the students dataset and later the four algorithms were compared in terms of classification accuracy. According to their simulation results, the C4.5 classifier outperforms the ID3, CART and AD Tree in terms of classification accuracy [6].
(Nguyen et al., 2007) presented an analysis on accurate prediction of academic performance of undergraduate and post graduate students of two very different academic institutes: Can Tho University (CTU), a large national university in Viet Nam and the Asian Institute of Technology (AIT), a small international postgraduate institute in Thailand. They have used different data mining tools to find the classification accuracy from Bayesian Networks and Decision tree. They have achieved the best prediction accuracy which is used to find the performance of students. The result of this study is very much useful in finding the best performing students to award with scholarship. The result of this research indicates that decision tree was consistently 3-12% more accurate than Bayesian Network [7].
(Sukonthip and Anorgnart , 2011) presented their study using data mining techniques to identify the bad behavior of students in vocational education, classified by algorithms such as Navie Bayes Classifier Bayesian Network, C4.5 and Ripper. Then it measures the performance of the classification algorithms using 10folds cross validation. It is showed that C4.5 algorithm for the hybrid model yields the highest accuracy of
(Brijesh and Saurabh, 2011) presented the analysis on the prediction of student academic performance using data mining techniques. The data set used in this study was obtained using sampling method from five different colleges of computer applications department of course BCA of session 2009-2010. By means of Bayesian classification method and its 17 attributes, it was found that the factors like student’s grade in senior secondary exam, living location, medium of teaching and students other habit were highly correlated with the student academic performance. They have identified the students who needed special attention to reduce the failing ratio and it helped to take appropriate actions at right time [9].
(Al-Radaideh et al., 2006), used a decision tree model to predict the final grade of students who studied the C++ course in yarmouk university, Jordan in the year 2005.Three different classification methods namely ID3,C4.5 and the NavieBayes are applied. The outcome of their results indicated that decision tree model had better prediction than other models [10].
(Brijesh and Saurabh, 2006) have conducted a study on student performance based on selecting a sample of 50 students from VBS Purvanchal university, Janpur(Uttar Pradesh) of computer application department of course MCA(Master of Computer Application) from session 2007 to 2010. They have investigated decision tree learning algorithm ID3 and information such as attendance, class test, seminar and assignments marks were collected from student’s to predict the performance at semester end. In this experimentation they found that the entropy of ID3 is used majorly to classify the data exactly [11].
(Bresfelean, 2007) worked on the data collected through the surveys from senior undergraduate students from the faculty of economics and business administrated in Cluj-Napoca. Decision tree algorithm in the WEKA tool, ID3 and J48 were applied and predicted the students who are likely to continue their education with the postgraduate degree. The model was applied on two different specialization student’s data and accuracy of 88.68% and 71.74% was achieved with C4.5 [12].
(Kov, 2010) presented a case study on educational data mining to identify up to what extent the enrollment data can be used to predict student’s success. The algorithm CHAID and CART were applied on student enrolment data of information system, students of open polytechnic from New Zealand uses two decision trees to classify successful and unsuccessful students. The accuracy obtained with CHAID and CART was 59.4 and 60.5 respectively [13].
(Abdeighani and Urthan, 2006) presented on analysis of the prediction of survivability rate of students using data mining techniques. They have investigated three data mining techniques: NavieBayes, Back Propagated
Neural Network and the C4.5 Decision tree algorithms and found that prediction accuracy of C4.5 is comparatively higher than other two algorithms [14].
In prior research, many authors have compared the accuracy of Decision Tree and Bayesian Network algorithms for predicting the academic performance student’s and finally they found that Decision Tree was consistently more accurate than the Bayesian Network. Most of them conducted experiment in WEKA environment by using different classification algorithms namely ID3, J48, Simple CART, Alternating Decision Tree, ZeroR, NavieBayes classification algorithms and most of the datasets are course recommendation dataset and student quantitative dataset. These classification algorithms were compared in terms of classification accuracy, effectiveness, and correction rate among them.
From the literature survey, student qualitative data have been analyzed using classification algorithms to know the student performance. But few researches have compared the performance of classification algorithms based on student quantitative data and there is no considerable work on comparison of decision tree algorithms with student qualitative data. This research focuses on comparison of decision tree algorithms in terms of classification accuracy which is based on student qualitative data. This research also analyzes the impact of qualitative parameters in student’s academic performance.
In this proposed research, three decision tree algorithms such as ID3, C4.5 and CART are compared using student’s qualitative data. This research also aims at to frame rule set, to predict the student’s performance using qualitative data.
-
III. DECISION TREE ALGORITHMS
A decision tree is a tree in which each branch node represents a choice between a number of alternatives, and each leaf node represents a decision [15]. Decision tree are commonly used for gaining information for the purpose of decision making [16]. Decision tree starts with a root node which is for users to take actions. From this node, users split each node recursively according to decision tree learning algorithm. The final result is a decision tree in which each branch represents a possible scenario of decision and its outcome. The three widely used decision tree learning algorithms are: ID3, C4.5 and CART. The various parameters used in these algorithms have been described in TABLE I.
The domain values for some of the variables are defined for the present investigation as follows.
ParQua - Parent’s Qualification are obtained. Here, the student’s parent Qualification is specified whether they are educated or uneducated.
LivLoc - Living Location is obtained. Living Location is divided into two classes: Rural – for student’s coming from rural areas, Urban – for student’s coming from urban areas.
Eco – Economical background is obtained. The student’s family income status is declared and it is divided into three classes. Low – below 25000 per year, Middle – above 50,000 and less than one lakh per year, High – above one lakh per year.
FRSup - Family and Relation Support is obtained (To find whether the student gets the moral support from family and relation for his studies). Family and Relation support is divided into three classes: Low – they did not get support from anyone, Middle – they only get support sometimes, High – they get full support from parent’s and as well as from relation.
Res – Resource (Internet/Library access) are obtained (To check whether the students are able to access the internet and library). Resources are divided into three classes. Low – they have not accessed the internet and library, Middle - sometimes they have accessed the resource, High – they have accessed the both internet and library regularly.
Att – Attendance of student. Minimum 70% of attendance is compulsory to attend the semester examination; special cases are considered for any genuine reason. Attendance is divided into three classes: low – below 50%, Middle - > 79% and < 69% , High – >80% and <100%.
Result – Results are obtained and it is declared as response variables. It is divided into four classes: Fail – below 40%, Second - >60% and <69, Third - >59% and < 50% and First – above 70%.
TABLE I. STUDENT QUALITATIVE DATA AND ITS VARIABLES
|
Variable |
Descriptio n |
Possible Values |
|
ParQua |
Parent’s Qualificati on |
{Educated,Uneducated} |
|
Livloc |
Living Location |
{Urban,Rural} |
|
Eco |
Economic Status |
{High,Middle,Low} |
|
FRSupp |
Friends and Relative Support |
{High,Middle,Low} |
|
Res |
Resource Accessibil ity |
{High,Middle,Low} |
|
Att |
Attendanc e |
{High,Middle,Low} |
|
Result |
Result |
{First,Second,Third,Fail} |
A. ID3 Decision Tree
ID3 is a simple decision tree learning algorithm developed by Ross Quinlan [16]. The basic idea of ID3 algorithm is to construct the decision tree by employing a top-down, greedy search through the given sets to test each attribute at every tree node, in order to select the attribute which is most useful for classifying a given sets. A statistical property called information gain is defined to measure the worth of the attribute.
-
a) Measuring Impurity
Given a data table that contains attributes and class of the attributes, we can measure homogeneity (or heterogeneity) of the table based on the classes. If a table is pure or homogenous, it contains only a single class. If a data table contains several classes, then it says that the table is impure or heterogeneous. To measure the degree of impurity or entropy,
Entropy = 2 -Рlog2 P (1)
Entropy of a pure table (consist of single class) is zero because the probability is 1 and log (1) = 0. Entropy reaches maximum value when all classes in the table have equal probability.
To work out the information gain for A relative to S , it first need to calculate the entropy of S . Here S is a set of 120 instances are 70 “ First ”, 19 “ Second ”, 15 “ Third ” and 16 “ Fail ”.
Entropy(S) = -Рirstlog2 (P irst)-Рsecondlog2 (P second)
-Рthirdlog2 (P zhird)
-Рtaillog2 (P 'ail) (2)
= - (70/120) log 2(70/120) - (19/120) log
2(19/120) - (15/120) log 2(15/120) – (16/120) log 2(16/120)
-
b) Entropy (S) = 1.6372
Gain(S, A) = Entropy(S)
|SV|
-
- > | | Entropy(S V ) (3)
|S|
V€ Values (A)
Information gain is calculated to all the attributes. Table II describes the information gain of all the attributes of qualitative parameters.
TABLE II: INFORMATION GAIN VALUES OF STUDENT QUALITATIVE PARAMETERS
|
Gain |
Values |
|
Gain(S,ParQua) |
0.1668 |
|
Gain(S,LivLoc) |
0.4988 |
|
Gain(S,Eco) |
0.0920 |
|
Gain(S,FRSup) |
0.0672 |
|
Gain(S,Res) |
0.1412 |
|
Gain(S,Att) |
0.0402 |
From the Table 2, ParQua has the highest gain, therefore it is used as the root node as depicted in Fig.1
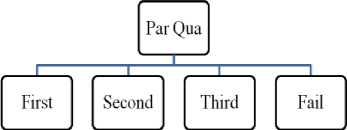
Figure1. A root node for a given student qualitative data
-
c) The procedure to build a decision tree
From the result of the calculations, the attribute ParQua is used to expand the tree. Then delete the attribute ParQua of the samples in these sub-nodes and compute the Entropy and the Information Gain to expand the tree using the attribute with the highest gain value. Repeat this process until the Entropy of the node equals null. At that moment, the node cannot be expanded anymore because the samples in this node belong to the same class.
-
B. C4.5 DECISION TREE
C4.5 algorithm [17] is a successor of ID3 that uses gain ratio as splitting criterion to partition the data set. The algorithm applies a kind of normalization to information gain using a “split information” value.
-
a) Measuring Impurity - Splitting Criteria
To determine the best attribute for a particular node in the tree it use the measure called Information Gain. The information gain, Gain (S, A) of an attribute A, relative to a collection of examples S, is defined as
Gain(S, A) = Entropy(S)
|SV|
-
- ) | | Entropy(SV ) (4)
|S|
-
V€ Values(A)
Where Values (A) is the set of all possible values for attribute A, and Sv is the subset of S for which attribute A has value v (i.e., Sv = {s € S | A(s) = v}). The first term in the equation for Gain is just the entropy of the original collection S and the second term is the expected value of the entropy after S is partitioned using attribute A. The expected entropy described by this second term is simply the sum of the entropies of each subset weighted by the fraction of examples | S | / | S | that belong to Gain (S, A) is therefore the expected reduction in entropy caused by knowing the value of attribute A[18].
n
Split Information(S, A) = - У |S |log 2|S| |S||S|
1=1
and
Gain Ratio(S, A) = Gain Ratio (^ , ^(5)
( ,)
The process of selecting a new attribute and partitioning the training examples is now repeated for each non terminal descendant node. Attributes that have been incorporated higher in the tree are excluded, so that any given attribute can appear at most once along any path through the tree. This process continues for each new leaf node until either of two conditions is met:
-
1. Every attribute has already been included along this path through the tree, or
-
2. The training examples associated with this leaf node all have the same target attribute value (i.e., their entropy is zero).
Gain Ratio can be used for attribute selection, before calculating Gain ratio Split Information should be calculated which is shown in Table 3.
TABLE III: SPLIT INFORMATION FOR C4.5
|
Split Information |
Value |
|
Split(S,ParQua) |
1.4704 |
|
Split(S,LivLoc) |
-2.136 |
|
Split(S,Eco) |
1.872 |
|
Split(S,FRSup) |
1.57 |
|
Split(S,Res) |
1.496 |
|
Split(S,Att) |
1.597 |
The Gain Ratio is shown in TABLE IV, from this table ParQua has the highest gain ratio, and therefore it is used as the root node. The decision tree which we constructed for ID3 and C 4.5 resembles the same structure as we depicted in Fig. 1. Then information gain is calculated which is described in TABLE IV.
TABLE IV: GAIN RATIO FOR C4.5
|
Split Information |
Value |
|
GainRatio(S,ParQua) |
0.1134 |
|
GainRatio(S,LivLoc) |
-0.2194 |
|
GainRatio(S,Eco) |
0.0491 |
|
GainRatio(S,FRSup) |
0.043 |
|
GainRatio(S,Res) |
0.0944 |
|
GainRatio(S,Att) |
0.0252 |
The Gain Ratio is shown in TABLE IV, from this table ParQua has the highest gain ratio, therefore it is used as the root node as shown in Fig. 1. Once it finds the optimum attribute and its split the data table according to that optimum attribute. In our sample data C4.5 split the data table based on the value of ParQua.
-
b) Procedure to build a decision tree
Take the original samples as the root of the decision tree. As the result of the calculation, the attribute ParQua is used to expand the tree. Then delete the attribute ParQua of the samples in these sub-nodes and compute split information to split the tree using the attribute with highest gain ratio value. This process continuous on until all data are classified perfectly or run out of attributes. Repeat this process until the Entropy of the node equals null. At that moment, the node cannot be expanded anymore because the samples in this node belong to the same class.
-
C. CART DECISION TREE
CART [2] stands for Classification and Regression Trees introduced by Brieman. It is also based on Hunt’s algorithm. CART handles both categorical and continuous attributes to build a decision tree. It handles missing values.
CART uses Gini Index as an attribute selection measure to build a decision tree. Unlike ID3 and C4.5 algorithms, CART produces binary splits. Gini Index measure does not use probabilistic assumptions like ID3, C4.5. CART uses cost complexity pruning to remove the unreliable branches from the decision tree to improve the accuracy.
-
a) Measuring Impurity
To measure degree of impurity are Gini Index that are defined as
Gini(T) = 1 - ∑jtl P2 (6)
Gini Index of a pure table consist of single class is zero because the probability is 1 and 1-12= 0.Similar to Entropy, Gini Index also reaches maximum value when all classes in the table have equal probability. To work out the information gain for A relative to S, first it needs to calculate the Gini Index of S. Here S is a set of 120 examples are 70 “ First ”, 19 “ Second ”, 15 “ Third ” and 16 “ Fail ”.
Gini Index (S) = 1 - P■irstlog2 (P ■irst)-
Psecondlog2 (P second)- Pthirdlog2 (P third) (7)
To determine the best attribute for a particular node information gain is calculated. The information gain is defined as,
Ptaillog2 (P tail)=
1 – (0.5833^2+0.1583^2+0.125^2+0.133^2)
-
b) Gini Index(S) = 0. 6015
IG (f) = ∑El fi (1 - fi)=∑™1(fi-fi2) =∑Ei fi-i=1mfi2=1-i=1mfi2 (8)
TABLE V. GAIN VALUES FOR CART
|
Gain |
Values |
|
Gain(S,ParQua) |
0.064 |
|
Gain(S,LivLoc) |
0.0402 |
|
Gain(S,Eco) |
0.0371 |
|
Gain(S,FRSup) |
0.0233 |
|
Gain(S,Res) |
0.1337 |
|
Gain(S,Att) |
0.0089 |
From the TABLE V. ParQua has the highest gain, therefore it is used as the root node as shown in Fig. 1 a) Procedure to build a decision tree
Gini Index and information gain is calculated for all the nodes. As the result of the calculation, the attribute ParQua is used to expand the tree. Then delete the attribute ParQua of the samples in these sub-nodes and compute the Gini Index and the Information Gain to expand the tree using the attribute with highest gain value. Repeat this process until the Entropy of the node equals null. At that moment, the node cannot be expanded anymore because the samples in this node belong to the same class.
-
IV. EXPERIMENTAL DESIGN
To conduct this experiment we have selected WEKA 3.6.6 [19]. For data collection we have collected qualitative data such as parent’s Qualification, living location, economic status, family and relation support, resource accessibility, etc., from under graduate students of various disciplines and 10-fold cross validation is applied.
When ID3 algorithm is applied, 60 instances are correctly classified and 57 instances are misclassified (i.e. for which an incorrect prediction was made) and 3 instances are unclassified. Since 57 instances are misclassified, 3 instances are unclassified the ID3 algorithm does not obtain higher accuracy. The graph which is depicted in Fig. 2 shows the difference between correctly classified and incorrectly classified instance.
From Table VI, it is found that based on these three algorithms the C4.5 yields the highest accuracy of 54.17% compared to ID3 algorithm. But the CART algorithm yields the highest accuracy of 55.83% when compared with other two algorithms. C4.5 algorithm also yields acceptable level of accuracy. The visualization of generated decision tree is depicted in Fig. 3.
-
V. RESULTS AND DISCUSSIONS
TABLE VI, describes the classification accuracy of ID3, C4.5 and CART algorithms when we applied on the collected student data sets using 10-fold cross validation is observed as follows,
TABLE VI: DECISION TREE CLASSIFIER ACCURACY
|
Decision Tree Algorithms |
Correctly Classified Instances |
Incorrectly Classified Instances |
Unclassified Classified Instances |
|
ID3 |
50% |
47.5% |
2.50% |
|
C4.5 |
54.17% |
45.83% |
0% |
|
CART |
55.83% |
44.17% |
0% |
60%
(Л ф и 50% га to 40%
30%
ф
^ 20%
<л го 10%
о
0%
50% 54.17% 55.83%
17%
Correctly Classified Instances
Incorrectly
Classified
Instances
ID3 C4.5 CART
Decision Tree Algorithms
Figure 2. Comparisons of Classifiers with its classification instances
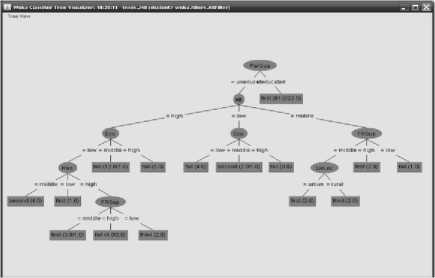
Figure 3. Visualization of generated decision Tree
The prioritization of the student’s qualitative parameters using decision tree have been visualized in Fig. 3. Parent’s qualification is taken as root node from which economy and friends support taken as branch node and so on. The knowledge represented by decision tree can be extracted and represented in the form of IF-THEN rules.
-
(1) IF ParQua = “Uneducated AND Att=”High” AND Eco = “Low” And Res=”Low”THEN Result =
“ First”
-
(2) IF ParQua = “Uneducated AND Att=”High” AND Eco = “Low” And Res = “High” And FRSup=Middle THEN Result = “ First”
-
(3) IF ParQua = “Uneducated AND Att=”Middle” AND FRSup=”Middle” AND LivLoc=”Urban” THEN Result = “ First”
-
(4) IF ParQua = “Uneducated AND Att=”Middle” AND Eco=“Low” AND FRSup=”High “THEN Result = “ First”
-
(5) IF ParQua = “Uneducated AND Att=”High” AND Eco=“Low”AND Res=”Middle” THEN Result =
“ Second”
-
(6) IF ParQua = “Uneducated AND Att=”Low” AND Eco=“Middle” THEN Result = “ Second”
-
(7) IF ParQua = “Uneducated AND Att=”High” AND Eco=“Low” AND Res=”High” AND FRSup=”Low “ THEN Result = “ Third”
-
(8) IF ParQua = “Uneducated AND Att=”High” AND Eco=“Low” AND Res=”High” FRSup=”High “THEN Result = “ Fail”
-
(9) IF ParQua = “Uneducated AND Att=”Low” AND Eco=”Low” THEN Result = “ Fail”
-
(10) IF ParQua = “Uneducated AND Att=”Middle” AND Res=”High”AND FRSup=”Low“ THEN Result = “ Fail”
-
(11) IF ParQua = ”Educated” THEN Result=”First”
Rule set generated by decision trees
From the above set of rules it was found that the Parent Qualification is significantly related with student performance. From the result obtained, 49% of students were First class whose parents were educated and 17% of students have not obtained First class whose parents were uneducated. So it is analyzed from the result that, 17% of student performance has not been improved to expected level due to uneducated parents. But in some rare cases parents education does not affect the performance of the students.
From the above rule set it was found that, Economic Status, Family and Relation Support, and other factors are of high potential variable that affect student’s performance for obtaining good performance in examination result. The Confusion matrix is more commonly named as Contingency Table. TABLE VII shows four classes and therefore it forms 4x4 confusion matrix, the number of correctly classified instances is the sum of diagonals in the matrix (49+3+3+5=60); remaining all are incorrectly classified instances.
-
TABLE VII. CONFUSION MATRIX FOR ID3 ALGORITHM
Result
ID3
First
Second
Third
Fail
Actual
Class
First
49
10
6
4
Second
11
3
0
4
Third
6
1
3
5
Fail
4
3
3
5
In this confusion matrix, the True Positive (TP) rate is the proportion of 120 instances which are classified as classes First, Second, Third and Fail. Among all instances how many instances are correctly classified and wrongly classified as First, Second, Third and Fail is captured by confusion matrix. Misclassifying correct instance into wrong instance is called as True Positive (TP). The False Positive (FP) rate is the proportion of 120 instances which are classified as classes First, Second, Third and Fail, but belong to different classes. False Positive rate is described in TABLE VIII.
-
TABLE VIII. CLASS WISE ACCURACY FOR ID3 ALGORITHM
Class Label
TP Rate
FP Rate
First
0.71
0.438
Second
0.167
0.141
Third
0.2
0.25
Fail
0.333
0.278
According to ID3 algorithm, it is understood that the confusion matrix of the true positive rate of this algorithm for the class ‘ First ’ yields higher ( 0.71 ) than the other three classes. That means, the algorithm is successfully classified and identified, the students who have obtained class ‘First’ in the examination result.
-
TABLE IX. CONFUSION MATRIX FOR C4.5 ALGORITHM
Result
C4.5
Firs t
Secon d
Thir d
Fai l
Actua l Class
First
58
3
6
3
Secon d
15
2
0
2
Third
10
1
0
4
Fail
7
2
2
5
TABLE IX describes about four classes and therefore it forms 4x4 confusion matrix, the number of correctly classified instances is the sum of diagonals in the matrix (58+2+0+5=65); remaining all are incorrectly classified instances.
-
TABLE X. CLASS WISE ACCURACY FOR C4.5 ALGORITHM
Class Label
TP Rate
FP Rate
First
0.829
0.64
Second
0.105
0.059
Third
0
0.076
Fail
0.313
0.087
According to C4.5 algorithm , it is clear from the confusion matrix of the true positive rate of this algorithm for the class ‘First’ yields higher (0.829 ) than the other three classes. It means, the algorithm is successfully classified and identified, the students who have obtained class ‘First’ in the examination result.
TABLE XIII. COMPARISON OF CLASS ACCURACY FOR DECISION TREE ALGORITHMS
|
Decision Tree Algorithm |
TP Rate |
FP Rate |
|
ID3 |
0.71 |
0.438 |
|
C4.5 |
0.829 |
0.64 |
|
CART |
0.914 |
0.76 |
These three algorithms is compared based on the classification accuracy and TP rate. In this comparison the TP rate of CART is 0.914 and the class is ‘FIRST’ and it yields highest accuracy of 55.83% the other two decision tree algorithms. The TP rate of C4.5 algorithm is 0.829 and the class is ‘ FIRST’ and it yields classification accuracy of 54.17% than the ID3 algorithm. The comparative analysis of classes, the accuracy of decision tree algorithms is depicted in a figure which is depicted in Fig. 4.
TABLE XI. CONFUSION MATRIX FOR CART ALGORITHM
|
Result |
CART |
||||
|
First |
Second |
Third |
Fail |
||
|
Actual Class |
First |
64 |
1 |
5 |
0 |
|
Second |
16 |
1 |
0 |
2 |
|
|
Third |
1 |
4 |
10 |
0 |
|
|
Fail |
10 |
0 |
1 |
4 |
|
Table 11 describes four classes and therefore it forms 4x4 confusion matrix, the number of correctly classified instances is the sum of diagonals in the matrix (64+1+10+4=65); remaining all are incorrectly classified instances. The class wise accuracy for CART is described in TABLE XII.
ф ш с го се с о го
го
TABLE XII. CLASS WISE ACCURACY FOR CART ALGORITHM
|
Class Label |
TP Rate |
FP Rate |
|
First |
0.914 |
0.76 |
|
Second |
0.053 |
0.01 |
|
Third |
0.067 |
0.095 |
|
Fail |
0.063 |
0.038 |
According to CART algorithm, it is known that the confusion matrix of the true positive rate of this algorithm for the class ‘ First’ yields higher (0.914 ) than the other three classes. That means, the algorithm is successfully classified and identified the students who have obtained class ‘First’ in the examination result. The comparison of class accuracy of decision tree algorithms is described in TABLE XIII.
Class of Accuracy for Decision Tree Algorithms
0.5
уд
ID3 C4.5 CART TP
TP Rate
FP Rate
0.71
0.438
0.829
0.64
0.914
0.76
TP
Rate
Decision Tree Algorithms
Figure 4. Class of Accuracy on TP and FP Rate
From the experimental results and the analysis of decision tree, the classification accuracy and class of accuracy of CART algorithm is considered to be best when it compared to other decision tree algorithms. This comparative analysis also identified the influence of qualitative parameters in student education performance.
VI. CONCLUSION
This research work compares the performance of ID3, C4.5 and CART algorithms. A study was conducted with student’s qualitative data to know the influence of qualitative data in student’s performance using decision tree algorithms. The experimentation result shows that the CART has the best classification accuracy when compared to ID3 and C4.5. This experimentation significance also concludes that student’s performance in examinations and other activities are affected by qualitative factors. In future, the most influencing qualitative factors that affect student’s performance can be identified using genetic algorithms.
References An Analysis on Performance of Decision Tree Algorithms using Student’s Qualitative Data
- Pornnapadol, "Children who have learning disabilities", Child and Adolescent Psychiatric Bulletin Club of Thailand, October-December, 2004, pp.47-48.
- B.Nithyassik, Nandhini, Dr.E.Chandra, “Classification Techniques in Education Domain”, International Journal on Computer Science and Engineering, 2010, Vol. 2, No.5, pp.1647-1684.
- Jiawei Han and Micheline Kamber, "Data Mining: Concepts and Techniques", 2nd ed., Morgan Kaufmann Publishers, 2006.
- M. El-Halees, "Mining Student Data to Analyze Learning Behavior: A Case Study". In Proceedings of the 2008 International Arab Conference of Information Technology (ACIT2008), University of Sfax, Tunisia, Dec 15- 18
- U. M. Fayyad, G. Piatetsky-Shapiro, P. Smyth, and R.Uthurusamy, “Advances in Knowledge Discovery and Data Mining”, AAAI/MIT Press, 1996.
- Aman Kumar Sharma, Suruchi Sahni, ” A Comparative Study of Classification Algorithms for Spam Email Data Analysis”, International Journal on Computer Science and Engineering, May 2011 ,Vol. 3 No. 5 ,pp 1890-1895.
- Nguyen Thai Nghe; Janecek, P.; Haddawy, P., "A comparative analysis of techniques for predicting academic performance”, Frontiers In Education Conference - Global Engineering: Knowledge Without Borders, Opportunities Without Passports, 2007. FIE '07. 37th Annual , pp.T2G-7,T2G-12, Oct. 2007
- S.Wongpun, A. Srivihok, "Comparison of attribute selection techniques and algorithms in classifying bad behaviors of vocational education students", Digital Ecosystems and Technologies,2nd IEEE International Conference on , pp.526,531, Feb. 2008
- B.K Bharadwaj, S.Pal, “Mining Educational data to Analyze student’s performance” , International Journal of Computer Science and Applications, 2011, Vol.2, No.6, pp 63-69.
- A.L.Radaideh, Q.A.AI-Shawakfa, E.M. AI-Najjar, “Mining student data using Decision Tree” International Arab Conference on Information Technology (ACIT 2006),Yarmouk University, 2006.
- Sunita B.Aher, L.M.R.J. lobo, “A Comparative study of classification algorithms”, International Journal of Information Technology and Knowledge Management, July-December 2012, Volume 5, N0.2, pp 239-243.
- V.P Bresfelean, “Analysis and predictions on student’s behavior using decision trees in WEKA environment”, Proceedings of the ITI 2007 29thInternational Conference on Information Technology Interfaces, 2007 , June 25-28 .
- Z.J.Kovacic.; "Early prediction of student success: Mining student enrollment data", Proceedings of Informing Science and IT Educational Conference, 2010,pp 648-665.
- A Bellaachia, E Guven, “Predicting the student performance using Data Mining Techniques”, International Journal of Computer Applications, 2006, Vol.6.
- Margret H. Dunham, “Data Mining: Introductory and advance topic”, Pearson Education India, 2006.
- J.R.Quinlan, “Induction of Decision Tree”, Journal of Machine learning”, Morgan Kaufmann Vol.1, 1986, pp.81-106.
- J.R.Quinlan, “C4.5: Programs for Machine Learning”, Morgan Kaufmann Publishers, Inc, 1992.
- J. Quinlan, “Learning decision tree classifiers”. ACM Computing Surveys (CSUR), 28(1):71–72, 1996.
- WEKA, University of Waikato, New Zealand, http://www.cs.waikato.ac.nz/ml/weka/ (accessed July 18 , 2012)
- B.k. Bhardwaj, S.PAL,” Data Mining: A prediction for performance improvement using classification”, International journal of Computer Science and Information Security, April 2011, Vol.9, No.4, pp 136-140.
- Surjeet Kumar Yadav, Brijesh Bharadwaj, Saurabh Pal, “A Data Mining Application: A Comparative study for predicting student’s performance”, International Journal of Innovative Technology and Creative Engineering, Vol.1 No.12 (2011) 13-19
- G Stasis, A.C. Loukis, E.N. Pavlopoulos, S.A. Koutsouris, “Using decision tree Algorithms as a basis for a heart sound diagnosis decision support system”, Information Technology Applications in Biomedicine, 4th International IEEE EMBS Special Topic Conference, April 2003.
- M.J. Berry, G.S. Linoff, “Data Mining Techniques: For Marketing Sales and Customer Relationship Management”, Wiley Publishing, 2004.
- S.Anupama Kumar, M.N.Vijayalakshmi, "Prediction of the students recital using classification technique ", International journal of computing , Volume 1, Issue 3 July 2011,pp305-309.
