An Application of the Wiles Test in the Formulation of Education Strategy for the Newly-Upgraded Colleges of China

Author: Xiaowen Zhu, Zhiwen Zhu
Journal: International Journal of Modern Education and Computer Science (IJMECS) @ijmecs
Article in issue: 2 vol.3, 2011.
Free access
Using graduates from the newly-upgraded colleges as a sample, we used the Wiles test on the Human Capital Hypothesis vs. the Screening Hypothesis of education economics. The results were in favor of the former, i.e., higher education was more likely a production means than just a signal in the job market. Thus the newly-upgraded colleges should adjust their curriculum and faculty structure to accommodate the skill demands in job markets.
Human Capital Hypothesis, Screening Hypothesis, Wiles test, job match, newly-upgraded colleges
Short address: https://sciup.org/15010068
IDR: 15010068
Text of the scientific article An Application of the Wiles Test in the Formulation of Education Strategy for the Newly-Upgraded Colleges of China
Published Online April 2011 in MECS
The Human Capital Hypothesis and the Screening Hypothesis were two contending hypothesis being used to explain the positive effect of the education level on individual income in the field of education economics. According to the Human Capital Hypothesis, individuals invest their human capital via education, learning, training or working, which improves their productivities and hence enable them to acquire higher return in the labor market [1]. However, the Screening Hypothesis contends that employers use education as a productivity signal, which screens job applicants in the labor market with asymmetric information [2].
Wiles designed a method to test the two contending hypothesis. The idea of Wiles test is: if the income difference were not significant between the graduate with a job matched with his field of study and the graduate with a job unmatched with his field of study, the Screening Hypothesis were to be supported; otherwise, the Human Capital Hypothesis were to be supported [3]. The Wiles test has been replicated many times with different samples since 1974; however, the results are still inconclusive, for instance, in [4] and [5] versus [6].
This paper will reexamine the Wiles test by using a sample of graduates of China’s newly-upgraded colleges (NUCs). Most NUCs were established by merging and upgrading several three-year higher vocational schools since Chinese Government launched an extensive expansion of higher education in 1999. Because these schools used to emphasize the training of occupational and application skills, after upgrading to undergraduatelevel, they are faced with the question whether strategically transforming to emphasize the general education and the trainings of academic skills [7].
At this point, conducting a Wiles test on graduates of NUCs would be instructive to answer this question. Obviously, if the results of Wiles test support the Human Capital Hypothesis, the NUCs should maintain their previous education strategy. Otherwise, if the results support the Screening Hypothesis, they should change their education strategy after upgrading.
-
II. Conceptual Framework
-
A. The Expansion of Higher Education and the Emergence of the Newly-upgraded Colleges
In 1994, China planned to conduct a national evaluation of its universities. The results of this evaluation were used to support the major planned policy initiative, which resulted in a renewed emphasis on elite institutions as well as the “massification” of higher education [8]. Academics praised the reforms for budging China's higher education from a unified, centralized, closed and static system into one characterized by more diversification, decentralization, openness and dynamism, and stimulating the involvement of local governments and other non-state sectors. At the same time they also note that this decentralization and marketization has led to further inequality in educational opportunity [9].
On one hand, there was a general tendency to emphasize elite institutions. A project for creating 100 world class universities began in 1993, which has merged 708 schools of higher learning into 302 universities. Restructuring, through consolidations, mergers and shifts among the authorities which supervise institutions was aimed at addressing the problems of small size and low efficiency. Merging schools of higher learning has produced far-reaching reform of higher education management, optimizing of educational resources allocation, and further improving teaching quality and school standards. More than 30 universities have received help from a special national fund to support their attainment of world elite class [10].
On the other hand, the Chinese government strived to massify higher education. In 1998 the Chinese government proposed expand college and university enrollment. By the end of 2004, China had 2,236 schools of Higher Learning, with over 20 million students; the gross rate of enrollment in schools of higher learning reached 19 percent. Postgraduate education is the fastest growing sector, with 24.1 percent more students recruited and 25.9 percent more researchers than the year before. This enrollment growth indicates that China has entered a stage of popular education [10]. The UNESCO world higher education report of June 2003 pointed out that the student population of Chinese schools of higher learning had doubled in a very short period of time, and was the world's largest [11].
However, most elite institutions did not expand enrollment extensively in order to ensure their teaching quality. For example, the total admission of undergraduate of Peking University increased by 40%, mildly from 2430 to 3280 between 1998 and 2010 [12]. In this case, higher vocational education was also restructured to accommodate the vast majority of expansion of enrollment. Many new undergraduate-level colleges (i.e.
the newly-upgraded colleges, NUCs) were established, typically by merging and consolidating several higher vocational schools, whereas the creation of private universities, not under governmental control, remains slow and its future uncertain. By April 2010, there were nearly 240 NUCs in China, accounting for 31.3% of the total number of regular undergraduate-level colleges and universities [13].
The restructuring of higher education, in the words of one academic "has created a clearly escalating social stratification pattern among institutions, stratified by geography, source of funding, administrative unit, as well as by functional category (e.g., comprehensive, law, medical, etc.) " [14]. Thus, although recent reform has arguably improved over-all educational quality, they have created new, different issues of equity and efficiency that will need to be addressed as the century proceeds.
-
B. The Debate on Education Strategy for the Newly-upgraded colleges: Match or Adapt the Job Market?
The rapid expansion of mass higher education has resulted in not only a strain in teaching resources but also in higher unemployment rates among graduates. Between 1998 and 2009, the total enrollment and graduate in regular schools of higher learning increased respectively from 1.15 and 0.88 million to 6.91 and 5.68 million, in contrast with that new jobs created in urban units increased moderately from 4.95 million to 6.69 million (see Fig. 1).
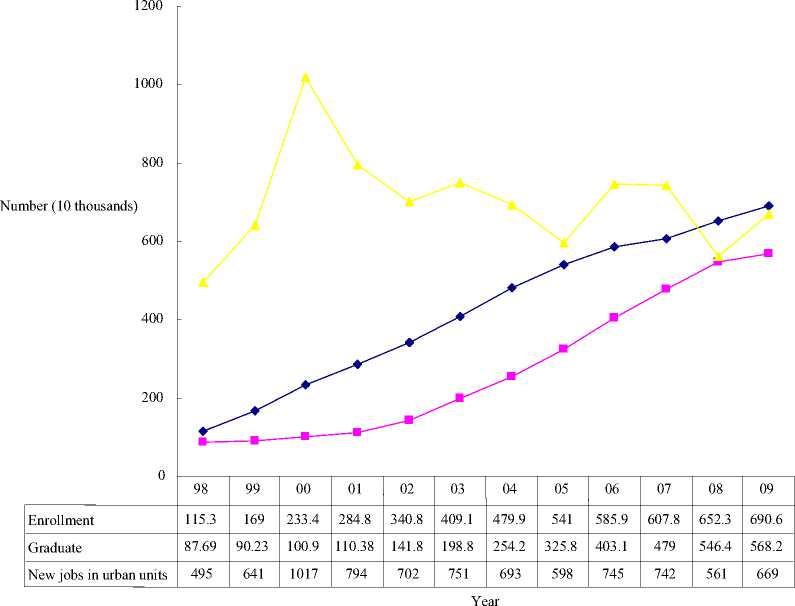
♦— Enrollment
—■— Graduate
New jobs in urban units
Figure 1. Enrollment, graduate of regular universities and colleges and new jobs in urban units of China between 1998 and 2009.
Source: National statistical database of China, http://219.235.129.58/
So far, the job market for graduates has changed gradually from a seller’s market to a buyer’s market. This change incited the heated debate among Chinese researchers of higher education about the relationship between the education strategy of NUCs and the job market. Some researchers proposed that these NUCs should “upgrade to undergraduate-level in essence” ( nei han sheng ben ), as most NUCs were established by merging and upgrading several three-year higher vocational schools, which used to emphasize the trainings of occupational and application skills [15]. According to these researchers, NUCs should change their strategy orientation from occupational and application education to general and academic education; graduates from NUCs should be able to adapt instead of match the skill demands in the job market. On the contrary, some other researchers argued that NUCs should not change their occupational and application orientation so as to match the skill demands at the job market quickly and thus enhance their graduates’ employability [7]. Otherwise, compared with graduates of those elite institutions, graduates of NUCs would be in disadvantage at the job market.
The Wiles test would be instructive to resolve this debate. According to the logic of Wiles test, if the signals function be the dominant function of education, then whether the specialty of a graduate matches his job would not affect his starting salary. This means that whether having certain specialized skills is not so important for graduates’ employability. Considering the other benefits (e.g., improvement of graduates’ overall quality) brought by the general education, NUCs should try to adjust their strategy to general education, to provide students with more complete knowledge structure and a more solid knowledge base, in particular, to focus on training students to identify, analyze and solve problems, to help students develop a broader view, and strive to educate students with wide caliber and higher adaptability.
Conversely, if the productions function be the dominant function of education, then whether the specialty of a graduate matches his job would affect his starting salary. This implies that whether having certain expertise needed by employers is important for graduates’ employability. Thus NUCs should maintain their strategy of vocational education, continue their "match" type of training policy, emphasize on the "employment-oriented" and "educate to order" policy, and adjust the curriculum, faculty structure in accordance with the demands at job market.
Ш. Research Design
-
A. Data and Samples
We undertook a survey of graduates’ seeking jobs in 6 NUCs at Jiangsu Province of China in June, 2010. The employment status of graduates is classified into nine types: (1) those who have signed a job contract, (2) those who are waiting to sign a job contract, (3) those who plan to be self-employed or start their own business, (4) those who will continue their study, (5) those who plan not to find jobs after graduation, (6) those who are waiting for employer’s final confirmation, (7) those who have tried
but cannot find any job, (8) those who have found some unsatisfactory job and will not accept it, and (9) others. By the end of June 2010, a total of 2572 valid questionnaires had been collected.
-
B. Variables and Measures
-
1) Dependent variable: Income was used as the dependent variable, which was measured by the respondent’s self-reported starting monthly salary.
-
2) Explanatory variable: Job match index was used as the explanatory variable, which indicates the extent of a job matching with the respondent’s field of study. In this study, an index was measured based on the work of Richards in which respondents were asked to report whether their current occupation was matched with their qualifications in terms of status and pay, usefulness of the skills acquired in their academic work, and the relationship between their job and the field of study [16]. A five point scale was used as follows: 1– much unmatched with, 2 – unmatched with, 3 – uncertain, 4 – matched with, 5 – much matched with. A dummy variable was used with 1 indicating the scale point equals 3, 4 or 5 and 0 indicating the scale point equals 1 or 2.
-
3) Control variables:
-
a) Major field of study: We divided majors using Biglan’s typology of academic fields [17]. Categories introduced included soft-pure (e.g. literature, history), soft-applied (e.g. economics, management), hard-pure (e.g. physics, chemistry) and hard-applied (e.g. computer science, electronics, mechanical engineering).
-
b) Gender: Respondents were divided into two groups, male and female, according to their gender.
-
c) Enrollment type: A dummy variable was used with 1 indicating state planning and 0 indicating non-state planning.
-
d) Family habitation: A dummy variable was used with 1 indicating urban area and 0 indicating rural area.
-
e) Family income: A dummy variable was used with 1 indicating high income (annual income ^ 50000 yuan) and 0 indicating low income (annual income < 50000 yuan).
-
f) Family social connections: A dummy variable was used with 1 indicating “extensive” or “very extensive” and 0 indicating “ordinary”, “few” or “very few”.
-
g) Parents’ education level: A dummy variable was used with 1 indicating high education level (either of parents is over senior high school level) and 0 indicating low education level (both of parents are under college level).
-
h) Self-esteem: A five point scale based on Rosenberg was designed to measure self-esteem [18]. A dummy variable was used with 1 indicating high selfesteem (average point ^ 2.5) and 0 indicating low selfesteem (average point < 2.5).
-
i) Academic record: A dummy variable was used with 1 indicating excellent academic record (grade point average ranking at the top 25%) and 0 indicating ordinary
or bad academic record (grade point average ranking below the top 25%).
-
j) College English Test: A dummy variable was used with 1 indicating possessing and 0 indicating not possessing a band 6 certificate of College English Test.
-
k) Occupational skills certificate: A dummy variable was used with 1 indicating possessing at least one and 0 indicating not possessing any occupational skills certificate.
-
l) CCP member: A dummy variable was used with 1 indicating being and 0 indicating not being a CCP member.
-
m) Student leader: A dummy variable was used with 1 indicating having been and 0 indicating having not been a student leader.
-
n) Practice or internship: A dummy variable was used with 1 indicating having and 0 indicating not having practice or internship experiences.
-
o) Employment area: A dummy variable was used with 1 indicating developed areas and 0 indicating developing areas.
-
p) Employment place: A dummy variable was used with 1 indicating large and medium-sized cities and 0 indicating county seats, villages and towns.
-
q) Public/private employment: A dummy variable was used with 1 indicating public employment (including state-owned enterprises, government sponsored institutions and government agencies) and 0 indicating private employment (including private enterprises, township and village enterprises and contractual joint ventures).
-
r) Job seeking times: The frequency of a respondent submiting his/her resume.
-
s) Job seeking expenses: The money (thousand yuan) a graduate paid for finding his/her job.
-
t) Job information sources: Four dummy variables were used: (1) Source-from-college , with 1 indicating obtaining job informations from colleges, (2) Source-from-internet , with 1 indicating obtaining job informations from internet, (3) Source-from-relations , with 1 indicating obtaining job informations from relatives or friends, (4) Other-sources , with 1 indicating obtaining job informations from sources other than above. Other-sources was used as the reference dummy variable.
-
C. Model
A semi-logarithmic regression model was developed for parameter estimation as follow ln (y) = α + βx + φ'κ + ε (1)
Where y stands for the explained variable ( Income ), x the explanatory variable ( Job match index ), α the constant term, s the disturbance term, в the regression coefficient of the explanatory variable, which is also the parameter mostly concerned in this study. κ is a vector of control variables and φ is the vector of regression coefficients for these control variables.
Major field of study and Gender did not enter (1) as control variables directly; nevertheless, they are used as two grouping variables for the convenience of comparisons between different majors or genders.
W. Results
-
A. Descriptive Statistics
From Tab. I , one can see that by the end of June 2010, 68.5% of the full sample cases had confirmed their employment future (Type 1~5), while 50.9% of full sample cases had gotten a job offer (Type 1~2). However, 31.5% of the full sample cases had still not confirmed their likely job situation (Type 6~9), while 18.3% of them had failed to find any job (Type 7). Some graduates, 1.7%, had gotten an offer, but were not satisfied and would therefore not accept it (Type 8). The key point is that the percentage of those who had not yet confirmed their employment future is rather high. It means that approximately 1/3 of graduates of NUCs would be unemployment soon after graduation.
Tab. II shows the percentage of students having gotten an offer and average expected starting monthly salary of graduates by fields of study, sex and job match index. The percentage for soft-pure and hard-pure is 32.1% and 46.7%, whereas that for soft-applied and hard-applied is 59.4% and 68.3% respectively. Meanwhile, the mean of starting salary for soft-pure and hard-pure is 1584.2 and 1720.8 Yuan RMB, whereas that for soft-applied and hard-applied is 1822.1 and 1875.9 Yuan RMB respectively. Obviously, the percentage and starting salary are all higher for applied-oriented fields than for theory-oriented fields. When considering the starting salary by job match index, we find that for all fields but the soft-pure, the mean expected salary of matched jobs ( Job match index ^ 3) are higher than that of unmatched jobs ( Job match index < 3), to some extent, which supports the Human Capital Hypothesis.
TABLE I.
Distributions of Employment Status
TABLE II.
Percentage of Having Gotten an Offer and Expected Starting Monthly Salary
|
Percentage of Having Gotten an Offer (%) |
Mean of Monthly Salary (Yuan RMB) |
|
|
Major field of study |
||
|
Soft-pure |
32.1 |
1584.2 |
|
matched |
1603.4 |
|
|
unmatched |
1565.3 |
|
|
Soft-applied |
59.4 |
1822.1 |
|
matched |
2024.2 |
|
|
unmatched |
1671.7 |
|
|
Hard-pure |
46.7 |
1720.8 |
|
matched |
1886.5 |
|
|
unmatched |
1576.2 |
|
|
Hard-applied |
68.3 |
1875.9 |
|
matched |
2105.2 |
|
|
unmatched |
1651.4 |
|
|
Sex |
||
|
Male |
56.7 |
1789.6 |
|
matched |
1945.8 |
|
|
unmatched |
1678.4 |
|
|
Female |
48.4 |
1763.2 |
|
matched |
1890.2 |
|
|
unmatched |
1655.7 |
A further element to consider is that of sex discrimination in the labor market. In recent years, this has been a topic of widespread concern to society and to individual graduates. According to a simple statistical inference from this survey, there is no apparent difference in starting salary between male and female graduates, being 1789.6 RMB for males and 1763.2 RMB for females. However, the percentage of having gotten an offer for males is 56.7%, slightly higher than that for females, which is 48.4%.
We kept samples having gotten an offer (i.e., samples of Type 1 and 2 in Fig. 1) and excluded outliers, whose starting monthly salaries are fewer than 500 or more than 15000 Yuan RMB, leaving 1276 observations in the database for further regression analysis.
-
B. Regression Analysis
We had four findings based on the regression results shown in Tab. Ш : (1) coefficients of Job match index - the explanatory variable - were positive and statistically significant for all groups but “soft-pure” (p<0.05); (2) controlling Gender , coefficients of Job match index were more significant for application-oriented disciplines (“soft-applied” and “hard-applied”) than for theory-oriented disciplines (“soft-pure” and “hard-pure”), which implied that the income of graduates from application-oriented disciplines (vs. theory-oriented disciplines) were more prone to be affected by Job match index ; (3) controlling Major field of study , coefficients of Job match index were more significant for males than for females, which implied that the income of male (vs. female) graduates were more prone to be affected by Job match index ; (4) coefficients of Academic record were statistically significant for most groups.
Miller and Volker (1984) considered that graduates of humanities were not suitable for the Wiles test, because the professional education of humanities could not improve students’ occupational skills immediately [6]. As such, the regression results for group “soft-pure” could not be the evidences supporting or rejecting the Wiles test. Based on that, the results of Wiles test in our study are more likely to support the Human Capital Hypothesis.
TABLE III.
Regression Results
|
Independent Variables d |
Soft-pure a, b, c |
Soft-applied a, b, c |
Hard-pure a, b, c |
Hard-applied a, b, c |
||||
|
Male |
Female |
Male |
Female |
Male |
Female |
Male |
Female |
|
|
Job match index |
0.07 |
-0.04 |
0.26 *** |
0.20 ** |
0.23 ** |
0.19 * |
0.15 *** |
0.18 ** |
|
(0.46) |
(-0.38) |
(3.45) |
(2.71) |
(2.93) |
(2.13) |
(3.28) |
(2.85) |
|
|
Academic record |
0.18 |
0.24 * |
0.15 * |
0.13 † |
0.17 * |
0.12 |
0.10 † |
0.09 |
|
(1.51) |
(2.55) |
(2.32) |
(1.69) |
(2.30) |
(1.39) |
(1.87) |
(1.43) |
|
|
Family income |
0.17 † |
0.26 * |
0.13 * |
0.09 |
0.10 |
0.18 † |
0.10 * |
0.07 |
|
(1.74) |
(2.08) |
(2.16) |
(1.29) |
(1.42) |
(1.80) |
(2.39) |
(1.38) |
|
|
Self-esteem |
0.21 |
0.24 † |
0.17 * |
0.16 * |
0.24 ** |
0.12 |
0.20 *** |
0.11 † |
|
(1.29) |
(1.76) |
(2.22) |
(2.10) |
(2.87) |
(1.44) |
(4.16) |
(1.80) |
|
|
College English Test |
0.28 ** |
0.26 † |
0.14 * |
0.13 |
0.10 |
0.18 † |
0.14 ** |
0.13 † |
|
(2.78) |
(1.77) |
(1.99) |
(1.56) |
(0.74) |
(1.77) |
(2.81) |
(1.75) |
|
|
CCP member |
0.17 † |
0.05 |
0.22 ** |
0.16 † |
0.16 † |
0.38 * |
0.17 ** |
0.22 ** |
|
(1.93) |
(0.55) |
(3.12) |
(1.72) |
(1.91) |
(2.28) |
(2.48) |
(2.87) |
|
|
Practice or internship |
0.14 † |
0.19 * |
0.16 * |
0.11 |
0.13 † |
0.12 |
0.17 *** |
0.12 † |
|
(1.78) |
(1.93) |
(1.89) |
(1.37) |
(1.79) |
(1.24) |
(3.82) |
(1.81) |
|
|
Employment area |
0.32 * |
0.25 * |
0.25 *** |
0.16 * |
0.19 ** |
0.22 † |
0.09 * |
0.10 |
|
(2.33) |
(2.36) |
(3.51) |
(2.31) |
(2.59) |
(1.87) |
(2.01) |
(1.60) |
|
|
Employment place |
0.19 |
0.20 † |
0.12 † |
0.26 *** |
0.14 * |
0.08 |
0.12 ** |
0.13 * |
|
(1.45) |
(1.63) |
(1.72) |
(3.45) |
(2.09) |
(0.72) |
(2.66) |
(2.16) |
|
|
Public/private employment |
0.19 † (1.83) |
0.18 † (1.80) |
-0.05 (-0.55) |
0.10 (1.30) |
0.24 * (2.37) |
-0.02 (-0.13) |
0.06 (1.15) |
0.10 (1.49) |
b. Standardized coefficients.
c. The numbers in parentheses are t ratios based on Huber-White robust standard errors.
d. Statistically insignificant control variables (p>0.1) are not listed in the table.
-
V. Discussions
-
A. Robustness
To check the robustness of regression results, two transformations were made.
-
1) Redefine the explanatory variable: The dummy variable for Job match index was redefined, with 1 indicating the scale point equals 4 or 5 and 0 indicating the scale point equals 1, 2 or 3. The regression results were not changed qualitatively.
-
2) Put grouping variables into (1) directly: Generating three dummy variables for Major field of study , then put Major field of study , Gender , the interaction term Gender * Job match index and three interaction terms between Job match index and the dummy variables of Major field of study into (1). Results showed that the explanatory variable was still significant (p<0.01), and all interaction terms were significant (p<0.05), which were consistent with the results in Tab. 1.
-
B. Self-selection bias
-
4. Conclusions
Because the six NUCs surveyed are all situated at Jiangsu Province, and we kept only samples having signed a job contract, ineligible sample bias or selfselection bias may exist. In regard to this, Heckman correction was used [19]. The results were not changed qualitatively.
The results indicated that graduates employed in positions matched with their fields of study earned more than graduates employed in positions unmatched with their fields of study. Thus according to the logic of Wiles test, we could draw the conclusion that the Human Capital Hypothesis is more likely to be supported than the Screening Hypothesis, which also implies higher education is rather a production means than a signal of productivity for graduates of NUCs.
This conclusion has practical implications for the NUCs and their graduates.
-
1) For the NUCs: For occupational skills are very important for the employment outcome of graduates, the NUCs should continue to emphasize the trainings of occupational and application skills instead of transforming hastily to the general education and the trainings of academic skills. For this purpose, the NUCs should adjust their curriculum and faculty structure to accommodate with the skill demands in labor markets.
-
2) For the graduates: Graduates of the NUCs should seek jobs as matched with their major fields of study as possible. Because according to the Human Capital Hypothesis, only at such jobs could their human capital accumulated through higher education work well.
Acknowledgment
This study is sponsored by the Philosophy and Social Science Foundation for Higher Education of Jiangsu Province of China (Grant No. 09SJB880013).
References An Application of the Wiles Test in the Formulation of Education Strategy for the Newly-Upgraded Colleges of China
- G. Becker, Human Capital, New York: Columbia University Press, 1964.
- M. Spence, “Job market signaling,” The Quarterly Journal of Economics, vol. 87, no. 3, pp. 355–374, August, 1973.
- P. Wiles, “The correlation between education and earnings: the External-Test-Not-Content hypothesis,” Higher Education, vol. 3, no. 1, pp. 43–58, 1974.
- G. Arabsheibani, “The Wiles test revisited,” Economics Letters, vol. 29, pp. 361–364, 1989.
- W. N. Grubb, “The returns to education in the sub-baccalaureate labor market,” Economics of Education Review, vol. 16, no. 3, pp. 231–245, 1997.
- P. W. Miller and P. A. Volker, “The screening hypothesis: an application of the Wiles test,” Economic Inquiry, vol. 22, pp. 121–127, 1984.
- W. H. Xie, “Match and adaption – the two patterns of relationship between trainings in higher education and the labor market,” Peking University Education Review, no. 4, pp. 9–11, 2004.
- R. Yang, "Chapter 8. toward massification: higher education development in the People's Republic of China since 1949," in Higher Education: Handbook of Theory and Research, Vol. XIX, J. C. Smart, Eds. 2004, pp. 311–374.
- K. Ngok and M. H. Lee, "Localization of higher education and its social consequences in mainland China,1993-2006," unpublished.
- J. Zhou, Higher Education in China, Florence, KY: Cengage Learning, 2005.
- UNESCO, World Higher Education Report, 2003.
- China Education Online, “The 2010 enrollment plan of Pe-king University,” http://gkcx.eol.cn/schoolhtm/schoolPlan/5703/schoolPlan5703.htm, retrieved on 2010-8-1.
- Bulletin of Ministry of Education of the People's Republic of China, no. 92, 2010, http://www.moe.edu.cn/edoas/website18/level3.jsp?tablename=1263440017913682&infoid=1275547140496537, retrieved on 2010-8-2.
- J. Xiao, "China’s educational reform in transition: is it transforming?" Chinese University of Hong Kong, unpublished, 2007.
- Z. P. Li and W. D. Wu, “The characteristics and modes of the newly-upgraded colleges’ upgrading to undergraduate-level in essence”. Higher Education Research of China, no. 6, pp. 39-41, 2005.
- E. Richards, “Early employment situations and work role satisfaction among recent college graduates,” Journal of Vocational Behavior, vol. 24, pp. 305–318, 1984.
- A. Biglan, “The characteristics of subject matter in different academic areas,” Journal of Applied Psychology, vol. 57, no. 3, pp. 195–203, 1973.
- M. Rosenberg, Society and the Adolescent Self-image. Princeton, NJ: Princeton University Press, 1965.
- J. Heckman, “Sample selection bias as a specification error,” Econometrica, vol. 47, pp. 153–161, 1979.
