An approach for analyzing noisy multiple sclerosis images using truncated beta gaussian mixture model

Author: S. Anuradha, Ch. Satyanarayana, Y. Srinivas
Journal: International Journal of Image, Graphics and Signal Processing @ijigsp
Article in issue: 8 vol.10, 2018.
Free access
Sclerosis is a disease that triggers mainly due to damage of nerve cells in the brain and spinal cord. Various impairments are observed with this disease. Analyzing this type of images is needed for the medical research field for early stage identification. So, the present paper uses Bivariate Gaussian Mixture distribution for analyzing the noisy sclerosis images. For this, the present paper uses neural network for classification. The proposed method is evaluated with various images of brain web repository and the results show the efficiency of the proposed method.
Neural Network, Clustering, Classification and Mixture models
Short address: https://sciup.org/15015988
IDR: 15015988 | DOI: 10.5815/ijigsp.2018.08.06
Text of the scientific article An approach for analyzing noisy multiple sclerosis images using truncated beta gaussian mixture model
Published Online August 2018 in MECS
According to the medical literature, the changes in HLA region of chromosome-6, results into a disease called sclerosis [1].This is considered to be a non-hereditary disease. However there are indications of genetic variations that can be observed in most of the diseased individuals [2][3]. Another analogy about the disease is that, the patients having higher levels of Microglia cells have the probability of getting this disease. It is also observed that the close relatives of the patients may have the highest probability of getting the disease when compared to distant relations. The main symptoms are mostly based on neurological disorders and particular signs of the disease are observed in terms of sensing problems, visualization problems and autonomic problems. Specific symptoms include; loss of sensitivity, numbness, weakness, blurred vision, muscle spasms and imbalance. The sclerosis disease can be categorized into either partial or multiple in nature.
In cases of multiple sclerosis, the only way to combat the disease is by means of surgical treatment; however clinical treatments can pacify the partial sclerosis disease. The likelihood of partial sclerosis getting transformed into multiple sclerosis is very high [4]. Therefore, it is necessary to develop algorithms and methods for proper identification of the disease at the early stage so as to overcome the problem of surgery [5][6].
In order to overcome this disease, lot of medical research is triggered in this direction [7][8][9] however, most of these methodologies hinder to identify the cases appropriately and robustly. This is mainly due to the presence of noise and other influencing factors, such as multiple symptoms which hampers the effective treatment. Therefore, it is necessary to develop models that can identify the disease at the earlier stage, so that a living life style of the individual can be optimized. In order to overcome the limitations of the existing methodologies, the present article highlights a contribution wherein the concepts of Neural Networks is considered for training of the data so that noise can be eliminated and the so formulated fine-tuned images are made available for further medical analysis. The other disadvantage with the medical data is that in most of the cases, the variations in the human anatomy are confined at particular regions inside the brain, in this particular disease, near the lobe. Therefore, it is necessary to discard the unnecessary data and new algorithms are to be developed such that only the core vital information is visualized.
A self-organizing Neural Network along with a class of switching filters was developed in [10], which is used to efficiently remove impulse noise from images as compared to median filter. In order to enhance the resultant image, a histogram equalizer is employed.
Multilayer neural network architecture has been proposed [11] for noise reduction and to improve the tracking parameters of the model. For effective MR Image segmentation, an algorithm [12] is presented based on Finite Skew Gaussian Mixture Model and ExpectationMaximization algorithm. The proposed model works well on T1-weighted images and is used for effectively detecting Parkinson’s disease and acoustic neuroma. The model is evaluated against various image quality metrics. To eliminate Gaussian noise an adaptive fuzzy filter is proposed in [13], which shows better results as compared to other fuzzy filters. For automatic multiple sclerosis detection in [14] the authors have presented a Markov Random Field and Adaptive Mixture Models. Experimentation was carried on T1 and T2 weighted images and showed promising results.
For an MR Image degraded with Noise, Gaussian and salt and pepper noise eliminating filters [15] have been considered with a novel modified Fuzzy c-means algorithm to segment the MR brain Images. The algorithm works by modifying the membership weights of each cluster and by incorporation of spatial neighborhood information into Fuzzy c-means algorithm. In [16] evaluation of multiple sclerosis (MS) and other demyelinating diseases is proposed by determining κ free light chains (KFLC) in cerebrospinal fluid (CSF) by nephro-elopathy . The study included 123 patients with a CSF OCB was carried out. Using CSF/serum quotient of KFLC and albumin the KFLC index was calculated and was compared with MS diagnosis to find the optimal cutoff. Results showed that for MS diagnosis the best cutoff for the KFLC index was 2.91. The proposed algorithm showed no higher sensitivity and specificity than OCB in MS diagnosis.
In [17] Multiple sclerosis (MS) is regarded as the autoimmune disease attacking the central nervous system. People with age group from 20–50 years old are attacked by MS and especially female rate attack is double than male rate. MS causes results into axon damage, paralysis and nerve sheath demyelization. MS symptoms include weak reflexes, muscle weakness, difficultly in moving, muscle spasm. Populations in North Europe suffer from MS due to deficiency of vitamin D. According to the authors, MS can be distinguished by four types namely: relapsing-remitting, primary progressive, secondary progressive and progressive relapsing. For relapsingremitting MS type include: interferon β-1b, interferon β-1a, glatirameracetate, mitoxantrone, natalizumab. Treatment for progressive MS is mitoxantrone. Other MS treatments include: vitamin D, Yoga, reflexology medicinal plants, acupuncture. Oxygen therapy.
To resolve the problem in to a more efficient way, the present paper proposes an approach with truncation for considering only finite data by discarding the unwanted data. The proposed approach uses a Truncated Bivariate Gaussian Mixture Model. The paper is organized into four sections. The section 1 discussed about the introduction to the analysis of the multiple sclerosis image, the related work in section 2, the methodology of the proposed approach is discussed in section 3, the results and discussions in section 4 and conclusions in section 5.
-
II. Related Work
The nervous system is majorly affected by the automated chronic disease called as Multiple Sclerosis (MS). It is found that the disease causing disabling effect in the patients. The severity of the effect varies from one patient to another patient. In the medical field, the research is going on to provide the facility to indentify and curing the MS in the patients. Thus, early detection, analysis and handling the MS is found to decrease the disability effect rate. The Electronic Medical Record (EMR) [18] is developed to predict the MS in the early stage for further analysis. It is found that the MS can cause the decay effect called as Demyelination. The combination of genetic and geographical factor in balances and hereditary problems can cause the MS in the patients. The MS can be detected by using MRI [19]. In this process, the tissues of white or gray matters can be further analyzed for the existence of lesions. It can be implemented with skinning the brain tissue and computation of edge and connected boundaries of the tissue. The Multispectral MRI images can be used for detection of MS in the patients. The method can use the segmentation process. This can segment the lesions in the input MRI and performs the classification. The classification stage can use the tissue intensity based features. Further, the specific models of the tissue can be estimated. The Markov random field [20] based classification can yield better load correlation of the tissue. A system with REOVIEM [21] provides an enhanced tool for controlling the rehabilitation process. With this, the patients MS condition can be evaluated periodically. The MS can be detected based on the enhanced lesions of GD [22] of T1 weighted MRI. The mathematical morphology is well suited for handling various structures in the input image. The thresholding is used for conversion process. The combination of these methods can give a better insight into various shapes of the input image. The lesions in the input image are efficiently estimated with the connected component algorithm. This algorithm is used to label various components of the input image. In the recent years, a wide attention is gained for automated detection of MS in the input patients. With this system, the loss of connectivity between the brain and other parts of the body can be detected. For this automated system, fuzzy rule based [23] expert system can be designed for detection of MS. In this system, various rules are formulated for detecting the fuzziness in the uncertain results of the input variables. The MS can also be detected by using gait sequences of the input patient. The gait sequences should be well captured. These captured images should be further analyzed [24] in detail to detect the MS in the input patient. This process performs well with the better classification system. The MS in the input patient data can be detected with various neurological observations. For each observation, a score can be estimated [25] and based on the overall score of the observations, the MS can be efficiently detected.
Among various scores used for the detection of the MS in the patient, the Dynamic Time Wrapping based Score [26] is found to be efficient than other scores. This score will estimate the dynamic wrap time distance based then wraps it into the fixed length. This score is further coupled with the kernel density estimation. Based on this density estimation, peak value will be estimated. These values will be combined with the causality index. All these features are used for detection of the MS in the input patient. The biorthogonal wavelet transform is found to be efficient for transforming the input MRI image. The transformed image can be further efficiently analyzed with the principal component analysis [27]. From the analyzed image, the lesion of the MS [28, 29] can be efficiently detected with the regression model.
-
III. Methodology
The present paper is proposing an approach for analyzing the noisy multiple sclerosis images. For this, the present paper uses Multilayer Neural Network architecture for denoising the input image. A multilayer neural network consists of input layers, hidden layers, middle layers and output layers. Training and Testing are the two phases of the neural network functioning. In the training phase, suitable weights are assigned to pixels inside the images which are given to the input layer. During the testing phase, the input layers are tested creating response to output layer. Error rate is identified with (1).
errXt ) = dt i ( t ) - ytt ( t ) (1)
Where, err (t) is the error signal dt (t) is the target response yt (t) is the actual response
The present approach uses Truncated Beta Gaussian Mixture Model (TBGMM) to identify the sclerosis disease from brain MR Images. The Probability Density Function of the TBGMM is given as:
x“- - 1 ( 1 - x ) в - 1
5 I a в e
-^_ 1 2 1 о 7
-^ < x < ^
Where
A is the pixel intensity levels at minimum frequency, B is the pixel intensity levels at maximum frequency.
The Fuzzy c-means algorithm along with Truncated Beta Gaussian mixture model is used for effective classification of the brain disease. Fuzzy c-means clustering algorithm is:
-
1. Initially select a Fuzzy pseudo-partition (initial membership value).
-
2. Reiterate the cluster member ship function
-
3. By using Fuzzy Pseudo-partition, calculate the centroid subject to centroid that minimizes Fuzzy Sum of Squared Error.
-
4. Again calculate Fuzzy Pseudo-partition until the centroids converges.
The segmentation algorithm used in the present paper is given as:
-
1. Initially, preprocess the brain MR images using neural network architecture for noise elimination.
-
2. Apply the Fuzzy-c-means algorithm to identify the homogeneous clusters and identify the diseased clusters.
-
3. The pixels from each of the diseased clusters are given to TBGMM.
-
4. Find the truncation points and to each pixel apply the Probability Density Function to accurately identify the sclerosis disease.
-
IV. Results and Discussions
The proposed approach is experimented with the Multiple Sclerosis MRI images from brain web image dataset. 2500 images are considered for the training and 50 are considered for the testing phases. The size of each image is 150×150 with the deformity at different levels and stages. The experimentation is carried out in a matlab environment using both subjective and objective measures on brain web image dataset and dataset collected from MVP hospitals.
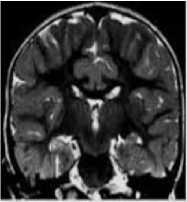
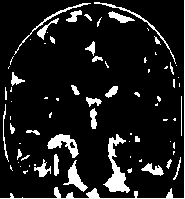
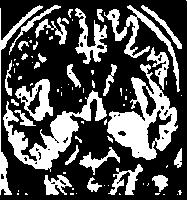
The FCM algorithm is applied on the input image for segmentation. The results of the FCM algorithm are shown in Fig. 1. The results of the proposed algorithm are shown with five images as shown in Fig, 1. The original images are shown in Fig. 1 (a), (c), (e), (g) and (i). The Fig. 1(a) shows Image1, Fig. 1(c) shows Image2, Fig. 1(e) shows Image3, Fig. 1(g) shows Image4 and Fig. 1(i) shows Image5. The FCM algorithm is applied to these original images and the results are shown in Fig. 1. The FCM result of Image1 is shown in Fig. 1 (b), FCM result of Image2 in Fig. 1(d), FCM result of Image3 in Fig. 1(f), FCM result of Image4 in Fig. 1(h) and FCM result of Image5 in Fig. 1(j). From these results, it is clear that the FCM algorithm is found to be efficient for performing segmentation.
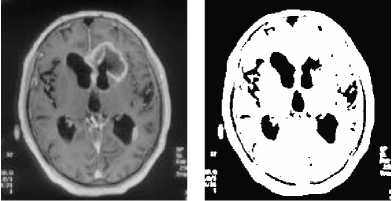
(a) (b)
(c) (d)
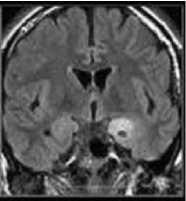
shows the TBGMM result of the Input Image5 as shown in Fig. 1(i).
Various segmentation quality metrics as Global Consistency Error (GCE), Variation of Information (VOI), Jaccard Coefficient (JC), Volumetric Similarity (VS) and Probability Rand Index (PRI) are used to evaluate the segmentation results. The reconstructed output images are evaluated against image quality metrics as Image Fidelity (IF), Average Difference (AD), and Maximum Distance (MD) .The proposed model is compared against Finite Beta Gaussian Mixture model. The results are listed in Table 1.
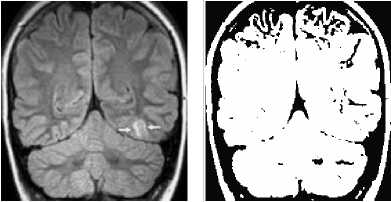
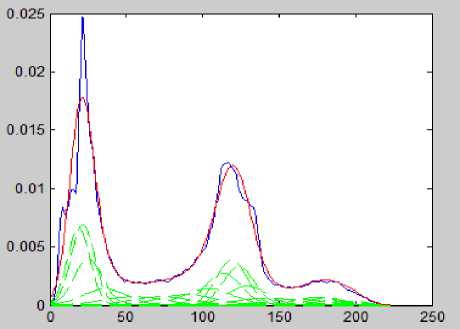
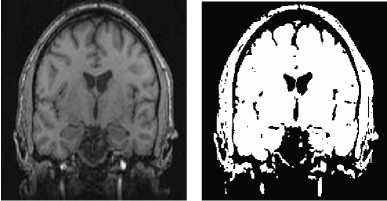
Fig.2. TBGMM result of Image1.
(g)
(h)
(i)
Fig.1. (a) Image1 (b) FCM of Image 1 (c) Image2 (d) FCM of Image2 (e) Image3 (f) FCM of Image3 (g) Image4 (h) FCM of Image4 (i) Image5 (j) FCM of Image5.
(j)
The TBGMM is applied on the FCM results of the input images and the results are shown in Fig. 2 to Fig. 6. The Fig. 2 shows the TBGMM result of the Input Image1 as shown in Fig. 1(a). The Fig. 3 shows the TBGMM result of the Input Image2 as shown in Fig. 1(c). The Fig. 4 shows the TBGMM result of the Input Image3 as shown in Fig. 1(e). The Fig. 5 shows the TBGMM result of the Input Image4 as shown in Fig. 1(g). The Fig. 6
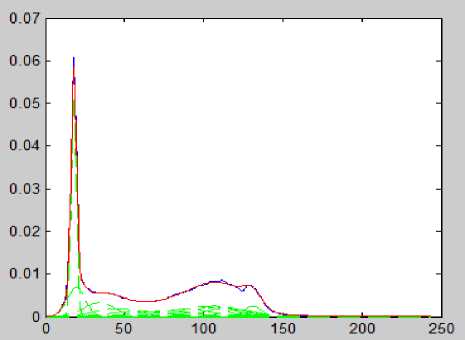
Fig.3. TBGMM result of Image2.
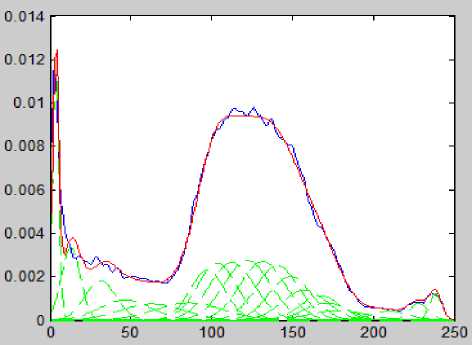
Fig.4. TBGMM result of Image3.
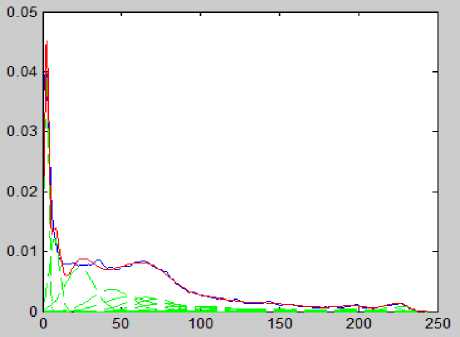
Fig.5. TBGMM result of Image4.
Fig.6. TBGMM result of Image5.
Table 1. Image Quality Metrics showing the performance of GMM, TBGMM – KM
|
Image |
Quality Metric |
GMM |
Truncated BGMM with Fuzzy C-Means |
Standard Limits |
Standard Criteria |
|
Average Difference Maximum Distance Image Fidelity |
0.68 |
0.801 |
-1 to 1 |
Closer to 1 |
|
|
0.42 |
0.883 |
-1 to 1 |
Closer to 1 |
||
|
к» * J |
0.418 |
0.788 |
0 to 1 |
Closer to 1 |
|
|
Average |
|||||
|
Difference |
0.42 |
0.882 |
-1 to 1 |
Closer to 1 |
|
|
Maximum Distance Image Fidelity |
|||||
|
0. 252 |
0.811 |
-1 to 1 |
Closer to 1 |
||
|
0.416 |
0.87 |
0 to 1 |
Closer to 1 |
||
|
Average |
|||||
|
Difference |
0.581 |
0.732 |
-1 to 1 |
Closer to 1 |
|
|
Maximum Distance |
0.423 |
0.851 |
-1 to 1 |
Closer to 1 |
|
|
0.542 |
0.881 |
0 to 1 |
Closer to 1 |
||
|
Image |
|||||
|
Fidelity |
|||||
|
Average |
|||||
|
Difference Maximum Distance Image Fidelity |
0.416 |
0.481 |
-1 to 1 |
Closer to 1 |
|
|
0. 372 |
0.87 |
-1 to 1 |
Closer to 1 |
||
|
0.414 |
0.841 |
0 to 1 |
Closer to 1 |
||
|
■ V ■ |
Average Difference Maximum Distance |
0.418 |
0.783 |
-1 to 1 |
Closer to 1 |
|
0.419 |
0.84 |
-1 to 1 |
Closer to 1 |
||
|
li1 /^ Л |
Image Fidelity |
0.431 |
0.87 |
0 to 1 |
Closer to 1 |
-
V. Conclusions
The present paper proposes an approach for analyzing the noisy multiple sclerosis images. The proposed approach consists of Neural Network, TBGMM, Fuzzy C-means clustering process and segmentation process. The proposed approach is experimented with eight sub images of B0 and B1 images and the performance measures are observed that they are closer to 1. From the results, it is evident that the current approach is better than the existing Finite Gaussian Mixture model. This current approach can be further extended to consider multiple features for accurate identification of sclerosis disease to be later used by the medical practitioners.
References An approach for analyzing noisy multiple sclerosis images using truncated beta gaussian mixture model
- Stamatelos P, Anagnostouli M ,2017. HLA-Genotype in Multiple Sclerosis: The Role in Disease onset, Clinical Course, Cognitive Status and Response to Treatment: A Clear Step Towards Personalized Therapeutics. Immunogenet open access 2: 116.
- Tobias Zrzavy Simon Hametner Isabella Wimmer Oleg ButovskyHoward L. Weiner Hans Lassmann. Loss of ‘homeostatic’ microglia and patterns of their activation in active multiple sclerosis. Brain, Volume 140, Issue 7, 1 July 2017, Pages 1900–1913.
- Zhou Y, Graves JS, Simpson S, et al Genetic variation in the gene LRP2 increases relapse risk in multiple sclerosis J Neurol Neurosurg Psychiatry Published Online First: 24 July 2017. doi: 10.1136/jnnp-2017-315971.
- Ramagopalan, SV, Dobson, R, Meier, UC. Multiple sclerosis: risk factors, prodromes, and potential causal pathways. Lancet Neurol 2010; 9: 727–739. Google Scholar, Crossref, Medline
- Frischer, JM, Weigand, SD, Guo, Y. Clinical and pathological insights into the dynamic nature of the white matter multiple sclerosis plaque. Ann Neurol 2015; 78: 710–721. Google Scholar, Crossref, Medline
- M. Filippi, M. Bozzali, M. Rovaris, O. Gonen, C. Kesavadas, A. Ghezzi, V. Martinelli, R. I. Grossman, G. Scotti, G. Comi, A. Falini; Evidence for widespread axonal damage at the earliest clinical stage of multiple sclerosis, Brain, Volume 126, Issue 2, 1 February 2003, Pages 433–437.
- M. Vamsi Krishna, Dr.P.V.G.D Prasad Reddy,Dr.Srinivas, Dr. S.S. Nayak , 2015. Bivariate Gaussian Mixture Model based segmentation for effective identification of Sclerosis in MRI Brain images, International Journal of Engineering and Technical Research, ISSN 2321-0869, Volume 3, Issue 1, pp 151-153.
- Ernstsson O, Gyllensten H, Alexanderson K, . Cost of illness of multiple sclerosis – A systematic review. PLoS ONE 2016; 11: e0159129. Google Scholar Crossref
- Kobelt G, Thompson A, Berg J, 2017. New insights into the burden and costs of multiple sclerosis in Europe. Mult Scler : 23(8): 1123–1136. Google Scholar Link.
- Hussain Abo Surrah et al, 2014.Journal of Global Research in Computer Science, 5 (3), 1-7.
- Badri, L. ,2010.Development of neural networks for noise reduction. Int. Arab J. Inf. Technol. 7, 289–294.
- Nagesh Vadaparthi , Srinivas Yarramalle , P. Suresh Varma, 2011.Unsupervised Medical Image Classification Based on Skew Gaussian Mixture Model and Hierarchical Clustering Algorithm. Advances in Digital Image Processing and Information Technology Volume 205 of the series Communications in Computer and Information Science pp 65-74.
- Lotfi, Ehsan. 2013. An Adaptive Fuzzy Filter for Gaussian Noise Reduction using Image Histogram Estimation. Advances in Digital Multimedia. 1. 190-193.
- Rasoul Khayati , Mansur Vafadust , Farzad Towhidkhah , S. Massood Nabavi , 2008.A novel method for automatic determination of different stages of multiple sclerosis lesions in brain MR FLAIR images”. Computerized Medical Imaging and Graphics Volume 32, Issue 2, Pages 124–133.
- Wanj J, Kong J, Lu Y, Qi M, Zhang B. , 2008. A modified FCM algorithm for MRI brain image segmentation using both local and non-local spatial constraints. Computerized Medical Imaging and Graphics, 32(8):685-98.
- Valencia-Vera, Estefania & Martinez-Escribano Garcia-Ripoll, Ana & Enguix, Alfredo & Abalos-Garcia, Carmen & Jesus Segovia-Cuevas, Maria, 2017. Application of κ free light chains in cerebrospinal fluid as a biomarker in multiple sclerosis diagnosis: development of a diagnosis algorithm. Clinical chemistry and laboratory medicine. . 10.1515/cclm-2017-0285.
- Koriem, Khaled. 2016. Multiple sclerosis: New insights and trends. Asian Pacific Journal of Tropical Biomedicine. 6. 10.1016/j.apjtb.2016.03.009.
- Joyce C. Ho, Joydeep Ghosh, K.P.Unnikrishnan, “Risk Prediction of a Multiple Sclerosis Diagnosis,” Healthcare Informatics (ICHI), 2013 IEEE International Conference on, 9-11 Sept. 2013.
- S.M. Ali, Asmaa Maher, “Multidisciplinary in IT and Communication Science and Applications (AIC-MITCSA), Al-Sadeq International Conference on,” 9-10 May 2016.
- K. Van Leemput,F. Maes, D. Vandermeulen, A. Colchester, P. Suetens, “Automated segmentation of multiple sclerosis lesions by model outlier detection,” IEEE Transactions on Medical Imaging ( Volume: 20, Issue: 8, Aug. 2001 ), 677-688.
- J. A. Lozano-Quilis,H. Gil-Gómez,J. A. Gil-Gómez, S. Albiol-Pérez, G. Palacios, Habib M. Fardoum, Abdulfattah S. Mashat, “Virtual reality system for multiple sclerosis rehabilitation using KINECT,” Pervasive Computing Technologies for Healthcare (PervasiveHealth), 2013 7th International Conference on, 5-8 May 2013.
- H. He, P.A. Narayana, “Detection and delineation of multiple sclerosis lesions in gadolinium-enhanced 3D T1-weighted MRI data,” Computer-Based Medical Systems, 2000. CBMS 2000. Proceedings. 13th IEEE Symposium on, 24-24 June 2000.
- M. Arabzadeh Ghahazi, M. H. Fazel Zarandi, M. H. Harirchian, S. Rahimi Damirchi-Darasi, “Fuzzy rule based expert system for diagnosis of multiple sclerosis,” Norbert Wiener in the 21st Century (21CW), 2014 IEEE Conference on, 24-26 June 2014.
- Dimitris Kastaniotis, George Economou, Spiros Fotopoulos, Gerasimos Kartsakalis, Panagiotis Papathanasopoulos, “Using kinect for assesing the state of Multiple Sclerosis patients,” Wireless Mobile Communication and Healthcare (Mobihealth), 2014 EAI 4th International Conference on, 3-5 Nov. 2014.
- Michael L. Daley, Roy L. Swank, “Quantitative Posturography: Use in Multiple Sclerosis,” IEEE Transactions on Biomedical Engineering ( Volume: BME-28, Issue: 9, Sept. 1981 ), 668-671.
- Sriram Raju Dandu, Matthew M. Engelhard, Asma Qureshi, Jiaqi Gong, John C. Lach, Maite Brandt-Pearce, Myla D. Goldman, “Understanding the Physiological Significance of Four Inertial Gait Features in Multiple Sclerosis,” IEEE Journal of Biomedical and Health Informatics ( Volume: 22, Issue: 1, Jan. 2018 ), 40-46.
- Shui-Hua Wang, Tian-Ming Zhan, Yi Chen, Yin Zhang, Ming Yang, Hui-Min Lu, Hai-Nan Wang, Bin Liu, Preetha Phillips, “Multiple Sclerosis Detection Based on Biorthogonal Wavelet Transform, RBF Kernel Principal Component Analysis, and Logistic Regression,” IEEE Access ( Volume: 4 ), 7567-7576.
- Evgin Goceri, Caner Songül, “Computer-based segmentation, change detection and quantification for lesions in multiple sclerosis,” Computer Science and Engineering (UBMK), 2017 International Conference on, 5-8 Oct. 2017.
- Akselrod-Ballin A1, Galun M, Gomori JM, Filippi M, Valsasina P, Basri R, Brandt A., “Automatic segmentation and classification of multiple sclerosis in multichannel MRI,” IEEE Trans Biomed Eng. 2009 Oct;56(10):2461-9.
