An approach to modeling the investment attractiveness of the industry in the regional aspect

Author: Elokhova I.V., Plotnikov R.V.
Journal: Economic and Social Changes: Facts, Trends, Forecast @volnc-esc-en
Section: Regional economy
Article in issue: 1 т.17, 2024.
Free access
At present, attracting investments in Russia’s strategically important sectors remains a critical issue in the development of the domestic economy. Under the current sanctions pressure against the Russian Federation, the development of manufacturing industries is becoming the leading task in ensuring nationwide economic growth. The aim of the study is to develop a methodology for calculating the aggregated factor coefficient of investment attractiveness for a complex of manufacturing industries in the regions, based on econometric modeling. The investment attractiveness of a complex of manufacturing industries is understood as a set of significant factors that determine the inflow of investments into a complex of manufacturing industries. As a result of the study, we revealed that at the moment there is no unified generally accepted methodology for assessing the investment attractiveness of manufacturing industries; factors determining their investment attractiveness are not systematized; there are no studies devoted to identifying statistically significant factors for this type of economic activity. In this regard, a model was developed for selecting significant factors promoting investment attractiveness of a complex of manufacturing industries in Russia’s regions. According to the methodology, the final aggregated factor coefficient is formed on the basis of private indicators that were combined into groups of factors, which allows us to identify the most important factors affecting the investment attractiveness ofthe manufacturing industry in a particular region and identify strategies to improve their investment attractiveness. The analysis of the aggregated factor coefficient will help potential investors to determine in which regions the complex of manufacturing industries is most promising for investment, as well as what measures need to be taken to improve the investment attractiveness of the complex of manufacturing industries in regions with a low coefficient value. The evaluation results showed that the most significant factors are production, labor, and innovation factors promoting investment attractiveness of the manufacturing industry. Our approach and the results we obtained can be used by public and private investors to make a decision on the expediency of investments in the industry and by authorities when forming investment policy, taking into account regional industry specifics.
Investments, investment attractiveness, economic systems, region, industry in the region, industry enterprise in the region, factors, assessment
Short address: https://sciup.org/147243324
IDR: 147243324 | UDC: 330.322:330.342 | DOI: 10.15838/esc.2024.1.91.6
Text of the scientific article An approach to modeling the investment attractiveness of the industry in the regional aspect
The issue concerning the investment attractiveness in strategically important industries in the regions to develop Russian production, renovate production assets, and switch to the production of innovative products is coming to the fore due to the rapidly changing global economic trends. A priority area of economic development of the Russian Federation is the manufacturing industry considering the sanctions pressure, withdrawal of the Russian economy from oil and gas dependence and due to the exhaustibility of natural resources (oil and gas). Speaking about the structural changes in the Russian economy, we note that according to 2022 state statistics data in the GDP structure (by economic sectors) manufacturing industry as a whole takes the first place with the value of 14.2%, the second place is occupied by mining (14.0%)1. The increase in the share of industry in GDP is due to the need to carry out import substitution of basic technologies, so it is the assessment of investment attractiveness (hereinafter – IA) on the example of manufacturing industry (hereinafter – IAtea(industries) – investment attractiveness of types of economic activities) is the main aim of our study.
Despite the presence of many theoretical approaches to the assessment of the IAtea (industries), their application is hampered in practice by the need to adapt to the specifics of the analyzed industry or type of economic activity. We should also note that it is necessary to assess industries in a particular region due to the heterogeneity of regional development in Russia. Continuing the discussion about the assessment of the IA of the types of economic activities, the idea of a hierarchical order of factors for each type of economic activity with distinctive features seems to be important. At the same time, it is worth noting that for a set of industries which form a particular type of economic activity type, the set of factors will be the same.
Let us highlight a number of problems of estimating the IA of the complex of manufacturing industries. The first one is the lack of a unified methodology for assessing the IAtea(industries). The second is the problem of choosing an approach to assess the IAtea(industries). Currently, there are two approaches: from the point of view of the region’s attractiveness, which determines the IA of the industry; from the point of view of prioritizing the attractiveness of industries, which determine the IA of the region. In our opinion, when making a decision on investment, an investor, first of all invests in the industry, and then in the region, as the IA of the region reflects the territorial attractiveness for life. This is also evidenced by the results of the assessment of the region’s IA obtained by Expert RA in 2023, which showed that the greatest weight among the blocks of the region’s IA belongs to infrastructural factors (40%). We should note that the IAtea(industries) is studied as a set of factors. One of the problems of the IAtea(industries) assessment is the lack of systematization of factors, their statistical measurement, as well as determination of their significance. It is worth noting that in the studies devoted to the indicators of the IA evaluation of the complex of manufacturing industries, the authors emphasize a different set of indicators.
For instance, one of the main objectives of our study is the consideration of factors affecting the IA of the complex of manufacturing industries, based on the analysis of existing theoretical concepts. To increase the IA of the complex of manufacturing industries, it is necessary to identify the significant factors and determine the degree of their impact on the inflow of investment in the type of economic activity in the region. The aim of the research is to develop an aggregate factor coefficient of the IA of the industry in the region o n the basis of econometric modeling.
To achieve the aim of the research, we set the following tasks:
-
1) to analyze methods for estimating the IA of the complex of manufacturing industries;
-
2) to systematize the IA factors concerning the complex of manufacturing industries in the regions;
-
3) to development the econometric model of selection of the IA factors concerning the complex of manufacturing industries on the investments inflow in the TEA in the region;
-
4) to work out an algorithm for calculating our coefficient of investment attractiveness of the complex of manufacturing industries.
The scientific novelty of the research consists in the creation of a model for the selection of significant factors concerning the IA of the manufacturing industry and the development on their basis of the methodology for calculating the aggregate factor coefficient of the IAtea(industries), taking into account regional specifics.
The significance of the study lies in the development of a methodology for calculating the aggregate factor coefficient of the IAtea(industries), which makes it possible to reasonably rank the regions by the level of the IA of the complex of manufacturing industries, taking into account regional specifics. The methodological aspect of ranking consists in the substantiation of the approach and selection of the most significant factors of influence on the investment inflow in the type of economic activity “Manufacturing industries” taking into account regional specifics.
Literature review
In the previous few years, researchers have been focusing on studying the investment attractiveness of the objects of economic system levels. The direction of foreign research is the study of the countries’ IA. For example, the European Commission has developed an index of the countries’ IA, which ranks countries by the investment volume2. We should say that the Russian economy is a multilevel system consisting of interrelated elements, so the IA can be considered from the point of view of both the region and the industry, enterprise. We will focus on the IAtea(industries). To date, there are many techniques for assessing investment attractiveness. Despite the fact that the existing approaches to valuation of the IAtea(industries) reflect investment opportunities, however, they need to be improved, as they have shortcomings. The main problem of the IAtea(industries)
assessment is the choice of the object of assessment: the TEA (industries) in the country, the TEA (industries) in the region, a set of the TEA (industries) enterprises in the region. Also, some methodologies are exclusively descriptive in nature, there are problems of availability and selection of indicators (unreasonableness of indicators), taking into account insufficient or excessive amount of data. Table 1 presents an analysis of the methodologies for the IA of manufacturing industry and the IA of industries related to this TEA.
Table 1. Analysis of methodologies for estimating the IA of manufacturing and the IA of industries related to the TEA
|
Author |
Final indicator |
Assessment object |
Advantages |
Disadvantages |
|
(Safiullin, Gubaidullina, 2020) |
Integral (localization and risk) |
TEA in a region |
Calculation by statistical methods, reduction to a single indicator, availability of statistical data, possibility of retrospective analysis |
Consideration of qualitative indicators, insufficient number of factors (accounting only for shipment of goods), lack of comparison of regions |
|
(Milovanova, Kuz’menko, 2007) |
Integral (economic component and risk) |
Industry in a region |
Calculation by statistical methods, reduction to a single indicator, availability of statistical data, simplicity of calculation, possibility of retrospective analysis |
Objective assessment of the risk component; taking into account only the economic factor |
|
(Kovaleva, 2014) |
Integral indicator (investment potential and risk) |
All industries |
Calculation by statistical methods, simplicity of calculation, possibility to apply the methodology for different industries |
It is descriptive in nature, no specific indicators are presented, applicable only to the industry as a whole in the country |
|
(Kalinina, Kalinina, 2016) |
Integral indicator (sum of rating factors) |
TEA in regions |
The ready-made indicator, the possibility of applying the methodology to calculate different TEA, the visibility of the results obtained, helps to highlight the region’s rating |
Indicators for each TEA are the same, insufficient number of indicators is taken into account, unproven selection of factors |
|
(Boslovyak, 2012) |
Integral indicator (private indicators) |
Industries in a country |
Ready-made indicator, applicability for different industries, calculation in dynamics |
Subjectivity, complexity of calculation, taking into account insufficient number of factors (financial) |
|
(Varavin et al., 2023) |
Index |
Industry in a region |
Ready-made indicator, easy to calculate, objective |
Lack of statistical data to measure the environmental factor, taking into account insufficient number of indicators |
|
(Fomina, 2015) |
Analysis of indicators |
TEA by country |
Obtaining an objective evaluation result |
Need for additional calculation of the model forming the aggregate indicator |
|
(Klimova, Shapovalova, 2017) |
Analysis of indicators |
Industry in a region |
Obtaining an objective evaluation result |
Need for additional calculation of the model forming the aggregate indicator |
|
(Avezova et al., 2022) |
Analysis of indicators |
Industry by country |
Obtaining an objective evaluation result |
Need for additional calculation of the model forming the aggregate indicator |
|
(Abdikeev et al., 2019) |
Investment potential through the analysis of indicators |
TEA by country |
Obtaining an objective evaluation result |
Need for additional calculation of the model forming the aggregate indicator |
|
(Vanyushkin, 2015) |
Analysis of indicators |
TEA and industries in a region |
Obtaining an objective evaluation result |
Need for additional calculation of the model forming the aggregate indicator |
|
(Veretennikova, Rybina, 2011) |
Investment volume |
Industries by countries |
Obtaining an objective evaluation result |
Need to take into account additional factors, consideration of external funding from the U.S. |
|
Source: own compilation. |
||||
In our previous studies, we determined that the best approach for assessing the industries’ IA in the region would be the factor approach, taking into account the interrelation and interdependence of the activities of different levels of the economic system, which allows fully utilizing the approach to form the IA management system of industries (Elokhova, Plotnikov, 2023).
Continuing the conversation about the IAtea(industry) in the region, we note that today there are two approaches to its assessment: in terms of the region’s attractiveness, which determines the IAtea(industry) (Burlin, 2023; Veretennikova, Rybina, 2011; Dyachkova, Zhevtun, 2023; Sviridova et al, 2023; Fomina, 2015; Binda et al., 2020); and in terms of prioritizing the attractiveness of the TEA (industry), which already determines the region’s IA (Vanyushkin, 2015; Pakhtusova, 2011; Petrushina 2023; Rubtsova et al., 2023; Safiullin, Gubaidullina, 2020; Mustafakulov, 2017). The second approach has not yet worked out a single generally accepted methodology of evaluation based on econometric modeling.
In our study, we propose to consider the type of economic activity “Manufacturing industries”, the main branches of which are machine building; oil refining; food industry; metallurgy; chemical industry; wood processing; manufacturing of materials for construction; pulp and paper industry. Let us emphasize the features of this type of economic activity:
– the largest investment share in fixed capital and stable investment growth (Zolotareva, Zolotarev, 2022);
– leading role in the global economy (the authors analyze exports and imports of leading countries by GDP) (Abdikeev et al., 2019);
– state support (Fomina, 2015);
– competitiveness growth under the condition of realizing innovative factors (Safiullin, Gubaidullina, 2020).
According to the analysis of methodologies designed to assess the IA of the complex of manufacturing industries in the regions, scientists’ opinions on this issue are divided. The first group of authors (Bulgakova, 2004; Levchenko, 2023; Narolina, 2018, etc.) assesses investment attractiveness through an integral indicator formed by investment potential and investment risks. The second group (Abdikeev et al., 2019; Avezova et al., 2022; Klimova, Shapovalov 2017; Fomina, 2015) does it through the analysis and forecasting of indicators. The third group (Veretennikova, Rybina, 2011; Vorobyeva, Erokhina 2023; Rubtsova et al., 2023, etc.) assesses the IA through investments in fixed capital.
Let us dwell on the point of view of the second group of researchers and note that one of the problems of the IAtea(industry) assessment is the lack of systematization of factors and their statistical measurement. Table 2 presents the classification of factors concerning the IA of the complex of manufacturing industries, their statistical measurement, as well as the authors who highlight these factors.
We should say that the indicators characterizing the infrastructural and environmental factors are considered at the regional level. The political factor is considered at the country level; labor and financial factors – at the level of the TEA/industry in the region. A number of indicators of production and economic factors are represented by regional indicators due to the lack of statistical information at the level of the TEA/industry.
Based on the selected indicators, the study proposes a comprehensive approach to assessing the IA of the industry in the region. As a dependent variable we propose to use the indicator of investment activity in the region by type of economic activity – investment in fixed capital (Zolotarev Zolotareva, 2022; Korkin, 2023, etc.).
Table 2. Systematization of factors concerning investment attractiveness of the complex of manufacturing industries, their statistical measurement and use in further modeling
|
Factor, authors |
Indicators |
The factor is used in the model |
The reason why a factor is not used in the model |
|
Production (Abdikeev et al., 2019; Kalinina, Kalinina, 2016; Klimova, Shapovalov, 2019; Fomina et al., 2015 et al.) |
Own-produced goods shipped, work and services performed by own forces (TEA/industry in the region) |
+ |
|
|
Ratio of shipped products to manufactured products (TEA/ industry in the region) |
No data |
||
|
Labor productivity index (industry) |
No data |
||
|
Index of production (TEA/industry in the region) |
+ |
||
|
Fixed assets renewal ratio (regional) |
+ |
||
|
Degree of depreciation of fixed assets (TEA/industry in the region) |
No data |
||
|
Share of enterprise in the main production assets of the industry (TEA/industry in the region) |
No data |
||
|
Goods output index (TEA/industry in the region) |
No data |
||
|
Economics (Abdikeev et al., 2019; Kalinina, Kalinina, 2016; Klimova, Shapovalova, 2019; Nguen, 2012; Fomina, 2015; Chistov, Gazukin, 2013; Silva et al., 2023 et al.) |
Indices of physical volume of gross regional product in basic prices (regional) |
+ |
|
|
Foreign trade turnover by industry (TEA/industry in the region) |
No data |
||
|
Price index (TEA/industry in the region) |
+ |
||
|
Investments in fixed capital (TEA/industry in the region) |
+ |
||
|
Business confidence index (regional) |
No data |
||
|
Share of products of this industry in the country’s GDP (TEA/ industry in the region) |
No data |
||
|
Public investments volume in fixed capital of the industry (TEA/industry in the region) |
No data |
||
|
Preferential loan volume to the industry (TEA/industry in the region) |
No data |
||
|
Expenditures on technological innovation (TEA/industry in the region) |
+ |
||
|
Share of innovative products in commodity turnover (TEA/ industry in the region) |
No data |
||
|
Industry development dynamics (TEA/industry in the region) |
|||
|
Market capacity (TEA/industry in the region) |
No data |
||
|
Receipt of taxes and fees to the budgetary system of the Russian Federation by main types of economic activity (TEA/ industry in the region) |
+ |
||
|
Labor (Abdikeev et al., 2019; Avezova et al., 2022; Gajfullina, Nizamova, 2019; Kalinina, Kalinina, 2016; Fomina, 2015; Dorozynski et al., 2016; Kuna-Marsza t ek, 2017; Snie s ka, Zykiene, 2015; Windhyastiti et al., 2021 et al.) |
Share of employed in the industry in total employment in the country’s economy (TEA/industry in the region) |
No data |
|
|
Average number of employees in the industry (TEA/industry in the region) |
+ |
||
|
Quality and availability of skilled labor; high-productivity industry jobs (TEA/industry in the region) |
+ |
||
|
Index of average monthly nominal accrued wages (TEA/ industry in the region) |
+ |
||
|
Number of new jobs created (TEA/industry in the region) |
No data |
||
|
Ratio of wage arrears to labor remuneration fund (TEA/ industry in the region) |
End of Table 2
|
Factor, authors |
Indicators |
The factor is used in the model |
The reason why a factor is not used in the model |
|
Financial (Abdikeev et al., 2019; Avezova et al., 2022; Burlin, 2023; Gajfullina, Nizamova, 2019; Kalinina, Kalinina, 2016; Fomina, 2015; Mustafakulov, 2017 et al.) |
Profit on sales (TEA/industry in the region) |
A component of the financial result |
|
|
Financial result of profitable organizations of the industry (TEA/industry in the region) |
+ |
||
|
Profitability of sold goods, works, services (TEA/industry in the region) |
+ |
||
|
Return on assets (TEA/industry in the region) |
It depends on the profitability of sales; it is necessary to take into account the return on sales |
||
|
Accounts receivable of organizations (TEA/industry in the region) |
+ |
||
|
Accounts payable of organizations (TEA/industry in the region) |
+ |
||
|
Rate on loans and deposits (regional) |
No data |
||
|
Infrastructural (Kalinina, Kalinina, 2016; Fomina, 2015; Chistov, Gazukin, 2013; Windhyastiti et al., 2020 et al.) |
Share of public roads of local significance with hard surface in the total length of public roads of local significance (regional) |
+ |
|
|
Provision of preschool children with places in organizations engaged in educational activities under preschool education programs, babysitting and child care (regional) |
+ |
||
|
Number of teachers in organizations carrying out educational activities under educational programs of primary general, basic general, secondary general education (regional) |
+ |
||
|
Number of students enrolled in higher education programs – bachelor’s, specialist’s, master’s degree programs, per 10,000 population (regional) |
+ |
||
|
Number of hospital beds, end of year (regional) |
+ |
||
|
Investments volume in creation of new and/or development of existing engineering infrastructure facilities (regional) |
- |
||
|
Ecological (Varavin et al., 2023; Kondrat’eva, 2020; Silva et al., 2023 et al.) |
Air pollutant emissions from stationary sources (regional) |
+ |
|
|
Value of green capital investment (regional) |
No data |
||
|
Political ( Nguen, 2012; Pahtusova, 2011; Chistov, Gazukin, 2013; Silva et al., 2023; Windhyastiti et al, 2020 et al.) |
Stable political situation (country) |
No data |
|
|
Source: own compilation. |
|||
Research methods
The article proposes our methodology for calculating the aggregate coefficient of the industry IA in the region (hereinafter – coefficient). The task is to study the influence of factors on the investment inflow in the industry taking into account regional specifics and to identify significant parameters that will participate in the calculation of the coefficient.
To achieve the set goal, we developed the model of selecting the factors concerning the industry IA in the region. To determine the dependence, we selected the indicator of investment inflow by type of economic activity “Manufacturing industries” in Russia’s regions. For this purpose, we considered the actual data for the period 2010–2021. The methodology for calculating the coefficient includes several stages, each of which allows assessing various aspects affecting the industry attractiveness for investors.
Figure shows the algorithm for calculating the coefficient of the industry investment attractiveness in the region.
Algorithm for calculating our aggregate coefficient of the industry IA in the region
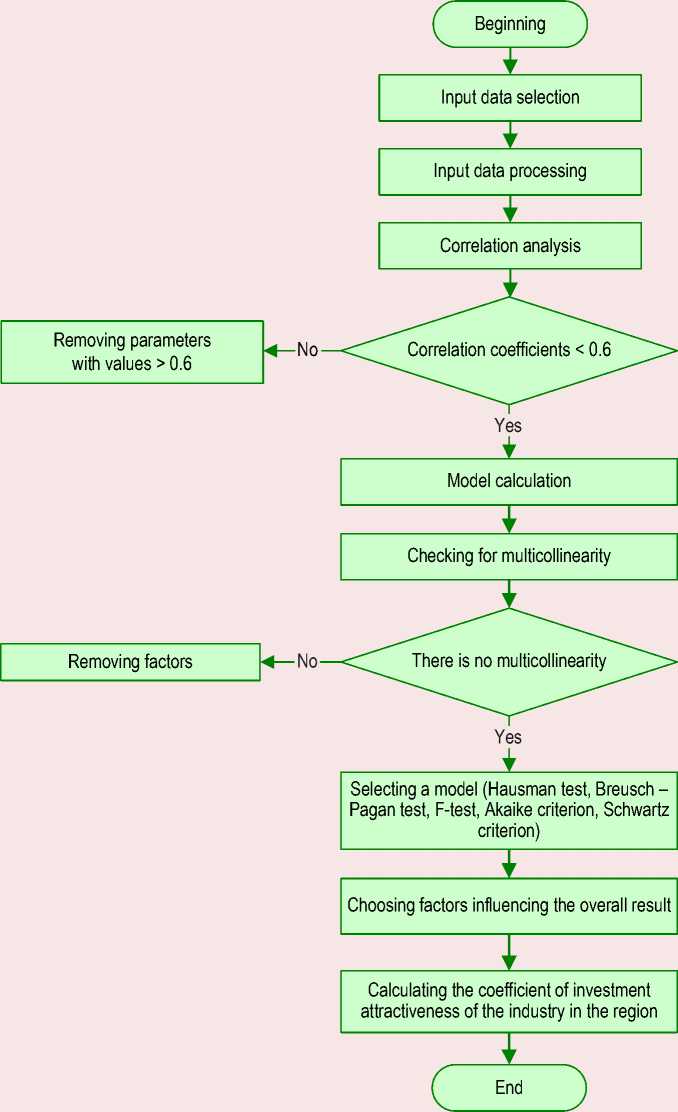
Source: own compilation.
Let us focus on the detailed description of the sequence of steps to be performed to achieve the research goal.
Step 1 : Selection and justification of indicators for the econometric model. The research carries out correlation analysis on the basis of the collected statistical data, previously taken into account when assessing the IA of the complex of manufacturing industries in the works of other authors. It is worth noting that the construction of the model is necessary to identify the most significant indicators of influence on the investment inflow in the manufacturing industry in the region, from which our index is subsequently calculated.
Step 2 : Input data processing. The indicators expressed in percentages remain unchanged, the rest are recalculated to improve the objectivity of the calculations.
Step 3 : Evaluation of indicators on the basis of correlation analysis. At this step, we constructed the correlation matrix, and assessed the dependence between all indicators, as well as between the indicators and the dependent variable. Then we selected the indicators for model building which satisfy all the conditions, namely, the value of the correlation coefficient should be < 0.6. The study made the estimation for two econometric models due to the fact that the indicators of profit and profitability, which initially correlate with each other, were chosen to measure the financial factor. Therefore, our aim is to choose the best model to measure the financial factor in addition to choosing the best model. Throughout the study two iterations of the model will be calculated and analyzed, subsequently one of them will be selected on the basis of the best model of the first and second iteration.
Step 4 : Checking indicators for multicollinearity.
Step 5 : Calculation of two econometric models to check for model validity (based on the Ramsey test).
Step 6 : Exclusion of insignificant variables by their p-value (significance level).
Step 7 : Testing the hypothesis about the impact of industry factors on the IA, building a new model (checking the correctness of the new model based on the Ramsey test).
Step 8 : Selection of the best model of the first and second iteration based on tests (F-test, Durbin– Wu–Hausman test, Breusch–Pagan test). The choice is made between fixed effects model, random effects model, fixed effects model with the addition of dummy variables, random effects model with the addition of dummy variables on the basis of the F-test, Durbin–Wu–Hausman test, Breusch– Pagan test.
Step 9 : Choosing between the first and second iteration of the model. Based on the Schwartz information criterion and Akaike information criterion, a decision is made to select the best model. The model in which the value of these criteria has the lowest value is recognized as the best model.
Step 10 : Ranking of indicators through their significance level based on the selected model.
Step 11 . Calculation of the aggregate IA coefficient of the industry in the region based on the selected model. We calculate the coefficient by finding the sum of the corresponding sub-indices with weights. The weight of the indicator is determined based on the level of significance of the indicator in the selected model.
The proposed methodology makes it possible to identify the significant factors regarding the IA of the complex of manufacturing industries in the regions, based on which an aggregated factor coefficient is obtained.
Research results
Based on the above, we developed a model for the selection of factors concerning the investment attractiveness of the complex of manufacturing industries.
The information basis included the information of the Federal State Statistics Service of the Russian Federation on 83 Russia’s regions for the period 2010–2021 for the selection of statistical indicators. Due to incomplete information, the following six regions did not participate in the calculations: the Republic of Crimea, the city of federal significance Sevastopol, the Donetsk People’s Republic, the Lugansk People’s Republic, the Zaporozhye Region and the Kherson Region.
After selecting the parameters to measure the factors (see Tab. 2), it is worth checking them for collinearity. The most important task in correlation analysis is to identify the relationship between variables. For this purpose, we constructed a correlation matrix. As a result of correlation analysis for the model of the first and second iteration, Table 3 presents the indicators we have chosen. The difference is that for the model of the second iteration the indicator X2 is excluded due to its correlation with X7.
Table 3. IA factors concerning the complex of manufacturing industries for model building
|
Factor |
Designation |
Description |
Measure |
Adjustment |
|
Production |
C |
Fixed assets renewal ratio (by region) |
% |
- |
|
V |
Shipped goods of own production, works and services performed by own forces (by types of economic activity) (TEA in the region) |
Thousand rubles |
Thousand rubles / number of industry enterprises in the region |
|
|
Economics |
I |
Expenditures of organizations on technological innovations (TEA in the region) |
Thousand rubles |
Thousand rubles / number of industry enterprises in the region |
|
Labor |
W1 |
Number of high-productivity jobs (TEA in the region) |
Places |
People / number of industry enterprises in the region |
|
W2 |
Average monthly nominal gross wages per employee for the full range of organizations (TEA in the region) |
Rubles |
- |
|
|
Financial |
R |
Level of profitability (unprofitability) of sold goods, products, works, services (TEA in the region) |
% |
- |
|
Pr |
Financial result of profitable organizations (TEA in the region) |
Thousand rubles |
Thousand rubles / number of industry enterprises in the region |
|
|
Infrastructure |
T |
Share of local public roads with hard surface in the total length of local public roads (by region) |
% |
- |
|
Ed |
Provision of preschool children with places in organizations engaged in educational activities under educational programs of preschool education, supervision and care of children. Number of teachers in organizations carrying out educational activities under educational programs of primary general, basic general, secondary general education. Number of students enrolled in higher education programs – bachelor’s, specialist’s and master’s degree programs, per 10,000 population (by region) |
Places for 1,000 children People People |
- Teachers per 10 thousand people |
|
|
H |
Number of hospital beds, end of year (by region) |
Units |
Bed capacity per 10,000 people |
|
|
Ecological |
Eco |
Air pollutants emitted from stationary sources (by region) |
Thousand ton |
Thousand ton per 10 thousand people |
|
Source: own compilation. |
||||
Next, we calculate multiple regression models and test the validity of the models based on the Ramsey test taking into account the selected indicators. The null hypothesis (H0) indicates that the model specification is correct (p-value > 0.05), the hypothesis (H1) indicates that the model specification is incorrect (p-value < 0.05). In our case, the model specification of the first and second iteration models is incorrect because p-values less than 0.05 indicate that the model is not a good fit. Due to the fact that it is important for us to show the influence of factors related to production activities, it was decided to exclude the infrastructure factor from the model.
Let us re-evaluate the models’ correctness. It proves that the specification of the models of the first and second iteration is correct, since the test values are greater than 0.05. Thus, the model includes the following factors of the IA of the complex of manufacturing industries: production, innovation, labor, financial, environmental.
Further, we estimated 4 models in each iteration: with fixed effects, with fixed time effects, with random effects, with random and time effects. We used Durbin–Wu–Hausman, Breusch–Pagan, and F-test were used to select the best model of the first and second iteration.
Thus, e selected the best model of the first and second iteration. In the first and second iteration, the best model was the model with fixed effects. Let us elaborate on the selected models and evaluate them (Tab. 4) .
When choosing the best model, we pay attention to the Schwartz information criterion (SIC) and the Akaike information criterion (AIC). The Schwartz information criterion (SIC) is (2052.96) and the Akaike information criterion (AIC) is (1631.27) for the profitability model. For the financial outcome model, the Schwartz information criterion (SIC) is (2053.23), the Akaike information criterion (AIC) is (1632.20). We should note that these criteria allow choosing the best model, the best one will be the model with the lowest value of the criterion. In our case, the model with profitability has less values than the model with profit, which allows making a choice in favor of the model with profitability.
Table 4. Detailed evaluation of the best models of the first and second iteration
|
Name of variable |
Fixed effects model |
Fixed effects model |
|
|
First iteration |
Second iteration |
||
|
Factor |
Const |
-8.54*** |
-10.19*** |
|
Regional data |
|||
|
Manufacturing |
С |
0.02** |
0.02** |
|
Ecological |
Ln(Eco) |
-0.09 |
-0.15 |
|
Industry data |
|||
|
Manufacturing |
Ln(V) |
0.32*** |
- |
|
Labor |
Ln(W1) |
0.27*** |
0.41*** |
|
Ln(W2) |
0.57*** |
0.93*** |
|
|
Innovative |
Ln(I) |
0.07** |
0.07** |
|
Financial |
R |
0.008* |
- |
|
Ln(Pr) |
- |
0.03 |
|
|
Number of observations |
N |
941 |
941 |
|
Determination coefficient |
R2 |
0.82 |
0.82 |
|
F-Fest |
p-calc. |
p=0 |
p = 0 |
|
Breusch–Pagan test |
p-calc. |
||
|
Durbin–Wu–Hausman test |
p-calc. |
||
|
Schwarz information criterion |
p-calc. |
2052.96 |
2053.23 |
|
Akaike information criterion |
p-calc. |
1631.27 |
1632.20 |
|
Source: own compilation. |
|||
Thus, we choose the best model (Formula 1).
ln(y it ) = a t + e*C it + Y * ln EcO it +
+ 5* lnVit + E* In W/1it + e* lnW2it + (1)
+ Z* lnIit + nRit* +uu, where i = 1.83 — number of region;
t = 2010.2021 — moments in time;
u it — random error, all U [t are independent and identically distributed;
uit~iid(0; o-2) ;
-
a t — fixed effect of region i ;
y – investments in fixed capital by type of economic activity “Manufacturing industries”.
Based on the obtained modeling results, we can conclude that when carrying out measures aimed at increasing the IA of the manufacturing industry in the regions, it is necessary to focus on fixed assets renewal ratio; air emissions of pollutants emitted from stationary sources; volume of shipped goods of own production, works and services performed by own forces by the industry; number of highly productive jobs by the industry; average monthly nominal accrued wages and salaries per worker; expenditures of industry organizations on technological innovations; profitability (unprofitability) rate of sold goods, products, works, services of industry enterprises.
We used the significant factors selected on the basis of the proposed model (Formula 1) to calculate the aggregate coefficient of industry investment attractiveness. We should note that the proposed coefficient is suitable for calculating the IA coefficient of industries belonging to the type of economic activity “Manufacturing industries”.
Aggregated index of industry investment attractiveness in the region (IAIir – index of investment attractiveness of the industry in the region) is calculated by finding the sum of the corresponding sub-indices with weights (Formula 2):
lAIir = ^ "=1 (X i , (2)
where x t — i -indicator, i = 1?n ;
-
n – total number of factors;
at — weight of i -factor, and Z "=i a i = 1, a i e [0,1] .
The unfolded formula is as follows (Formula 3):
IAHr = 0.14 *C , + 0.05 *Eco , +
+ 0.19 * Vt + 0.19 * W1t +
+ 0.19 * W2t + 0.14 * It + 0.1 * Et
First of all, the indicators for calculating the index for each region are brought to one scale by normalization. As part of data normalization, asymmetry was assessed. It is important to note that we used the formula of inverse normalization for the environmental factor.
The weight of each indicator is determined depending on the weight of importance of each factor in the model (Tab. 5) .
Table 5. Determination of the weight of IA factors of the complex of manufacturing industries in the regions
|
Factor |
Taxonomic unit |
Indicator |
Level of significance |
Weight |
|
Manufacturing |
Region |
x2 |
(3%)** |
0.14 |
|
Ecological |
Region |
x9 |
- |
0.05 |
|
Manufacturing |
Industry |
x10 |
(1%)*** |
0.19 |
|
Labor |
Industry |
x11 |
(1%)*** |
0.19 |
|
x12 |
(1%)*** |
0.19 |
||
|
Innovative |
Industry |
x13 |
(3%)** |
0.14 |
|
Financial |
Enterprise |
x14 |
(5%)* |
0.10 |
|
- |
- |
Sum |
- |
1.00 |
The weight of the factors is determined based on the p-value (significance level) presented in Table 2. Source: own compilation.
Table 6. Aggregated coefficients of investment attractiveness of the type of economic activity “Manufacturing industries” by constituent entities of the Russian Federation (first and last five positions in the rating), 2021
|
Rating |
Region |
IAIir index |
|
1 |
Murmansk Region |
0.80 |
|
2 |
Krasnoyarsk Territory |
0.67 |
|
3 |
Omsk Region |
0.65 |
|
4 |
Archangelsk Region |
0.63 |
|
5 |
Perm Territory |
0.61 |
|
79 |
Chechen Republic |
0.24 |
|
80 |
Republic of Tyva |
0.20 |
|
81 |
Republic of Kalmykia |
0.19 |
|
82 |
Republic of Altai |
0.18 |
|
83 |
Republic of Ingushetia |
0.17 |
|
Source: own compilation. |
||
Thus, we present our approach to the calculation of the aggregate factor coefficient of IA of the complex of manufacturing industries in the regions.
Table 6 shows the indices of investment attractiveness of the “Manufacturing industries” sector calculated by the constituent entities of the Russian Federation for 2021.
Based on the calculations in 2021, the highest value of the IA coefficient for the TEA “Manufacturing production” is in the Murmansk Region, the Krasnoyarsk Territory, the Omsk Region, the lowest – in the regions of the North Caucasus. We should note that the aggregate coefficient of the IA is measured from 0 (min) to 1 (max). Consequently, we can say that the IA of the manufacturing industry in the Murmansk Region has a value close to 1, which indicates a high level of the IA of the manufacturing industry in this region. It means that the complex of manufacturing industries has a high level of manufacturing, labor, innovation, financial factors with a low environmental load and will be interesting for potential investors.
The proposed approach to assessing the IA of the complex of manufacturing industries can be used by investors, private or public, who, guided by these coefficients, will make informed decisions about the feasibility of investment in the manufacturing industries of a particular region.
This assessment can also be an integral part of the system of information and analytical monitoring of economic development to ensure managerial decision-making at the level of the regional system as a whole.
Conclusion
In conclusion, we should note that the study of the IAtea(industries) is of particular interest for attracting investment in strategically important sectors of the Russian economy. Currently, there is a problem of the lack of a comprehensive unified approach to assessing the IAtea(industries), so the research proposed a methodology for calculating our coefficient of investment attractiveness of the complex of manufacturing industries. The calculations are based on the data on the type of economic activity “Manufacturing industries” in Russia’s regions. For instance, the proposed methodology can be adapted to calculate the IA coefficient of industries related to this type of activity, which allows expanding its application. The developed IA coefficient of the manufacturing industry makes it possible to identify the most promising regions for investment in the manufacturing industry. The methodology will allow increasing the regulatory support of investment activity, to rank priorities in the selection of investment projects, to determine the mechanisms of support for investment activity of the manufacturing industry in the region, to develop a more reasonable industrial passport of the region. When using the proposed methodology, the investor has the opportunity to narrow down the range of objects for investment, focusing on the most attractive regions of location of manufacturing industry enterprises.
It is important to note that the proposed coefficient is an intermediate research result and will be used in conjunction with the region’s industrial profile to rank the IA of the industry in the region.
The direction of further research is the development of a software product for calculating the index of the investment attractiveness of the industry in the region with visualization. The assessment of the IA of industries is an important and urgent task of harmonious development of the national economy.
References An approach to modeling the investment attractiveness of the industry in the regional aspect
- Abdikeev N.M., Bogachev Yu.S., Bekulova S.R. (2019). Investment potential of the manufacturing industry. Finansy: teoriya i praktika=Finance: Theory and Practice, 23, 4(112), 24–42. DOI: 10.26794/2587-5671-2019-23-4-24-42 (in Russian).
- Avezova M.M., Urunov A.A., Nasimova N.A. (2022). Investment attractiveness of the region’s development pole: Methodology and analysis. Upravlenie=Management, 10(1), 28–35. DOI: 10.26425/2309-3633-2022-10-1-28-35 (in Russian).
- Binda J., Prokopenko M., Ramskyi A., Shuplat O., Halan L., Mykhaylenko D. (2020). Assessment of investment attractiveness of industrial enterprises. International Journal of Management, 11(2), 27–35.
- Bulgakova L.N. (2004). Methods for assessing the investment attractiveness of enterprises and regions. Finansy i kredit, 15(153), 57–62 (in Russian).
- Burlin E.B. (2023). Assessment of the investment attractiveness of the corporation. Vestnik evraziiskoi nauki, 15(S1) (in Russian).
- Chistov I.V., Gazukin A.V. (2013). Investment appeal of branches and industry enterprises: Essence and factors, it defining. Transportnoe delo Rossii=Transport Business in Russia, 1, 134–137 (in Russian).
- D’yachkova O.M., Zhevtun I.F. (2023). Features of investment attractiveness assessment and formation of investment climate in the region. Vestnik Akademii znanii, 3(56), 88–93 (in Russian).
- Dorożyński T., Kuna-Marszałek A. (2016). Investment attractiveness. The case of the visegrad group countries. Comparative Economic Research, 19(1), 119–140.
- Elokhova I.V., Plotnikov R.V. (2023). Theoretical aspects of forming and assessing investment attractiveness of economic systems. Vestnik Permskogo natsional’nogo issledovatel’skogo politekhnicheskogo universiteta. Sotsial’no-ekonomicheskie nauki=PNRPU Sociology and Economics Bulletin, 3, 199–212. DOI: 10.15593/2224-9354/2023.3.14 (in Russian).
- Fomina N.E. (2015). Analysis of competitiveness and investment attractiveness of the national manufacturing industry. Transportnoe delo Rossii=Transport Business in Russia, 2, 68–71 (in Russian).
- Gaifullina M.M., Nizamova G.Z. (2021). Correlation and regression analysis of the investment attractiveness of the petroleum refining industry. Upravlenie=Management, 9(3), 27–38. DOI: 10.26425/2309-3633-2021- 9-3-27-38 (in Russian).
- Jantoń-Drozdowska E., Majewska M. (2016). Investment attractiveness of Central and Eastern European Countries in the light of new locational advantages development. Equilibrium. Quarterly Journal of Economics and Economic Policy, 11(1), 97–119.
- Kalinina A.E., Kalinina V.V. (2016). Development of information and analytical system of the assessment of investment appeal of regions of the Russian Federation. Vestnik Volgogradskogo gosudarstvennogo universiteta. Seriya 3: Ekonomika. Ekologiya, 2(35), 7–17. DOI: 10.15688/jvolsu3.2016.2.1 (in Russian).
- Klimova N.V., Shapovalova G.I. (2017). Investment attractiveness of the Krasnodar Region’s food industry. Politematicheskii setevoi elektronnyi nauchnyi zhurnal Kubanskogo gosudarstvennogo agrarnogo universiteta, 127, 638–650. DOI: 10.21515/1990-4665-127-043 (in Russian).
- Kondratyeva O.A. (2020). The influence of the environmental factor on the investment attractiveness of an industrial enterprise. In: Rozov D.V., Skvortsova G.G. (Eds.). Sovremennoe sostoyanie ekonomicheskikh sistem: ekonomika i upravlenie: sbornik nauchnykh trudov II Mezhdunarodnoi nauchnoi konferentsii, Tver’, 23–24 marta 2020 goda [Modern State of Economic Systems: Economics and Management: Collection of Scientific Proceedings of the 2nd International Scientific Conference, Tver, March 23–24, 2020] (in Russian).
- Korkin M.A. (2023). Investment attractiveness of the Russian manufacturing industry under sanctions and restrictions. Vestnik universiteta, 3, 144–152. DOI: 10.26425/1816-4277-2023-3-144-152 (in Russian).
- Kovaleva I.V. (2014). To the issue of methodology and methods of investment attractiveness evaluation. Vestnik Altaiskogo gosudarstvennogo agrarnogo universiteta, 5(115), 166–170 (in Russian).
- Levchenko T.A. (2023). Investment attractiveness of Russia’s Far Eastern regions: Assessment and provision. Azimut nauchnykh issledovanii: ekonomika i upravlenie, 12, 1(42), 63–66. DOI: 10.57145/27128482-2023-12-01-12 (in Russian).
- Milovanova E.A., Kuz’menko T.V. (2007). Forecast estimates of investment attractiveness of the industry. Ekonomicheskii analiz: teoriya i praktika, 7(88), 31–34 (in Russian).
- Mustafakulov S. (2017). Investment attractiveness of regions: Methodic aspects of the definition and classification of impacting factors. European Scientific Journal, 13(10), 433–449.
- Narolina Yu.V. (2010). Influence of investment markets on investment activity of region (on example of Voronezh region). Vestnik Tambovskogo un-ta. Seriya: Gumanitarnye nauki, 12(92), 426–429 (in Russian).
- Nguen T.T. (2012). Factors affecting the investment attractiveness of the supporting industry in Vietnam. Izvestiya Tul’skogo gosudarstvennogo universiteta. Ekonomicheskie i yuridicheskie nauki, 2-1, 150–157 (in Russian).
- Pakhtusova M.Yu. (2011). Investment attractiveness of the industry: The basis for innovative development of the region. Ekonomika i upravlenie, 7(69), 35–38 (in Russian).
- Petrushina V.V. (2023). Import substitution in the conditions of the Russian economy. Nauka i praktika regionov, 3(32), 28–33 (in Russian).
- Rubtsova S.N., Pakhomova T.V., Sleptsova L.A. (2023). The need to assess the investment attractiveness of agricultural enterprises. Russian Economic Bulletin, 6(2), 93–99 (in Russian).
- Safiullin A.R., Gubaidullina A.I. (2020). Modeling scenarios for increasing the investment attractiveness of the processing industry of the Republic of Tatarstan. Nauchno-tekhnicheskie vedomosti SPbGPU. Ekonomicheskie nauki=St. Petersburg State Polytechnical University Journal. Economics, 13(4), 74–82. DOI: 10.18721/JE.13406 (in Russian).
- Silva W.D.O., Fontana M.E., de Almeida B.M.J., Carmona Marques P., Vidal R. (2023). Analyzing the attractiveness of businesses to receive investments for a creative and innovative transition to a circular economy: The case of the textile and fashion industry. Sustainability, 15, 1–18.
- Snieška V., Zykiene I. (2015). City attractiveness for investment: Characteristics and underlying factors. Procedia – Social and Behavioral Sciences, 213, 48–54. DOI: 10.1016/J.SBSPRO.2015.11.402
- Sviridova N.D., Koz’yakova S.S., Teslyuchenko O.N. (2022). Formation of investment attractiveness under the influence of a system of factors. Vestnik Luganskogo gosudarstvennogo universiteta imeni Vladimira Dalya, 9(63), 139–141 (in Russian).
- Vanyushkin A.S. (2015). Analysis of investment attractiveness of the sectors of the Crimean economy. Obshchestvo: politika, ekonomika, pravo, 6, 21–29 (in Russian).
- Varavin E.V., Kozlova M.V., Kuur O.V., Pestunova G.B. (2023). Assessment of investment attractiveness of regional industries in the context of green development. Ekonomika regiona=Economy of Regions, 19(2), 494–510 (in Russian).
- Veretennikova O.B., Rybina E.S. (2011). Investment attractiveness of the industry and approaches to its assessment. Korporativnoe upravlenie i innovatsionnoe razvitie ekonomiki Severa: Vestnik Nauchno-issledovatel’skogo tsentra korporativnogo prava, upravleniya i venchurnogo investirovaniya Syktyvkarskogo gosudarstvennogo un-ta, 4, 6 (in Russian).
- Vorob’eva V.E., Erokhina E.V. (2023). Investment attractiveness and investment climate of the Kaluga Region in the new reality. Vektor ekonomiki, 5(83) (in Russian).
- Windhyastiti I., Hidayatullah S., Khouroh U. (2021). Investment attractiveness rating and factors affecting. Growing Science, 7, 161–166. DOI: 10.5267/j.ac.2020.10.001
- Zolotareva E.L., Zolotarev A.A. (2022). Analysis of investment activity trends in the region. Vestnik Kurskoi gosudarstvennoi sel’skokhozyaistvennoi akademii, 7, 226–231 (in Russian).
