An Architecture for Alert Correlation Inspired By a Comprehensive Model of Human Immune System

Author: Mehdi Bateni, Ahmad Baraani
Journal: International Journal of Computer Network and Information Security(IJCNIS) @ijcnis
Article in issue: 12 vol.6, 2014.
Free access
Alert correlation is the process of analyzing, relating and fusing the alerts generated by one or more Intrusion Detection Systems (IDS) in order to provide a high-level and comprehensive view of the security situation of the system or network. Different approaches, such as rule-based, prerequisites consequences-based, learning-based and similarity-based approach are used in correlation process. In this paper, a new AIS-inspired architecture is presented for alert correlation. Different aspects of human immune system (HIS) are considered to design iCorrelator. Its three-level structure is inspired by three types of responses in human immune system: the innate immune system's response, the adaptive immune system's primary response, and the adaptive immune system's secondary response. iCorrelator also uses the concepts of Danger theory to decrease the computational complexity of the correlation process without considerable accuracy degradation. By considering the importance of signals in Danger theory, a new alert selection policy is introduced. It is named Enhanced Random Directed Time Window (ERDTW) and is used to classify time slots to Relevant (Dangerous) and Irrelevant (Safe) slots based on the context information gathered during previous correlations. iCorrelator is evaluated using the DARPA 2000 dataset and a netForensics honeynet data. Completeness, soundness, false correlation rate and the execution time are investigated. Results show that iCorrelator generates attack graph with an acceptable accuracy that is comparable to the best known solutions. Moreover, inspiring by the Danger theory and using context information, the computational complexity of the correlation process is decreased considerably and makes it more applicable to online correlation.
Alert Correlation, Intrusion Detection System (IDS), Artificial Immune System (AIS), Danger Theory
Short address: https://sciup.org/15011368
IDR: 15011368
Text of the scientific article An Architecture for Alert Correlation Inspired By a Comprehensive Model of Human Immune System
Published Online November 2014 in MECS DOI: 10.5815/ijcnis.2014.12.06
Intrusion detection is the process of identifying and (possibly) responding to malicious activities targeted at computing and network resources [1]. The system that runs this process is named Intrusion Detection System (IDS). When an IDS detects a malicious activity, it generates an alert. The alert is usually in low-level format. It means that the alert contains a little information about the malicious activity and it is almost useless for system administrator. An IDS in a large network of computers with many different users generates high volumes of raw alerts. These alerts overwhelm the system administrator in such a way that she/he cannot use them effectively. As a result, the administrator may ignore alerts and miss their possible related intrusions. Alert correlation is used to overcome this problem. Alert correlation has two main goals: reducing the number of alerts and increasing the relevance and abstraction level of the produced reports [2]. An alert correlator usually carries out its job by aggregating related alerts, removing false alerts and prioritizing alerts.
Different approaches are used in alert correlation process. A number of them use stored information such as rules for correlation or prerequisites and consequences information for each alert type. The correlater uses this kind of information to relate different steps of attacks. Some other approaches use machine learning methods to learn the scenario of different attacks by using training data. Subsequently, the system employs learned data to process new alert streams. There are also approaches that use similarity measures to fuse similar alerts and to reduce the volume of alerts.
Both in rule-based and prerequisites consequences-based correlation a pool of proper information is needed to define the rules for relating different alerts and generating high-level scenarios. Both methods need thousands of rules or preconditions and post conditions information to correlate attacks. Moreover, they are not able to correlate new attacks. In learning-based correlation, different attack scenarios are provided as training data to a machine learning algorithm. The system learns the steps of the different attacks and their order and, uses this information to process real attacks. It needs proper training data and needs more computational efforts during correlation process.
In this paper a new AIS-inspired alert correlator named iCorrelator is presented. It is an extended version of the correlator that is presented in our previous work [3]. It employs many concepts of the Artificial Immune System (AIS) [4] to discover and learn the degree of correlation between two alerts and, uses this knowledge to extract the attack scenarios. iCorrelator uses a combination of predefined fuzzy rules and dynamic learning-based solution. Moreover, it uses the concept of secondary response in immune system and also some concepts of Danger theory [5] to improve the performance of the system. In this new version of iCorrelator the concepts of danger and safe signals from Danger theory are used. By processing the alert stream, iCorrelator can assign a label to current time slot as Relevant (dangerous) or Irrelevan t (safe) slot. More processing effort is used for the alerts of the Relevant time slots and less processing effort is used for the alerts of Irrelevant time slots.
iCorrelator is a three-level alert correlator. In order to correlate two alerts, it makes a cell from them and assigns a correlation probability to the cell. The correlation probability assignment process for each cell is a serial process. Firstly, the cell is investigated against the rules. If it finds the accurate-enough rule, then the correlation probability is determined by that rule. If there is not such rule, then the immune memory cells are investigated to find a memory cell similar to the cell. If there is such memory cell, then the correlation probability is determined by the value that is stored in the memory cell. If there is not proper memory cell, then the learningbased process is considered, and the output of the AIRS algorithm [6] determines the correlation probability.
The rest of the paper is organized as follows. Section 2 presents the related works. Section 3 describes the human Immune System (HIS), its layers and, the Danger theory. Section 4 presents the iCorrelator, its components and, the new selection policy. Section 5 reports the result of running the system with the DARPA2000 and netForensics honeynet data. Finally, section 6 provides a brief summary and conclusion.
-
II. Related Works
As mentioned before, alert correlation has two main goals: reducing the number of alerts and increasing the relevance and abstraction level of the produced reports. Commonly used techniques for alert correlation can be categorized as Fusion-based, Filter-based and Causalitybased. Fusion-based correlation is based on the similarity between two alerts. It defines a function for similarity and looks for alerts that are similar. If the similarity value is more than some threshold, alerts are placed in one cluster. Filter-based approaches either identify the false positive and the irrelevant alert or assign a priority to each alert. For instance, an alert could be classified as irrelevant if it represents an attack against a non-existent service.
Priorities are usually assigned to alerts depending on how important attacked assets are. Causality-based approaches use the logical relationships between alerts to correlate them. They either use the knowledge of experts to find related alerts or aim to infer it from the statistical or machine learning analysis. Because our work is more related to the causality-based approach, we focus on the works that use this approach.
There are several causality-based approaches that use known scenarios to find relationships among alerts. They match the sequence of incoming events with some predefined scenarios. These scenarios should be defined by an attack language (e.g., STATL [7], LAMDBA [8], ADeLe [9]) or learned using machine learning techniques[10][11]. Specifying all scenarios in advance is time-consuming and error-prone work and needs a deep knowledge of the domain. Moreover, it has problem with the new attack pattern. Wang et al. proposed a multi-step attack pattern discovering method that aims at solving the problems of new attack pattern discovery and overcoming the difficulty in complex attack association rule definition and maintenance. They mine multi-step attack activity patterns with the attack sequential pattern mining method from history aggregated high-level alerts. Their method requires good integration of history database, which should include various multi-step attack instances.
Another type of causality-based correlation systems uses the rule-based correlation approach [12][13][14]. They rely on the fact that complex attacks are usually executed in several phases or steps, where the first step prepares for attacks executed in the later steps. Each step of the attack has its prerequisites and consequences. Thus, analyzing alerts based on the predefined rules containing prerequisites and consequences of the attack steps is sufficient to identify related alerts.
Both scenario-based and rule-based approaches rely on expert knowledge to find related alerts and cannot handle novel attacks. Statistical approaches [15][16][17][18] analyze relationships among alerts based on their cooccurrence within a certain time period, and thus, are generally independent of the prior domain knowledge.
Qin [15] presented a Bayesian correlation engine for discovering the statistical relation between alerts. They analyze statistical patterns among aggregated alerts, with the assumption that alerts are causally related if a strong statistical correlation exists among them. The degree of relevance of alerts is evaluated by calculating the conditional probability among each pair of hyper alerts. The approach builds an attack scenario by evaluating the causal relationship between each pair of hyper alerts. Because of the large number of possible combinations between hyper alerts, the running of the system in online mode is infeasible.
Ren et al. [16] presented an approach for adaptive online alert correlation. The approach incorporates two components: the offline module that is responsible for retrieving relevant attack information from the previously observed alerts based on the Bayesian causality mechanism; and the online component that is based on the extracted information. It correlates raw alerts and constructs attack scenarios online.
There are other works that use machine learning algorithm to estimate the correlation probability among alerts and use it in correlation time. Zhu et al. [17] used Multilayer Perceptron and Support Vector Machines to estimate the alert correlation probability, and Sadoddin et al. [18] used the frequent structure mining technique. All statistical and machine learning-based approaches do not require expert knowledge and are capable of representing unknown attacks. However, the most important drawback is their high computational cost, which makes them impractical for online computation.
An AIS-inspired alert correlation architecture named iCorrelator is introduced in [3]. In this architecture, three layers of correlation are considered. These layers are inspired by three types of responses in human immune system: innate immune response, primary adaptive immune response and secondary adaptive immune response. This work does not use concept of Danger theory and context information. In the new version of iCorrelator that is introduced in present paper a more comprehensive model of human immune system for alert correlation is provided by considering the concept of Danger theory.
-
III. Human Immune System
Immunologists like to describe the immune system as consisting of two parts, namely the innate immune system and the adaptive (acquired) immune system. It was originally thought that these were two distinct subsystems with little crossover, with the innate system responding to known threats, and the adaptive immune system tackling previously un-encountered threats. However, current research suggests that it is the interplay between these two systems that provides the high level of protection required, i.e. the ability to discriminate between self and nonself entities.
-
A. Innate Immune System
The innate immune system comprises the cells and mechanisms that defend the body from infection by pathogens in a non-specific manner. This means that the cells of the innate system recognize and respond to pathogens in a generic way, but unlike the adaptive immune system, it does not confer long-lasting or protective immunity. Innate immune systems provide immediate defense against infection. It evolved genetically, and we are born with it, and it doesn’t change or adapt during our life. The innate immune system identifies and removes the foreign substances present in organs, tissues, the blood and lymph, by specialized white blood cells. It initiates and directs the response of the adaptive immune systems. It also provide the time for the acquired immune system's reaction [19].
-
B. Adaptive Immune System
The adaptive (acquired) immune system provides the vertebrate immune system with the ability to recognize and remember specific pathogens (to generate immunity), and to mount stronger attacks each time the pathogen is encountered. It is adaptive immunity because the body's immune system prepares itself for future challenges. The adaptive immune system consists of B-Cells and T-Cells (lymphocytes) that are able to adapt to, and to learn the structure of new pathogens. Each cell in this system is able to adapt with a specific pathogen and learn its features. The process of adaptation is done by matching between receptors on the surfaces of the lymphocytes and the epitops on the surfaces of the pathogens. After each proper matching the matched cell is cloned. The number of clones is in proportion to the strength of match. The higher the strength of match is the more the number of clones is. During the cloning process, mutation is done, and if the mutated clone matches stronger, then it will be cloned more and more. During this process a specialized cell for the encountered pathogen is evolved by the immune system (primary response). After generating the specialized cell, it is transformed to the memory cell. The memory cells are stored for future use and create the immunity against the encountered pathogen (secondary response) [19].
-
C. Danger Theory
The central idea in the Danger Theory [5] is that the immune system does not respond to nonself but to danger. Thus, just like the self-nonself theories, it fundamentally supports the need for discrimination. However, it differs in the answer to what should be responded to. Instead of responding to foreignness, the immune system reacts to danger. In this theory, danger is measured by damage to cells indicated by distress signals that are sent out when cells die an unnatural death. A cell that is in distress sends out an alarm signal. Antigens in the neighborhood are captured by antigen-presenting cells such as macrophages, which then travel to the local lymph node and present the antigens to lymphocytes. Essentially, the danger signal establishes a danger zone around itself. Thus B cells producing antibodies that match antigens within the danger zone get stimulated and undergo the clonal expansion process. Those that do not match or are too far away do not get stimulated. Danger theory proposes that the immune system is sensitive to changes in the danger signal concentration in the tissue. It consists of active suppression while the tissue is healthy (apopotosis), combined with rapid activation on receipt of necrotic danger signals [20].
-
IV. Proposed Architecture
ICorrelator is an immune-based architecture for alert correlation [3]. Its goal is to assign the correlation probability to each pair of input alerts. Three layers of correlation are used in its architecture: rule-based correlation, learning-based correlation and memory-based correlation. Fig. 1 shows the architecture and components of the iCorrelator. Three different correlation probability assignments are seen in the figure as the output of Fuzzy rule matcher, Extended AIRS and Euclidean cell matcher.
There are also a collection of acquired knowledge, a cell generator, an attack graph generator, a context information extractor and an alert selection policy manager.
A cell in iCorrelator is a feature vector, which contains some useful information of two alerts. Each input alert first go through the cell generator unit. Cell generator needs another input alert to make a cell. This alert is provided by the alert selection policy module by searching among previous alerts. Therefore, for each new alert ai a number of previous alerts are selected and presented to cell generator unit. By employing ai and each selected alert a new cell is generated and is passed to probability assignment process.
During its work, iCorrelator extracts some useful information from alert stream and convert them to the proper form. Three matrices are used to store this acquired information from previous alerts during processing of alert stream: the Alert Correlation Matrix (ACM), the forward correlation strength matrix ( П f ) and the backward correlation strength matrix ( ПЬ ). The following equations are used to calculate the elements of ACM; forward and backward strength matrices [17].
wc (al,aj ) = Z^ pPU№
]-[/ _ WC (ai,aj)
П c( a I, a) ) "s^w^t) b _ wc(^ai,aj)
nc(al,aj) "z^W c^»
The ACM elements are the correlation weights of two corresponding alerts ( ai and a j ) and are the sum of correlation probabilities for two alerts during the correlation process. Two strength matrices' elements are calculated by using ACM elements. Forward correlation strength matrix can be used to predict the correlation probability of one alert to another alert that happens after it. It will be used for generating the attack graph later. On the other hand, backward correlation strength matrix can be used to find the correlation probability of one alert with another alert that happened before it. Both matrices initially are filled with zero, and after each correlation ACM, П f and П Ь matrices are changed. These matrices play the role of some sort of memory or acquired knowledge for the correlation system.
Suppose that a1 and a2 are two alerts, and a1 was produced before a 2 . Six features of two alerts are chosen to produce a feature vector (cell). Four of them are calculated directly from two alerts, and two of them are extracted from the previously acquired knowledge that is stored in the ACM, Пf and Пb . Selected features are as below [17].
F1 : Source IP similarity for a1 and a2 ([0-1])
F2 : Destination IP similarity for a1 and a2 ([0-1])
F3 : Destination port of a1 =Destination port of a2 (0 or 1) F4 : Destination IP of a1 = Source IP of a2 (0 or 1) F 5 : Backward strength for alert types a 1 and a 2 ([0-1]) F6 : Correlation frequency for alert types a1 and a2 ([01])
Therefore, a cell is a feature vector with six features and a probability of correlation, which is assigned two cells during the correlation process. For each new alert ai a number of previous alerts are selected and presented to cell generator unit by alert selection policy manager. The alert selection policy defines the scope and method of the search in previous alerts to select a proper alert. Each new alert probably is correlated with few previous alerts and is inserted into a structure called hyper-alert. Each hyperalert contains alerts with some degree of correlation that could be placed in a possible attack scenario [3].
As mentioned before, alert selection policy module is responsible to provide some previous alerts for correlation with current alert [3]. Different alert selection policy such as select all [17], Random [21] and Random Directed Time Window (RDTW) [3] is used in different researches. In current version of iCorrelator a new alert selection policy named Enhanced Random Directed Time Window (ERDTW) [22] is introduced. Its aim is to decrease the computational complexity of the correlation process without decreasing its accuracy. It realizes this aim by decreasing the number of selected alerts and by selecting the alerts more wisely. By using this new more targeted selection policy, more alerts are selected for processing during dangerous time slots and less alerts are selected during safe time slots. Some context information is used to assign a label of Relevant (dangerous) or Irrelevant (safe) to each time slot.
iCorrelator assigns a correlation probability to each cell, c . This probability is the probability of correlation for two alerts that make cell c . Three layers of correlation are used to assign a correlation probability to a cell: rulebased correlation layer (fuzzy rule matcher), learningbased correlation layer (extended AIRS) and memorybased correlation layer (Euclidean cell matcher). The correlation probability assignment process for each cell is a serial process. Algorithm 1 outlines the overall process of alert correlation through three layers of correlation.
Algorithm 1. A top level view of iCorrelator’s operation
Input : A stream of input alert
Output : A collection of hyper-alerts
-
1: while (( a = read next alert from input)≠NULL)
-
2: MAX_CP=0
-
3: while (( b = get an alert from alert selection)≠NULL)
-
4: c = GenerateCell( a, b )
-
5: Pass c to the first layer of correlation
-
6: if (Exists an accurate-enough rule such as R for c )
-
7: CP is assigned by R
-
8: else Pass c to the third layer of correlation
-
9: if (Exists an accurate memory cell such as MC for c )
-
10: CP is assigned by MC
-
11: else Pass c to the second layer of correlation
-
12: CP is assigned by Learning based layer
-
13: if ( CP > MAX _ CP )
-
14: MAX_CP= CP
-
15: end while
-
16: if ( MAX_CP > Correlation Threshold )
-
17: add a to Hype-alert containing MAX_CP alert
-
18: Update all information containing matrices
-
19: else
-
20: Make a new hyper-alert and add a to it
-
21: end while
-
22: return Generated Hyper-alerts
Firstly, a limited number of general rules, which are defined in set up time, are used. These rules are some typical cases and are used by iCorrelator in order to enjoy the simplest correlation relationships. The antecedent part of a rule contains six features and their corresponding values, and its consequent part contains a class number. These six features are calculated by considering a pair of alerts and their similarity. iCorrelator searches the rules to find the most compatible rule with the current pair of alerts and uses the class number in the consequent part of the rule to calculate the correlation probability of the pair. There are a limited number of fixed and general rules in this layer. Thus, the response in this layer is rapid and accurate (if it finds a compatible rule). This mechanism is comparable to the fixed, rapid and accurate response of the innate immune system.
Secondly, if iCorrelator does not find a compatible rule, then the next layer of correlation (memory-based) is used. In this layer, a pool of previously generated immune memory cells is explored for a cell similar to the current cell. The cells in the pool have been generated by learning-based layer during the previous correlation processes. In fact, each immune memory cell contains one previous correlation experience. The content of the pool of immune memory cells is updated dynamically. Each new correlation generates a new cell and it will be added to the pool. Using these immune memory cells by iCorrelator is comparable to the secondary response in the adaptive immune system. The correlation process in this layer is dynamic and rapid.
Finally, if iCorrelator does not find a matching cell in the pool of immune memory cell, then AIRS [6] is used to calculate the correlation probability. AIRS is an AISbased algorithm [4]. It is a supervised learning algorithm and uses the same aforementioned general rules as input and generates some memory cells for them. These memory cells are used to classify new cells. The process of generating memory cells in AIRS is an evolutionary process that is inspired by the primary response in the adaptive immune system.
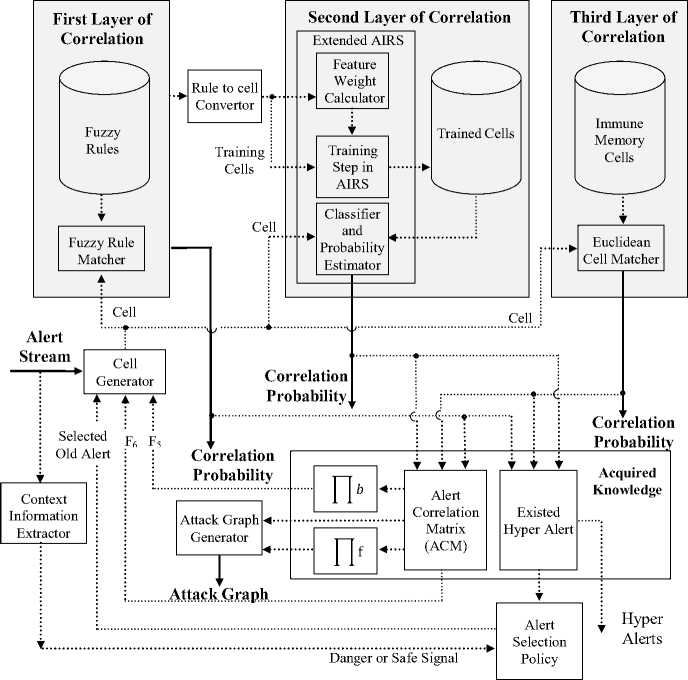
Fig. 1. Architecture and components of iCorrelato
The calculated probability and the generated cell in the learning-based layer are stored in the pool of immune memory cells for future usages. It is important to differentiate between the immune memory cells which are placed in the pool of immune memory cells and the memory cells which are used in the AIRS algorithm. The memory cells in AIRS are generated in an evolutionary process by considering the rules which are in the rule- based layer. On the other hand, immune memory cells are the memory of the system from its correlation experience in learning-based layer.
The most important output of correlation process is the attack graph of the occurring attack. The attack graph is a directed graph that shows the overall scenario of an attack, and it contains one node for each alert type. By using the attack graph, it is possible to have an overall and concise view of the attack scenario. As mentioned before, П f matrix is generated during the correlation process, and it is used in attack graph generation. More detail information about the function of each part of iCorrelator is presented in our previous work [3]. The main difference of the present work and our previous work is the usage of Danger theory concepts such as Safe and Danger signals to develop a new alert selection policy named Enhanced Random Directed Time window (ERDTW). In the next three subsections this new alert selection policy is described in more details.
-
A. Enhanced Random Dircted Time Window (ERDTW)
As mentioned before, alert selection policy module is responsible to provide some previous alerts for correlation with current alert. Different alert selection policy such as select all [17], Random [21] and Random Directed Time Window ( RDTW ) [3] is used in different researches. Like Random and Random Directed Time Window ( RDTW ), ERDTW uses a limited time window which contains several sliding time slots. Only the alerts that are occurred during this time window are considered for correlation with current alert and the older alerts, which are out of time window are ignored. Two influential parameters determine the performance and accuracy of this selection policy. The number of time slots in the time window, n and the width of each time slot, W s .
Suppose that the time slots are numbered from 1 to n . Also, suppose that there are s i alerts in slot number i . In Random selection policy, when a new alert arrives, m i alerts are randomly selected for correlation from time slot, Ti . mi is different for each time slot and is less than or equal to si . mi is determined by considering two values: i , the slot number that is between 1 and n and si , the total number of alerts in slot Ti . mi is calculated as below [21]:
mt = [^J (4)
In Random selection policy exactly mi alerts are selected for correlation with new alert Alast . In Random Directed alert selection a new parameter besides to n and Ws is used for each time slot Ti . This parameter, mx , is the maximum correlation between new alert, Alast , and all selected alerts from Ti . RDTW uses (4), to calculate the initial value of m i . After selecting and correlating 7 alerts of T i , the calculated value of mx is checked. If mx is less than a minimum acceptable correlation threshold, min accept , then it seems that alert A last is not related with slot T i . As a result, m i is decremented by one, and the selection and correlation process is continued by the new value of m i . On the other hand, if after correlating m i alerts mx is more than 1-minaccept , then it is reasonable to conclude that alert Alast is strongly related with slot Ti . Thus, mi is incremented by one and the system continues the process of alert selection and correlation for this slot ( T i ). The selection terminates either by encountering an alert with correlation probability less than 1-minaccept or by selecting all alerts from Ti [3].
RDTW selects alerts more wisely than Random alert selection policy almost with the same performance. It selects more than m i alerts from relevant slots and less than m i alerts from irrelevant ones ( Random policy selects exactly m i alerts from slot number i ). ERDTW uses some context information to classify time slot, T i , to Relevant (dangerous) or Irrelevant (safe) slot. It uses (5), to calculate the value of m i for T i .
mt = 1^1 x " (5)
ω is a reduction factor. It is an adjustable parameter that is 1 for Relevant slots and is a real value between 0 and 1 for Irrelevant slots. By using ω, it is possible to adjust the computational cost of the ERDTW policy more precisely. A small value (less than or equal to 0.5) is assigned to ω for Irrelevant slots. As a result, the number of selected alerts is reduced considerably. Both performance and accuracy of the system is remarkably related to the process of context information gathering. If the context information is selected properly with low computational cost, then the performance of the system is considerably improved. The accuracy of the system is improved if the context information would be useful and related information for identifying the Relevant and Irrelevant time slots. After calculating mi , the same process as RDTW is used to increase and decrease mi .
-
B. Context information
Context information for each time slot, Ti , is gathered during the processing of the alerts of Ti . This information is stored and used later to classify Ti as Relevant or Irrelevant time slot. The information gathering process should be a very light weight process in such a way that its cost does not exceed the computational cost that is saved by using ω. Suppose that S_IP max and D_IP max are the most observed source and destination IP addresses in T i . The following information is used as context information of Ti .
S_IP per : the percentage of alerts that S_IP max is observed in them
If there are many alerts with the same source IP address in Ti , then Ti is more likely to be a dangerous slot and should be classified as Relevant (dangerous) slot. We assume that there is a direct relation between the S IP per and the degree of relevancy. S_IP per is calculated by counting the number of observation of S_IP max and dividing it to s i . S_IP per is a real value between 0 and 100.
D_IPper : the percentage of alerts that D_IPmax is observed in them
If there are many alerts with the same destination IP address in Ti , then Ti is more likely to be a dangerous slot and should be classified as Relevant slot. We assume that there is a direct relation between the D_IP per and the degree of relevancy. D_IP per is calculated by counting the number of observation of D_IPmax and dividing it to si. D_IPper is a real value between 0 and 100.
Seq num : the number of observation of S_IP max of T i in the set of D_IP max of T j (for all j less than i)
If D_IP max of one previous time slot such as T j is equal to S_IP max of T i , then it is possible that T j contains the attack steps that prepare for attacks in T i . We assume that the number of time slots like T j has direct relation with the degree of relevancy of T i . Seq num is an integer value between 0 and ( n-1 ).
D_Port per : the percentage of alerts with destination ports belonged to the dangerous port numbers
By considering different known attacks and the experience of administrator about them, it is possible to define a list of dangerous ports. Therefore, D_Port per is calculated by counting alerts with the destination ports that are belonged to this list and dividing it to s i .
InRange : si is in range or is not
It is a Boolean value which is used to identify that the value of si is close or it is far from the mean value of alert numbers in the time window and is calculated as follows.
{ ≤ Si ≤ Uper
False otℎerwise
Where Uper and Lower are calculated as follow:
{ + StDev if Uper < Max
Max otℎerwise
{ - StDev if Lower > Min
Min otℎerwise
Where, Max , Min , Mean and StDev are the maximum, minimum, mean and standard deviation of s j respectively (for j= 1 to n ). We assume that if the value of InRange is false, then it is more likely to classify the T i as Relevant or dangerous slot.
Window management for ERDTW is based on the sliding window. After a specified time ( Ws ), all time slots slide forward and one time slot is put out from one side and a new time slot is entered from the other side. Accordingly some information about time slots is modified. S_IP per , D_IP per and D_Port per are not modified by slot sliding, but Seq num and InRange are probably changed by sliding slots. As a result, only when a new slot is started the context information about previous slots is updated. The process of context information gathering for current slot is done during the correlation process. Hence, the computational cost of this process is crucial.
-
C. Classification
A dataset of aforementioned context information is generated and Relevant (dangerous) or Irrelevant (safe) labels are assigned to its record manually. Each record contains context information about a sample slot (S_IP per ,
D_IPper, D_Portper, Seqnum, InRange) and its Relevant or Irrelevant label. These records are used to train the classification algorithm. The Classification and Regression Tree ( CART ) algorithm [23] with ten-fold cross-validation is used to generate a proper decision tree based on the training data. The total number of training data is 160 samples. They are generated by considering different possible values of five above context information, and their labels are assigned manually. 120 out of 160 samples are from Irrelevant and 40 samples are from Relevant class. The CART algorithm classifies 136 samples correctly and 24 samples incorrectly. Thus, its accuracy is 85 percents.
The goal of this classification is not to decide about the correlation of two alerts. It only tries to recognize the more dangerous time slots and, even if its decision would be incorrect the processing of the slot will be continued only with less number of selections and will be continued by our directed strategy. Hence, 85 percent of accuracy is acceptable for this application. Fig. 2 shows a sample generated tree by the CART algorithm.
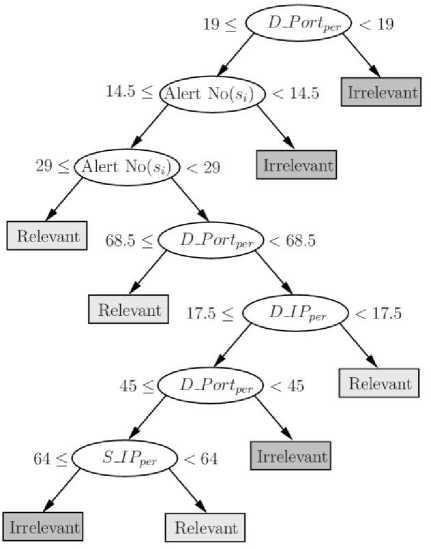
Fig. 2. A sample generated tree by the CART algorithm for classifying time slots to Relevant and Irrelevant
This tree is used in ERDTW to determine whether a slot is dangerous ( Relevant ) or safe ( Irrelevant ). By determining the relevancy of one slot, the amount of processing on its alerts is determined. ERDTW uses ω to enforce the impact of relevancy on each slot. For Relevant slots, ω is considered 1. As a result, more alerts are selected from them, and for Irrelevant slots, ω is considered a value between 0 and 1. Therefore, less processing efforts are imposed for them.
Algorithm 2 outlines the ERDTW selection policy. The main difference between this algorithm and the algorithm of RDTW is in line 6. Where, the algorithm identifies the safety of time slot Ti. It is accomplished by considering the context information that is previously generated for each time slot. If Ti is not safe then it needs more processing efforts. It is achieved by assigning 1.0 to ω (line 8). Otherwise, ω gets the value of 0.5 (line 10), and it leads to less processing for slot Ti.
Algorithm 2. ERDTW selection policy
Input: New alert Alast
Output: A group of alerts for correlation with Alast
-
1: n = The number of time slots
-
2: if (new slot is started with alert Alast )
-
3: Update ( ContextInfo )
-
4: end if
-
5: for i = 1 to n do
-
6: r = Classify( T , Contextinfo ) // T is ith time slot
-
7: if ( r = Relevant )
-
8: to = 1
-
9: else
-
10: to = 0.5 // or other proper value
-
11: end if
-
12: m i = ^^j x to // s i is the number of alerts in T i
-
13: k = 0
-
14: mx = -1
-
15: while ( k < mi ) and ( k < si )
-
16: b = a random alert from T i
-
17: y = Correlation value between A last and A selected
-
18: if y > mx then
-
19: mx = y
-
20: end if
-
21: k = k + 1
-
22: if ( k > ^ ) and ( mx < min accept )
-
23: m i = m i - 1
-
24: end if
-
25: if ( k = mi ) and ( mx > 1-minaccept ) and ( k < si )
-
26: m i = m i + 1
-
27: mx = 0
-
28: end if
-
29: end while
-
30: end for
-
V. Evaluation and Results
The alerts produced by Realsecure and Snort on the DARPA2000 [24] and netForensics honeynet data [25] are employed to evaluate the system. Realsecure produces 922 alerts from 22 types for the Inside1 traffic of DARPA2000 data. It contains the LLDoS1.0 attack scenario. Realsecure also produces 494 alerts from 20 different types for the Inside2 traffic of DARPA2000. It contains the LLDoS2.0 attack scenario. DARPA2000 is used to evaluate the ability and accuracy of the iCorrelator to extract the multistage attack scenarios. As result of the limited number of alerts in both Inside1 and Inside2, another dataset with more alerts is used to evaluate the performance of the iCorrelator. The netForensics honeynet dataset contains 35 days of traffic logs collected from February 25, 2005 to March 31, 2005. During this period, attackers issued several multi-step attacks to compromise the honeynet. The traffic of the
two first days of netForensics honeynet data is employed to test the ability of iCorrelator to extract the attack scenarios. netForensics also is used to evaluate the performance of the system.
21 general rules are used in the rule set, and their corresponding 21 training antigens are used for AIRS training part. Each rule defines the relation between 6 aforementioned features and a class number. The class number is a positive integer between 0 and a predefined maximum λ (λ=20 in our rule set). The class number is mapped to probability value (class number 0 to probability 0.0 and class number λ to probability 1.0) [3].Table 1 shows some sample rules that are used in the rule set. Before system starting its work, the AIRS algorithm is executed, and the generated memory cells are stored for future use. Therefore, the initial knowledge of the system consists of the fuzzy rules and the generated memory cells.
Table 1. Samples of rules from predefined rule set
|
F1 |
F2 |
F3 |
F4 |
F5 |
F6 |
Class |
|
|
Rule1 |
Med |
Med |
1 |
0 |
High |
High |
16 |
|
Rule2 |
High |
High |
1 |
0 |
Low |
Low |
19 |
|
Rule3 |
High |
High |
1 |
0 |
Low |
Low |
18 |
|
Rule4 |
Med |
Med |
0 |
0 |
Med |
Low |
4 |
|
Rule5 |
Med |
Med |
0 |
0 |
Med |
Low |
3 |
To evaluate the accuracy of the system, three measures are used: completeness, soundness and false correlation rate. Completeness is defined as the ratio of the correctly correlated alerts to the related alerts for a scenario. Soundness is defined as the ratio of the correctly correlated alerts to the total correlated alerts for a scenario, and false alert rate is defined as the ratio of the incorrectly correlated alerts to the related alerts for a scenario. The most important parameters that influence accuracy and performance of the system are the number of lymphocytes, the rule selection threshold, rs , the cell matching threshold, cm , and the number of alerts. In all reported results the values of rs and cm are 0.9 and 0.97 respectively. Other Important parameters relating to alert selection policy are the width of time window, W s , the number of time slots, n , the minimum acceptable correlation, min accept , the reduction factor, ω. The values of these parameters are 300, 20, 0.75 and 0.5 respectively. The number of lymphocytes is changed from 100 to 1000, and each scenario is examined 10 times for each setting. The results are reported based on the average values. To evaluate the performance of the system four different configurations for alert selection policy module are used. They are Select All , Random , RDTW and ERDTW .
Alerts in the first attack scenario (LLDoS1.0) are from six different types: Sadmind Ping, Sadmind Amslverify Overflow, Admind, Rsh, Mstream Zombie and Stream DoS. The first five alert types are appeared in extracted scenarios by all selection policies. The last step of the attack is a Stream DoS alert. It is the only alert that is not correlated with other alerts. It is placed in a hyper-alert with only one alert.
Table 2 shows generated results for Inside1 data. It shows that the completeness of the select all policy is the best among all policies. It is predictable that by using the time window some steps of attacks are ignored, but the main problem with select all policy is its performance. The running time for select all policy is 12.53 and for random , RDTW and ERDTW are 7.94, 7.81 and 4.95 seconds respectively (Table 3). Although, the soundness and false correlation rate for different policies are very close, the generated results for ERDTW are the best. Therefore, by employing the context information and the classification tree the running time, soundness and false correlation rate are improved. The completeness is decreased comparing with select all , but it is improved comparing with two other policies. It shows the advantage of ERDTW and our classification method. Table 4 shows a comparison between iCorrelator and two other works using the same dataset. By considering the ability of iCorrelator to start with a small set of rules and extending its ability to overcome new situation, the generated results for Inside1.0 data are comparable to two more sophisticated approaches.
Table 2. Accuracy comparison for LLDoS1.0 with different policies
|
All |
Random |
RDTW |
ERDTW |
|
|
Completeness |
0.941 |
0.745 |
0.816 |
0.878 |
|
Soundness |
0.950 |
0.928 |
0.943 |
0.953 |
|
FCR |
0.050 |
0.060 |
0.052 |
0.045 |
Table 3. The running time comparison for different policies
|
All |
Random |
RDTW |
ERDTW |
|
|
LLDos1.0 |
12.53 s |
7.94 s |
7.81 s |
4.95 s |
|
LLDos2.0 |
3.27 s |
2.80 s |
2.85 s |
1.64 s |
|
netForensics |
213.60s |
23.98 s |
23.11 s |
13.33 s |
Table 4. Accuracy comparison for LLDoS1.0 with other works
|
All |
ERDTW |
Ning[12] |
Mamory[26] |
|
|
Completeness |
0.941 |
0.878 |
0.932 |
0.833 |
|
Soundness |
0.950 |
0.953 |
0.932 |
1.000 |
|
FCR |
0.050 |
0.045 |
0.068 |
0.000 |
Different selection policies are also examined by using Inside2 data. Again all policies extract the attack scenario almost completely (except the last step). Alerts that appear in all extracted scenario are Admind, Sadmind Amslverify Overflow, FTP Put and Mstream Zombie . The last step of the attack is not extracted in all experiments, and its related alert ( Stream DoS ) is placed in a hyperalert with only one alert.
Results generated by different selection policies are more close to each other for Inside2 (Table 5). Its reason is that the duration of LLDoS2.0 is less than LLDoS1.0, and the size of the time windows that is used for both data are the same (n×Ws=6000 seconds). Hence, the time window contains almost all alerts of Inside2. Little differences in completeness for four polices are negligible. The soundness and false correlation rate for three time window-based policy are better than select all. It shows that these methods select alerts more wisely and less numbers of Irrelevant alerts are selected by them. As expected, the execution time improved by using the time window-based polices (Table 3). The best execution time belongs to ERDTW policy without any meaningful accuracy degradation. Thus, our new selection policy is the best method among all policies for Inside2 data. Table 6 shows a comparison between iCorrelator and two other works using the same dataset.
Table 5. Accuracy comparison for LLDoS2.0 with different policies
|
All |
Random |
RDTW |
ERDTW |
|
|
Completeness |
0.607 |
0.600 |
0.600 |
0.600 |
|
Soundness |
0.937 |
0.982 |
0.982 |
0.958 |
|
FCR |
0.050 |
0.014 |
0.014 |
0.029 |
Table 6. Accuracy comparison for LLDoS2.0 with other works
|
All |
ERDTW |
Ning[12] |
Mamory[26] |
|
|
Completeness |
0.607 |
0.600 |
0.667 |
0.875 |
|
Soundness |
0.937 |
0.958 |
0.923 |
0.583 |
|
FCR |
0.050 |
0.029 |
0.056 |
0.625 |
Snort generates 3419 alerts belonging to 43 different alert types for the first two days of netForensics honeynet data. Results show that all 43 types of alerts in the input data are correlated with each other with different strengths. The most compelling evidence of compromise in this data is the outbound IRC communication, which implies that the intrusion succeeded. For this dataset there is not a unanimous agreement about the designated scenario and its related alerts. As a result, we report the extracted attack graph instead of three accuracy measures (completeness, soundness and false correlation rate). Our extracted scenario is started by three alert types: WEB ATTACKS rm command attempt, BLEEDING EDGE EXPLOIT Awstats Remote Code Execution Attempt and WEB ATTACKS wget command attempt . The attacker uses these remote command attempts to download and install malicious software on the target machines. Then the attacker issues IRC attacks from those compromised targets to the final victim. Snort is produced alerts such as CHAT IRC nick change, BLEEDING EDGE IRC Nick change on non-std port and CHAT IRC message for the rest of the attack, and all policies correlate these alerts.
Fig. 3 shows extracted scenarios with two different selection policies: select all and ERDTW. The first policy has the most computational cost and examines all alerts and, the second one has the least computational cost and examines the least number of alerts. Although the running time is very different for two policies (213.6 and 13.33 seconds), both policies extract the same scenario. Probabilities that are assigned to edges are a little different, but their general logic is the same. The goal of a selection policy is to improve the performance of a correlation system without accuracy degradation. Reported results in Table 3 and Fig. 3 show that ERDTW meets this goal perfectly.
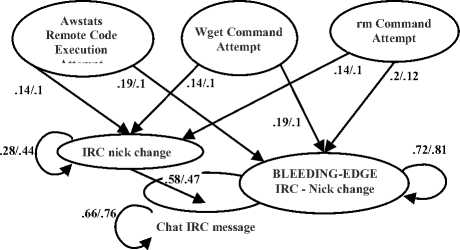
Fig. 3. The attack graphs generated for netForensics honeynet with Select All and ERDTW (separated by slash)
-
VI. Conclusion
In this paper a new version of iCorrelator is presented. iCorrelator is an alert correlation architecture that is inspired by a comprehensive model of human immune system (HIS). Many concepts of HIS such as innate immune system’s response, primary response in adaptive immune system and secondary response in adaptive immune system are employed in iCorrelator. Moreover, in the present version, some concepts of the Danger theory such as safe and danger signals are used. iCorrelator is a three-layer correlation architecture. In the first layer of correlation a limited number of fix rules are used to handle the most trivial situations. In the second layer of correlation AIRS algorithm is used. It is an AISbased supervised learning algorithm. This layer is similar to the primary response in the human adaptive immune system. The result of correlation in second layer is stored in the third layer of correlation as immune memory cell and is used for later correlation processes. A new alert selection policy named Enhanced Random Directed Time Window ( ERDTW ) is also introduced to improve the performance of correlation process. It adopts safe and danger signals from Danger theory. It gathers some context information about each time slot and uses this information along with Classification and Regression Tree (CART) algorithm to classify slots as Relevant (dangerous) or Irrelevant (safe). More processing efforts are employed for dangerous slots and less processing efforts are employed for safe slots. As a result of this improvement, the computational cost is decreased without accuracy degradation.
The system is examined by two traffic data of DARPA2000 and net Forensics honeynet, and its ability to extract the attack scenario is proven. The system is simple to run. It needs no complicated initial data. It can learn and remember the correlation between different attack types. By using ERDTW for LLDoS1.0 and LLDoS2.0, running times are decreased considerably without considerable accuracy degradation. Moreover the accuracy of the system is comparable with more sophisticated methods that need predefined complex rules.
References An Architecture for Alert Correlation Inspired By a Comprehensive Model of Human Immune System
- A. Ghorbani, W. Lu, and M. Tavallaee. Network Intrusion Detection and Prevention. Springer, New York, 2010.
- F. Valeur, G. Vigna, C. Kruegel and R. Kemmerer. A comprehensive approach to intrusion detection alert correlation. IEEE Transactions on Dependable and Secure Computing, 2004. p.153-172.
- M. Bateni, A. Baraani, A. Ghorbani and A. Rezaei. An AIS-inspired Architecture for Alert Correlation. International Journal of innovative Computing, Information & Control, 2013. 9(1):p. 231-255.
- L.N. de Castro and J. Timmis. Artificial Immune Systems: A new computational intelligence approach. Springer-Verlag London Berlin Heidelberg, 2002.
- P. Matzinger. Tolerance, danger and the extended family. Annual Review in Immunology, 1994. 12(1):p.991-1045.
- A.Watkins, J. Timmis, L. Boggess. Artificial immune recognition system (airs): An immune-inspired supervised learning algorithm. Genetic Programming and Evolvable Machines, 2004. 5(3):p. 291-317.
- S.T. Eckmann, G. Vigna, R.A. Kemmerer. Statl: An attack language for state-based intrusion detection, Journal of Computer Security, 2002. 10(1-2):p. 71.
- F. Cuppens, R. Ortalo. Lambda: A language to model a database for detection of attacks. Recent Advances in Intrusion Detection Lecture Notes in Computer Science, Springer Berlin / Heidelberg, 2000. 1907:p. 197-216.
- E. Totel, B. Vivinis. A language driven intrusion detection system for event and alert correlation. Security and Protection in Information Processing Systems, 2004. 147:p.208-224.
- O. Dain, R. Cunningham. Fusing a heterogeneous alert stream into scenarios. Proceeding of the 2001 ACM Workshop on Data Mining for Security Applications. p.1-13.
- L. Wang, A. Ghorbani, Y. Li. Automatic multi-step attack pattern discovering. International Journal of Network Security, 2010. 10(2):p. 142-152.
- P. Ning, Y. Cui and D.S. Reeves. Techniques and Tools for Analyzing Intrusion Alerts. ACM Transactions on Information and System Security, 2004. 7(2):p.274–318.
- S. Cheung, U. Lindqvist, M. Fong. Modeling multistep cyber attacks for scenario recognition. DARPA Information Survivability Conference and Exposition, 2000. p.284-292.
- F. Cuppens, A. Miege. Alert correlation in a cooperative intrusion detection framework. IEEE Symposium on Security and Privacy, 2002. p.202.
- X. Qin. A Probabilistic-Based Framework for INFOSEC Alert Correlation, Ph.D. thesis, Georgia Institute of Technology, 2005.
- H. Ren, N. Stakhanova and A. Ghorbani. An online adaptive approach to alert correlation. Volume 6201 of Lecture Notes in Computer Science, Springer Berlin / Heidelberg, 2010, p.153-172.
- B. Zhu and A. Ghorbani. Alert correlation for extracting attack strategies. International Journal of Network Security, 2006. 3(3):p.244-258.
- R. Sadoddin, A. Ghorbani. An incremental frequent structure mining framework for real-time alert correlation. Computer Security, 2009. 28(3-4):p.153-173.
- S.A. Hofmeyr. An Immunological Model of Distributed Detection and Its Application to Computer Security, PhD thesis, University of New Mexico, 1999.
- A. Uwe, C. Steve. The Danger Theory and Its Application to Artificial Immune Systems. First International Conference on Artificial Immune Systems (ICARIS-2002), Canterbury, UK, 2002.
- H. Ahmadinejad and S. Jalili. Alert Correlation Using Correlation Probability Estimation and Time Windows. In proceedings of the 2009 International Conference on Computer Technology and Development, IEEE Computer Society ICCTD '09, 2009. p.170-175.
- M. Bateni, A. Baraani. Time Window Management for Alert Correlation using Context Information and Classification. International Journal of Computer Network & Information Security, 2013. 5(11):p.9-16.
- Y. Yohannes and J. Hoddinott. Classification and Regression Trees: an introduction. Technical guide, International Food Policy Research Institute (IIFPRI), 1999.
- MIT Lincoln Laboratory. Darpa2000 intrusion detection scenario specific data sets. http://www.ll.mit.edu. (last accessed May 2014).
- netForensics Honeynet team. Honeynet traffic logs. http://old.honeynet.org/scans/scan34. (last accessed May 2014).
- S.O. Al-Mamory, H.L.Zhang. Building Scenario Graph Using Clustering. Proceedings of the 2007 International Conference on Convergence Information Technology, IEEE Computer Society, 2007. p.799-804.
