An automated method for finding the optimal parameters of adaptive filters for speckle denoising of SAR images

Author: Pavlov Vitalii, Tuzova Anna, Belov Andrei, Matveev Yurij
Journal: Компьютерная оптика @computer-optics
Section: Обработка изображений, распознавание образов
Article in issue: 6 т.46, 2022.
Free access
Many different filters can be used to reduce multiplicative speckle noise on radar images. Most of these filters have some parameters whose values influence the result of filtering. Finding optimal values of such parameters may be a non-trivial task. In this paper, a formal automated method for finding optimal parameters of speckle noise reduction filters is proposed. Using a specially designed test image, optimal parameters for the most commonly used filters were found using several image quality assessment metrics, including the Structural Similarity Index (SSIM) and Gradient Magnitude Similarity Deviation (GMSD). The use of filters with optimal parameters allows processing (detection, segmentation, etc.) of radar images with minimal influence of speckle noise.
Speckle noise, radar image, sar, noise reduction, image processing, ssim, gmsd, optimal filter parameters
Short address: https://sciup.org/140296239
IDR: 140296239 | DOI: 10.18287/2412-6179-CO-1132
Text of the scientific article An automated method for finding the optimal parameters of adaptive filters for speckle denoising of SAR images
Synthetic aperture radars (SAR) are currently widely used to perform various remote sensing tasks [1 –3]. SAR images have significant graininess (unevenness). This phenomenon is caused by speckle noise [2, 4]. Speckle noise results from the coherent addition of signals reflected by many elementary reflectors present within one resolution element. Speckle noise is a multiplicative noise [5, 6] and can be modeled by the multiplication of an image by some random signal. Speckle noise filtering improves the quality of the SAR images and minimizes detection errors [7].
For example, the influence of multiplicative speckle noise on neural networks (NN) is not well investigated, but existing research suggest that typical SAR noise levels can significantly influence the performance of NN trained on aerial photography data [8]. Such NNs are sometimes used in practice due to the lack of easily available annotated SAR training datasets. High quality filtering of SAR images may improve the performance of a NN.
Many speckle noise reduction filters have one or several variable parameters that must be selected empirically to achieve maximum quality of filtering. Often, authors of papers on SAR image filtering do not explain the choice of such parameters [9– 16]. There are some articles on the selection of the variable parameters values [17–22]. However often only one parameter is varied (for example, the size of the processing window) although the filter can have up to three variable parameters, the values of which must be selected jointly or an optimization algorithm is not presented in sufficient detail and there is no easy way to reproduce it.
Available literature lacks descriptions of methods for searching the values of the speckle noise reduction filters parameters that can be automated, universal for many filter types and is publicly available.
Therefore, the aim of this work is to present a universal automated technique for finding the optimal parameters of speckle noise reduction filters in terms of the best quality of filtering.
Speckle noise filtering
Speckle noise reduction filters. Local filters are usually used for speckle noise reduction. Filtering in this case is carried out in a sliding 2-D window, the size of which is much smaller than the size of an image. This paper discusses the following filters: the median filter (variable parameter: processing window size m) [23]; the Lee filter (variable parameter: processing window size m) [24]; the Frost filter (variable parameters: processing window size m and damping coefficient D , which allows to adjust the smoothness of the filter) [5]; the Kuan filter (variable parameters: processing window size m and coefficient A , which allows to adjust the smoothness of the filter) [25]; the bilateral filter (variable parameters: processing window size m and smoothing parameters σ 2 d and σ r 2 ) [26]; the MAP filter (variable parameter: processing window size m) [27].
There are also filters that use other approaches, for example the anisotropic diffusion (AD) (filter of Peron and Malik [28]). The variable parameters of the AD filter are the time step ∆ t , the parameter k , and the number of iterations t .
Evaluation of noise filtering quality. Comparison of the filters’ performance is often made using image quality assessment (IQA) mathematical methods (metrics) [29], such as: Mean Squared Error (MSE) [23]; Peak Signal-to-Noise Ratio (PSNR) [23]; Structural Similarity Index Metric (SSIM) [30]; Gradient Magnitude Similarity De- viation (GMSD) [31] and others. Manual and automated interpretation of SAR images significantly depends on structural information since both human visual perception and convolutional neural networks heavily rely on it. That is why IQA metrics that takes into account structural information are more useful than the ones that do not. Metrics like PSNR and ENL ignore structural information almost completely, SSIM and related metrics use it, and gradient based metrics like GSMD almost completely rely on structural information.
The authors of this article compared the above metrics for radar images processing tasks [32]. Based on the results obtained in [32], we will use the SSIM metric to assess the quality of processed images. The GSMD metric also proved to be similarly effective.
The selection of optimal parameters
The authors first tested the approach considered below in [33]. However, only Frost filter was investigated there and in less detail. This work investigates many popular types of known filters and includes comparison with neural network denoising filter
The investigation of filters starts by creating a reference image without noise. Noise is then overlaid on the reference image, then filtering is performed and an IQA metric is calculated using both original and filtered images. To do this it is necessary to know speckle noise probability distribution.
It can be estimated by selecting and analyzing relatively uniform fragments of radar images. Eight real SAR images were examined and from hree to five uniform fragments were selected in each image. The uniformity of the fragments was determined by analyzing the equivalent number of looks (ENL). This parameter is equal to the ratio of the squared mean value to the variance of the pixel brightness in the analyzed area. The higher the ENL value, the more uniform the area is.
It was discovered that speckle noise has very similar distribution in all analyzed radar images. Therefore, the pixel intensities of all selected fragments were combined into one large dataset. Next, the noise distribution was approximated using the Rayleigh probability density function (PDF) [34, 35]. Fig. 1 a shows PDFs for the sample and approximating distributions and fig. 1 b shows the cumulative distribution functions (CDFs). The scale parameter of the Rayleigh distribution σ was estimated as 0.27.
The null hypothesis H 0 that the sample has the Rayleigh distribution with the scale parameter 0.27 was tested using the Pearson’s chi-squared test [36, 37]. Testing was done using the chi2gof(x) function from Matlab. The χ2 test does not reject the null hypothesis with the significance level 0.05. So this distribution is close to the real speckle noise distribution for the selected set of images.
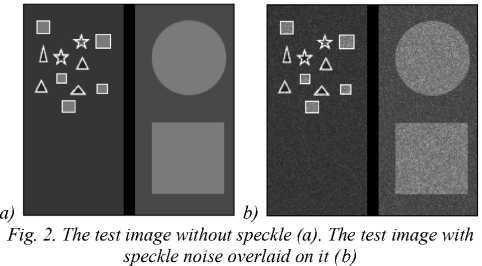
Next, a test reference image must be created. Such a test image should imitate the most common objects present in radar images, such as complex man made structures (airplanes, buildings), linear objects (roads, streams)
and large uniform areas (forests, lakes, fields), etc. The image shown in fig. 2 a is a reference image used for evaluating speckle noise reduction filters. It contains several small objects with various shapes, a long linear object in the middle, and uniform areas with sharp edges. Fig. 2 b shows the reference image with speckle noise overlaid on it.
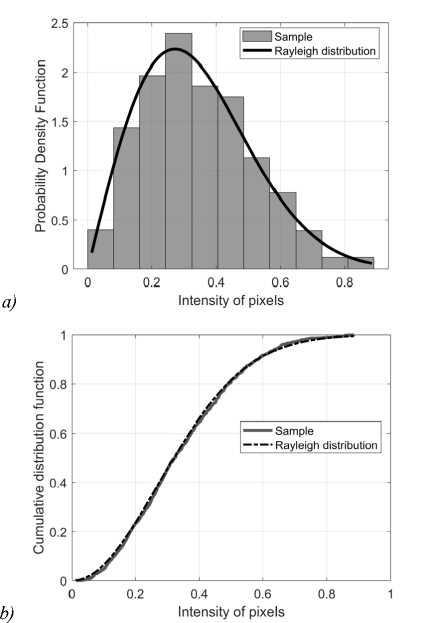
Fig. 1. PDFs and CDFs for the sample and approximating distributions. (a) PDFs, ( b) CDFs
It should be noted that the results of the algorithm would depend on the selected test image. Therefore, the following results may differ from those that would be obtained with another test image.
The process of finding the optimal parameters of speckle noise reduction filters is an iterative optimization process. The number of iterations depends on the number of variable filter parameters. Consider the optimization steps for the filters discussed above.
The median, Lee and MAP filters have only one variable parameter (processing window size m). The optimi- zation process is the calculation of the dependence of the SSIM metric values on various values of m. From this, the value of the parameter that maximizes SSIM can be found. The Frost and Kuan filters have two variable parameters (processing window size m and filter smoothness coefficient). The optimization process consists of three stages:
-
1) In the first stage, a certain value of m is selected and fixed, and the dependence of the metric values on various values of the smoothness coefficient is calculated. The obtained dependence is used to determine the initial optimal value of the smoothness coefficient.
-
2) In the second stage, the initial optimal value of the smoothness coefficient is fixed and the dependence of the metric values on various values of m is calculated. From this dependence, the optimal value of m is determined.
-
3) In the third stage, the process of the first stage with a fixed optimal value of m repeats.
This process can be repeated until the optimization results stabilize. For filters with more than two parameters the optimization process is similar, but includes more steps.
Results
The optimal parameters of the investigated filters were found using the described algorithm. The initial size of processing window size parameter was chosen 11×11. The obtained optimal parameters of the filters are presented in Table 1 (the higher SSIM and lower GSMD values mean higher quality). The test image and the difference images after using filters with the optimal parameters are shown in fig. 3. A small fragment of the original noisy image is included in the filtered test image for comparison (upper right corner).
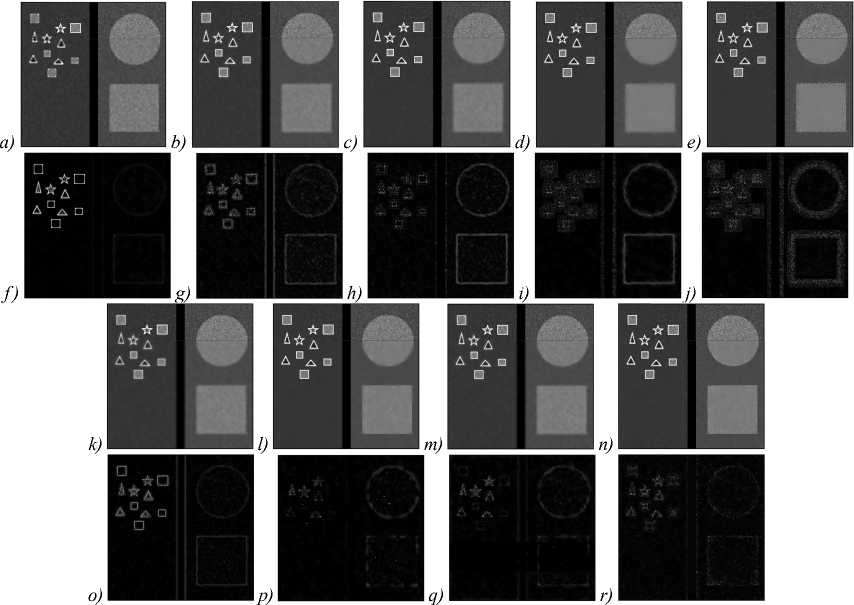
Fig. 3. The test image (a-e, k-n) and the difference image (f-j, o-r) after filters with the optimal parameters found using SSIM metric and after denoising neural network. (a) Median, SSIM = 0.879, ( b) Lee, SSIM = 0.925, (c) MAP, SSIM = 0.944, (d) Frost, SSIM = 0.948, (e) Kuan, SSIM = 0.893, (f ) Median, (g) Lee, ( h) MAP, (i)Frost, (j) Kuan, (k) Bilateral, SSIM = 0.920, (l) AD (exp.), SSIM = 0.976, (m) AD (quad.), SSIM = 0.980, (n) DNN, SSIM = 0.952, (o) Bilateral, (p) AD (exp.), (q) AD (quad.), (r) DNN
The filters discussed in the article can also be compared with the neural network approach. Recently, methods based on deep learning have shown good results in image processing. Neural networks also can be used to reduce speckle noise. As an example, we used the denoising neural network (DnCNN) [37]. The DnCNN is a convolutional neural network trained to extract noise from the image. The resulting image after the DnCNN can be subtracted from the noisy image to obtain a filtered image. The disadvantage of DnCNN when filtering SAR images is that it was trained to remove additive Gaussian noise, while speckle noise is mul- tiplicative and has a Rayleigh distribution. Fig. 3r shows a test image after neural network denoising.
-
Fi g. 4 shows part of the test image showing the position of the 1-D slice (the horizontal line in the middle).
A convenient method of visual comparison is using 1-D slices of images. The slices in Fig. 5 are spaced vertically by 0.9 so that they do not overlap. The closer the image slice after filtering is to the reference slice, the better the filter performs.
From fig. 3 and fig. 5, the following conclusions can be made:
-
1) The median filter cannot be recommended for radar image processing since this filter significantly suppresses small objects that are often found in radar images.
-
2) The Lee, MAP and bilateral filters give close results. They can be recommended for radar image processing. However, it should be kept in mind that these filters may not smooth graininess on large objects and uniform areas sufficiently well.
-
3) The Frost filter smooths noise well in uniform areas and large objects, but leaves some graininess around the edges of objects. It can be recommended for radar image processing.
-
4) The Kuan filter leaves noticeable noise artifacts near the edges of objects and cannot be recommended for radar image processing.
-
5) The AD filter with quadratic and exponential function g(x) smooths noise well enough, and highlights the boundaries of objects. It can be recommended for radar image processing
-
6) The neural network cancels noise about as well as the Frost and AD filters. However, visual inspection shows that some noise pixels remain, albeit more distant from each other. This is likely because the network was not specially trained to remove speckle noise. Perhaps, by using other type of a neural network or by training a network to filter out speckle noise, the results can be improved.
So the Frost filter, AD filter with quadratic function g(x) and denoising neural network produced the best results in filtering of speckle noise with Rayleigh distribution if their optimal parameters are found using the SSIM metric.
It should also be noted that this work presents the results for an uncorrelated speckle noise. That is, the samples of the Rayleigh distribution created to overlay the speckle noise are spatially independent. However, the same comparisons were also conducted for correlated speckle noise. The main conclusions were the same as for uncorrelated noise, and the optimal parameter values were close.
Discussion
Let us apply a Frost filter giving a high SSIM value for processing of real SAR image. We will compare the quality of filtering when using this filter with the found optimal parameters and with parameters taken from another work [22]. This work is devoted to finding the best filter for processing images obtained using a synthetic aperture sonar that are very similar to SAR images. The authors of the article compared several speckle noise reduction filters, and also determined the values of the filters parameters using the MSE metric. As a result, the authors argue that the Frost filter with D= 1 and m = 17×17 is the best choice for processing images obtained using a synthetic aperture sonar.
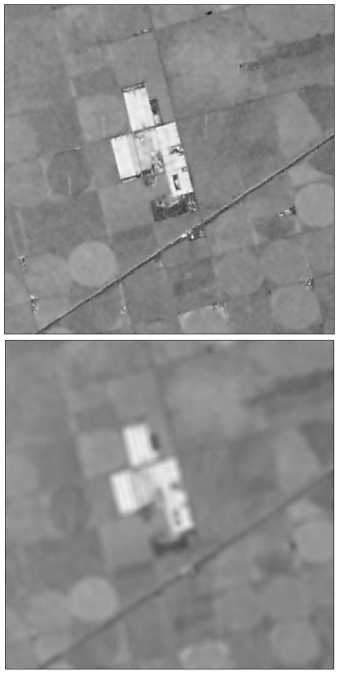
Since the goal and object of study of both works are similar, we can compare the results directly. The Frost filter with two sets of parameters was applied to real SAR images (fig. 6 [40] (X-Band, VV-Polarization, resolution 1 m), fig. 8 [41] (X-Band, HH-Polarization, resolution 5 m)). Fig. 7 and fig. 9 show the real SAR images after processing by the Frost with two sets of parameters. Fig. 7a and fig. 9a show that when using the optimal parameters found here, the images are clear, the boundaries of objects are well defined. When using parameters from [22], the images are more blurred and objects are difficult to distinguish suggesting that the first set of parameters gives better results.
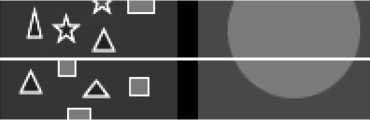
Fig. 4. A part of the test image showing the 1-D slice position
(a horizontal line in the middle)
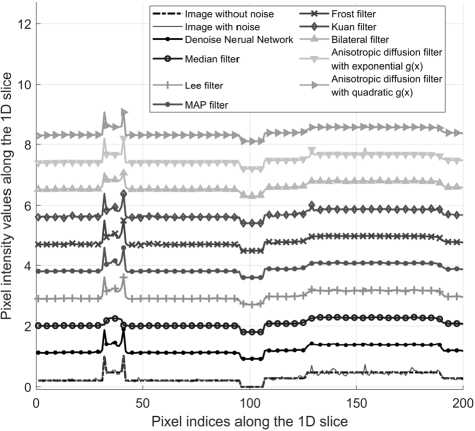
Fig. 5: 1-D slices for all filters with optimal parameters obtained using the SSIM metric and for denoising neural network
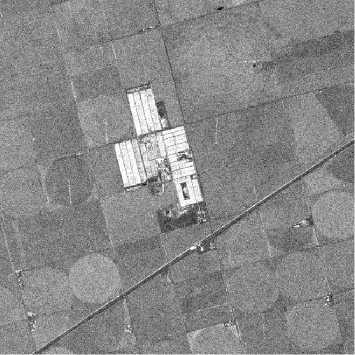
Fig. 6. Real SAR image [40]
Conclusion
The paper describes the formalized automated method for finding the optimal parameters for speckle noise reduction filters. The method is based on the knowledge of the speckle noise distribution and the use of a specially designed test image. The optimality of the parameters is determined using the SSIM metric. Optimal parameters were found for several speckle noise filters. The performance of the filters was also compared visually by inspecting the images after filtering, difference images and one-dimensional image slices. The Frost filter and the AD filter with quadratic function g(x) showed the best results when used with the optimal parameters. Also, the filters were compared with the DnCNN denoising neural network. The neural network denoising has shown good results despite being trained using additive noise.
a)
b)
Fig. 7. Real SAR image after Frost filter. (a) with optimal parameters (D = 10.8 and m = 13×13), (b) with parameters from work [22] (D = 1 and m = 17×17)
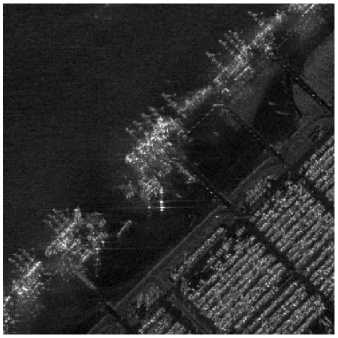
Fig. 8. Real SAR image [41]
b)
a)
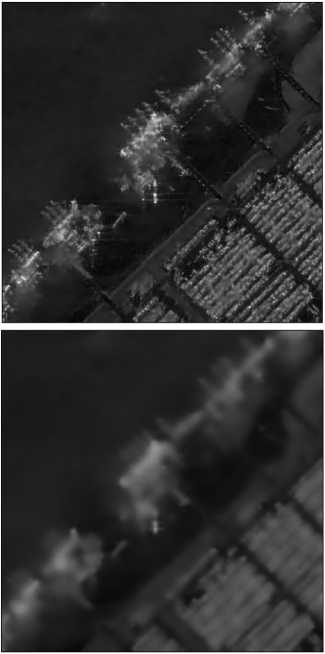
Fig. 9. Real SAR image after Frost filter. (a) with optimal parameters (D = 10.8 and m = 13×13), ( b) with parameters from work [22] (D = 1 and m = 17×17)
An important feature of SAR image processing is its relative resolution independence. Resolution of most SAR images available today varies from about several tens to 1 meter. At such resolutions point targets of 1 pixel size and line targets and boundaries of 1 pixel width may be present and be of interest to an analyst. So a filter capable of reducing speckle and at the same time keeping details of 1 pixel size relatively intact will be as useful for 1 m resolution as for 10 m resolution. This feature also makes synthetic reference images including small targets and sharp boundaries and results obtained using such images more universal than it may seem at first glance.
The program for finding the optimal parameters is implemented in the Matlab environment and can be freely accessed using the provided GitHub link [39].
Acknowledgements
The research is partially funded by the Ministry of Science and Higher Education of the Russian Federation as part of Worldclass Research Center program: Advanced Digital Technologies (contract No. 075-15-2020934 dated 17.11.2020).
The results of the work were obtained using computational resources of the Supercomputing Center in Peter the Great St. Petersburg Polytechnic University (.
References An automated method for finding the optimal parameters of adaptive filters for speckle denoising of SAR images
- Pavlov VA, Belov AA, Tuzova AA. Implementation of synthetic aperture radar processing algorithms on the Jet-son TX1 platform. IEEE Int Conf on Electrical Engineering and Photonics (EExPolytech) 2019: 90-93.
- Ozdemii C. Inverse synthetic aperture radar imaging with MATLAB Algorithms. Hoboken, New Jersey: John Wiley & Sons Inc; 2012.
- Skolnik M. Radar handbook. McGraw-Hill; 2008.
- Goodman JW. Some fundamental properties of speckle. J Opt Soc Am 1976; 66(11): 1145-1150.
- Frost VS, Stiles JA, Shanmugan KS, Holtzman JC. A model for radar images and its application to adaptive digital filtering of multiplicative noise. IEEE Trans Pattern Anal Mach Intell 1982; PAMI-4(2): 157-166.
- Goldfinger AD. Estimation of spectra from speckled images. IEEE Trans Aerosp Electron Syst 1982; AES-18(5): 675-681.
- Fursov V, Zherdev D, Kazanskiy N. Support subspaces method for synthetic aperture radar automatic target recognition. Int J Adv Robot Syst 2016; 13(5): 1-11. DOI: 10.1177/1729881416664848.
- Pavlov VA, Belov AA, Tuzova AA. Investigation of the influence of speckle noise on the accuracy of object detection by convolutional neural networks. 2021 Int Conf on Electrical Engineering and Photonics (EExPolytech) 2021: 47-50.
- Prakash KB, Babu RV, VenuGopal B. Image independent filterfor removal of speckle noise. International Journal of Computer Science Issues 2011; 8(5): 196-201.
- Gifani P, Behnam H, Sani ZA. Noise reduction of echo-cardiographic images based on temporal information. IEEE Trans Ultrason Ferroelectr Freq Control 2014; 61(4): 620630.
- Sarode MV, Deshmukh PR. Reduction of speckle noise and image enhancement of images using filtering technique. Int J Adv Technol 2011; 2: 30-38.
- Domg Y, Milne AK, Forster BC. Toward edge sharpening: a SAR speckle filtering algorithm. IEEE Trans Geosci Remote Sens 2001; 39(4): 851-863.
- Yu Y, Acton ST. Speckle reducing anisotropic diffusion. IEEE Trans Image Process 2002; 11: 1260-1270.
- Gomez L, Buemi ME, Jacobo-Berlles JC, Mejail ME. A new image quality index for objectively evaluating des-peckling filtering in SAR images. IEEE J Sel Top Appl Earth Obs Remote Sens 2016; 9(3): 1297-1307.
- Huang X, Jia Z, Zhou J, Yang J, Kasabov N. Speckle reduction of reconstructions of digital holograms using gamma-correction and filtering. IEEE Access 2018; 6: 5227-5235.
- Lopera O, Heremans R, Pizurica A, Dupont Y. Filtering speckle noise in SAS images to improve detection and identification of seafloor targets. 2010 Int WaterSide Security Conf 2010; 1-4.
- Touzi R. A review of speckle filtering in the context of estimation theory. IEEE Trans Geosci Remote Sens 2002; 40(11): 2392-2404.
- Aja-Fernandez S, Alberola-Lopez C. On the estimation of the coefficientof variation for anisotropic diffusion speckle filtering. IEEE Trans Image Process 2006; 15(9): 2694-2701.
- Krissian K, Westin CF, Kikinis R, Vosburgh KG. Oriented speckle reducing anisotropic diffusion. IEEE Trans Image Process 2007; 16(5): 1412-1424.
- Lee J-S, Wen J-H, Ainsworth TL. Improved sigma filter for speckle filtering of SAR imagery. IEEE Trans Geosci Remote Sens 2016; 47(1): 202-213.
- Dong X, Zhang D, Cui K. Spatial filtering strategies on deforestation detection using SAR image textures. CIE Int Conf on Radar (RADAR) 2016; 1-4.
- Karabchevsky S, Kahana D, Ben-Harush O, Guterman H. FPGA-based adaptive speckle suppression filter for underwater imaging sonar. IEEE J Ocean Eng 2011; 36(4): 646-657.
- Gonzalez RC, Woods RE. Digital image processing. Upper Saddle River, New Jersey: Pearson Education Inc; 2008.
- Lee JS. Digital image enhancement and noise filtering by using local statistics. IEEE Trans Pattern Anal Mach Intell 1980; PAMI-2(2): 165-168.
- Kuan D, Sawchuk A, Strand T, Chavel P. Adaptive restoration of images with speckle. IEEE Trans Acoust Speech Signal Process 1987; 25(3): 373-383.
- Tomasi C, Manduchi R. Bilateral filtering for gray and color images. Sixth Int Conf on Computer Vision 1998: 839-846.
- Lopes A, Nezry E, Touzi R, Laur H. Structure detection and statistical adaptive speckle filtering in SAR images. Int J Remote Sens 1993; 14(9): 1735-1758.
- Perona P, Malik J. Scale-space and edge detection using anisotropic diffusion. IEEE Trans Pattern Anal Mach Intell 1990; 12(7): 629-639.
- Sheikh HR, Bovik AC. Image information and visual quality. IEEE Trans Image Process 2006; 15(2): 430-444.
- Wang Z, Bovik AC, Sheikh HR. Image quality assessment: From error visibility to structural similarity. IEEE Trans Image Process 2004; 13(4): 600-612.
- Xue W, Zhang L, Mou X, Bovik AC. Gradient magnitude similarity deviation: A highly efficient perceptual image quality index. IEEE Trans Image Process 2014; 23(2): 684-695.
- Tuzova AA, Pavlov VA, Belov AA, Volvenko SV. Comparison of image quality assessment metrics for evaluation of performance of anisotropic diffusion filter for SAR images. IEEE Int Conf on Electrical Engineering and Photonics (EExPolytech) 2020: 176-179.
- Belov AA, Pavlov VA, Tuzova AA. A method of finding optimal parameters of speckle noise reduction filters. Internet of things, smart spaces, and next generation networks and systems. Cham: Springer International Publishing; 2020: 133-141.
- Choi H, Jeong J. Speckle noise reduction technique for SAR images using statistical characteristics of speckle noise and discrete wavelet transform. Remote Sens 2019; 11: 1184.
- Xie H, Pierce LE, Ulaby FT. Statistical properties of logarithmically transformed speckle. IEEE Trans Geosci Remote Sens 2002; 40(3): 721-727.
- Chernoff H, Lehmann EL. The use of maximum likelihood estimates in %2 tests for goodness of fit. Ann Math Statist 1954; 25(3): 579-586.
- Pearson K. On the criterion that a given system of deviations from the probable in the case of a correlated system of variables is such that it can be reasonably supposed to have arisen from random sampling. In Book: Kotz S, Johnson NL, eds. Breakthroughs in statistics: Methodology and distribution. NewYork, NY: Springer; 1992: 11-28.
- Zhang K, Zuo W, Chen Y, Meng D, Zhang L. Beyond a Gaussian denoiser: Residual learning of deep CNN for image denoising. IEEE Trans Image Process 2017; 26(7): 3142-3155.
- The project to find the optimal parameters for speckle noise reduction filters. Source: (https://github.com/AnnaTuzova/Speckle-noise-project).
- ICEYE. Source: (https://www.iceye.com/).
- Capella Space. Source: (https://www.capellaspace.com/).
