An Effective Age Classification Using Topological Features Based on Compressed and Reduced Grey Level Model of The Facial Skin

Author: V. Vijaya Kumar, Jangala. Sasi Kiran, V.V. Hari Chandana
Journal: International Journal of Image, Graphics and Signal Processing(IJIGSP) @ijigsp
Article in issue: 1 vol.6, 2013.
Free access
The present paper proposes an innovative technique that classifies human age group in to five categories i.e 0 to 12, 13 to 25, 26 to 45, 46 to 60, and above 60 based on the Topological Texture Features (TTF) of the facial skin. Most of the existing age classification problems in the literature usually derive various facial features on entire image and with large range of gray level values in order to achieve efficient and precise classification and recognition. This leads to lot of complexity in evaluating feature parameters. To address this, the present paper derives TTF’s on Second Order image Compressed and Fuzzy Reduced Grey level (SICFRG) model, which reduces the image dimension from 5 x 5 into 2 x 2 and grey level range without any loss of significant feature information. The present paper assumes that bone structural changes do not occur after the person is fully grown that is the geometric relationships of primary features do not vary. That is the reason secondary features i.e TTF’s are identified and exploited. In the literature few researchers worked on TTF for classification of age, but so far no research is implemented on reduced dimensionality model. The proposed Second order Image Compressed and Fuzzy Reduced Grey level (SICFRG) model reduces overall complexity in recognizing and finding histogram of the TTF on the facial skin. The experimental evidence on FG-NET aging database and Google Images clearly indicates the high classification rate of the proposed method.
Topology, texture features, bone structure, geometrical changes, compressed model, grey value reduction
Short address: https://sciup.org/15013158
IDR: 15013158
Text of the scientific article An Effective Age Classification Using Topological Features Based on Compressed and Reduced Grey Level Model of The Facial Skin
Published Online November 2013 in MECS
Human facial image processing has been an active and interesting research issue for years. Since human faces provide a lot of information, many topics have drawn lots of attentions and thus have been studied intensively on face recognition [1]. The human face provides the observer, with much information on gender, age, health, emotion and so on. Indeed, considerable research on the human face has taken place in psychology and in the other cognitive sciences since quite early. In recent years, applications in the area of human communication were actively studied from the viewpoint of information technology. A major goal of such studies is to achieve automatic identification of individuals using computers. To incorporate a human-face database in such applications, it is required to solve the issue of age development of the human face.
Other research topics include predicting feature faces [2], reconstructing faces from some prescribed features [3], classifying gender, races and expressions from facial images [4], and so on. However, very few studies have been done on age classification. The ability to classify age from a facial image has not been pursued in computer vision. Facial aging has been an area of interest for decades [5, 6, 7, 8, 9], but it is only recently that efforts have been made to address problems like age estimation, age transformation, etc. from a computational point of view [10, 11, 12, 13, 14, 15, 16, 17, 18]. Age classification problem was first worked on by Kwon and Lobo [19]. Their study classified input images as babies, young adults and senior adults based on cranio-facial development and skin wrinkle analysis. Yun et al. [20] used the database of human faces containing detailed age information to verify their proposed method, in which the spatial transformation of feature point was employed to express several age patterns with corresponding different ages.
Each input facial image will be compared with age patterns to obtain the age estimation result. Wen-Bing Horng, Cheng-Ping Lee and Chun-Wen Chen et.al [21] considered four age groups for classification, including babies, young adults, middle-aged adults, and old adults. Their method [21] is divided into three phases: location, feature extraction, and age classification. Based on the symmetry of human faces and the variation of gray levels, the positions of eyes, noses, and mouths are located by applying the Sobel edge operator and region labeling in the above methods [21].
Ramanathan and Chellappa [22] proposed a Bayesian age-difference classifier built on a probabilistic eigenspaces framework to perform face verification across age progression. Though the aforementioned approaches propose novel methods to address age progression in faces, in their formulation most approaches ignore the psychophysical evidences collected on age progression. Even with the human eye, estimates of a candidate’s age are often inaccurate. One of the reasons why age-group classification is difficult is that enormous time and expense is required for collecting images including a wide variety of age groups under the same lighting conditions, due to privacy and portrait rights. Ahonen et al. [23] proposed Local Binary Pattern (LBP) that provides an illumination invariant description of face image. However, the existing methods still suffer much from non-monotonic illumination variation, random noise and change in pose, age and expression. To extend this recently a novel local texture features on facial images that classify adult and child images based on the Morphological primitive patterns with grain components (MPP-g) on a Local Directional Pattern (LDP) is proposed [24].
The study of patterns on textures is recognized as an important step in characterization and recognition of texture. That is the reason the present paper investigates how the frequency occurrences of various topological texture primitive patterns or topological texture features (TTF) vary on facial image. While studying physical changes due to the aging process many researchers tried to classify facial images into various groups [25, 26, 27, 28, 29]. The authors carried out classification of: babies and adults [30], two age groups 20-39 and 40-49 [27], sex [27, 28]. Only few studies have [31] attempted to classify the age groups into five categories based on the frequency occurrences of TTF on a facial image.
So far no researcher is attempted the problem of age classification based on reducing the overall dimensionality and gray level range of the facial skin using TTF’s. To address this issue and to create a new direction in the classification problem the present paper reduced a 5x5 neighborhood in to a 2x2 and also reduced the overall gray level range in to 0 to 4 and measured the frequency of occurrences of TTF’s.
The present paper is organized as follows. The section 2 describes the proposed methodology and section 3 deals with the results and discussions. Conclusions are given in section 4.
-
II. METHODOLOGY
Local Binary Pattern (LBP), Texture Unit (TU) and Textons are useful texture descriptor that describes the characteristics of the local structure, which are useful for a significant classification. These descriptors provide a unified description including both statistical and structural characteristics of a texture. These descriptors are completely local and mostly defined on a 3 x 3 neighborhood. The proposed SICFRG model works on a 5 x 5 neighborhood, and compresses it in to a 2 x 2 neighborhood without loss of any texture information and further reduces the grey level range using fuzzy logic. The proposed method consists of ten steps. The block diagram of the proposed method is shown in Fig. 1.
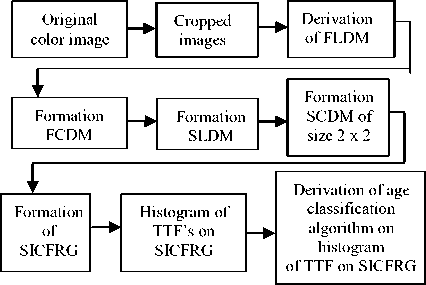
Figure 1. Block diagram for the proposed age group classification system.
-
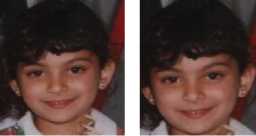
A. Step - 1: The original facial image is cropped based on the two eyes location in the first step. Fig. 2 shows an example of the original facial image and the cropped image.
(a) (b)
Figure 2. a) original image b) cropped image.
-
B. Step - 2: RGB to HSV color model conversion: In color image processing, there are various color models in use today. In order to extract gray level features
from color information, the TTF on SICFRG facial model utilized the HSV color space.
In the RGB model, images are represented by three components, one for each primary color – red, green and blue. Hue is a color attribute and represents a dominant color. Saturation is an expression of the relative purity or the degree to which a pure color is diluted by white light. HSV color space is a non-linear transform from RGB color space that can describe perceptual color relationship more accurately than RGB color space. HSV color space is formed by hue (H), saturation (S) and value (V). Hue denotes the property of color such as blue, green, red. Saturation denotes the perceived intensity of a specific color. Value denotes brightness perception of a specific color. However, HSV color space separates the color into hue, saturation, and value which means observation of color variation can be individually discriminated. In order to transform RGB color space to HSV color space, the transformation is described as follows:
The transformation equations for RGB to HSV color model conversion is given below.
V = max(R,G,В)
V-min ( R , G , В )
S = , ,
H=^^ if V=R
H= +— if V=G
3 6S 1v
H= +^ if V=B where the range of color component Hue (H) is [0,255], the component saturation (S) range is [0,1] and the Value (V) range is [0,255]. In this work, the color component Hue (H) is considered as color information for the classification of facial images. Color is an important attribute for image processing applications.
-
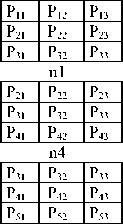
C. Step - 3: Formation of nine overlapped sub 3 x 3 neighborhoods from a 5 x 5 neighborhood: A neighborhood of 5x5 pixels is denoted by a set containing 25 pixel elements P= {P11,…., P33, ...P55}, here P33 represents the intensity value of the central pixel and remaining values are the intensities of neighboring pixels as shown in Fig. 3.
Fig. 4 represents the formation of nine overlapped 3 x 3 sub neighborhoods represented as {n1, n2, n3, n9} from the Fig. 3.
|
P 11 |
P 12 |
P 13 |
P 14 |
P 15 |
|
P 21 |
P 22 |
P 23 |
P 24 |
P 25 |
|
P 31 |
P 32 |
P 33 |
P 34 |
P 35 |
|
P 41 |
P 42 |
P 43 |
P 44 |
P 45 |
|
P 51 |
P 52 |
P 53 |
P 54 |
P 55 |
Figure 3. Representation of a 5 x 5 neighborhood .
n7
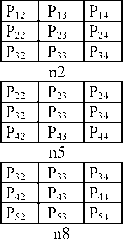
Figure 4. Formation of nine overlapped 3 x 3 neighborhoods {n1, n2, n3, …,, n9} from figure. 3.
-
D. Step - 4: Derivation of First order Local Difference Matrix (FLDM) on the overlapped neighborhoods of 3 x 3 of step three: The FLDM gives an efficient representation of face images. The FLDM is obtained by the absolute difference between the neighboring pixel and the gray value of the central pixel from each of the 3 x 3 neighborhoods i.e. n1 to n9 of step 3. The FLDM mechanism is described by the (6) and shown in Fig. 5. This forms nine new 3 x 3 FLDM’s and represented as { FLDM1, FLDM2, FLDM3,…….., FLDM 9}.
FLDMi = abs (Pi- Pc) for i = 1,2,...9 (6)
where pc and pi are the central pixel and neighboring pixel values of the overlapped 3 x 3 neighborhood {n1,n2,…n9).
The (6) demonstrates that always central pixel value of the 3 x 3 FLDM is zero.
|
│P 11 -P 22 │ |
│P 12 -P 22 │ |
│P 13 -P 22 │ |
|
│P 21 -P 22 │ |
│P 22 -P 22 │ |
│P 23 -P 22 │ |
|
│P 31 -P 22 │ |
│P 32 -P 22 │ |
│P 33 -P 22 │ |
Figure 5. formation of FLDM1 from n1.
-
E. Step - 5: Formation of First order Compressed Difference Matrix (FCDM) of size 3 x 3 from 5 x 5: In step five each pixel value of FCDM is evaluated from each of the nine FLDM’s of step 2 as given in (7). The FCDM is a 3 x 3 matrix with nine pixel elements (FCDP1 to FCDP9). The FCDM maintains the local neighborhood properties including edge information.
FCDPi = Avg of (FLDMi) for i = 1,2,…9 (7)
-
F. Step- 6: Formation of Second order Local Difference Matrix (SLDM): In step six SLDM is
obtained on the FCDM of step 5 using the (8). The SLDM is shown in Fig. 6a.
SLDPi = abs (FCDPi – FCDPc )for FCDP i = 1,2,…9 (8)
where FCDPc and FCDPi are the central pixel and neighboring pixel values of the FCDM.
The SLDM matrix is shown in Fig. 6a. The (8) demonstrates that always central pixel value of the 3 x 3 SLDM is zero
|
SLDP 1 |
SLDP 2 |
SLDP 3 |
|
SLDP 4 |
SLDP 5 |
SLDP 6 |
|
SLDP 7 |
SLDP 8 |
SLDP 9 |
(a)
|
TSP 1 |
TSP 2 |
|
TSP 3 |
TSP 4 |
(b)
SICFRGi =
0 if TSPi< V0and TSPi< x
1 if TSPi< V0and TSPi ≥ x
2 if TSPi= V0
3 if TSPi> V0and TSPi > y
4 if TSPi> V0and TSPi ≤ y
Figure 6. Generation process of a SCDM of size 2×2 from a 3 x 3 SLDM neighborhood.
a) The SLDM neighborhood b) SCDM.
G. Step - 7: Formation of Second order Compressed Difference Matrix (SCDM) of size 2 x 2 from step six: In step 7 the SLDM of a 3×3 neighbourhood is reduced into a 2×2 SCDM by using Triangular Shape Primitives (TSP). The proposed TSP is a connected neighbourhood of three pixels on a 3 x 3 SLDM, without central pixel. The TSP’s on SLDM is not considered central pixel because its gray level value is always zero. The average of these TSP’s generates pixel values of Second order Compressed Difference Matrix (SCDM) of size 2×2 as shown in Fig. 6 and as represented in (9), (10), (11), and (12). By this the proposed method reduces the original image of size N×M into the size (2N/5) × (2M/5).
for i = 1, 2, 3, 4 (13)
where x, y are the user-specified values.
Wℎ =
( ∑ t=lTSPt )
For example, the process of evaluating SICFRG model from a sub SCDM image of 2×2 is shown in Fig.
Ko , Ito
8. In this example x and y are chosen as — and — j 2 2
respectively.
|
28 |
39 |
|
60 |
9 |
(a)
|
1 |
2 |
|
4 |
0 |
(b)
TSP sldp1+sldp2+sldp4 = sldp2+sldp3+sldp6
SLDP4+SLDP7+SLDPg
SLDP6+SLDPg+SLDP9
TSP2
TSP3
TSP1
Figure 8. The process of evaluating SICFRG model from SCDM
(a) SCDM (b) SICFRG model.
H. Step - 8: Reduction of grey level range on SCDM using fuzzy logic: Fuzzy logic has certain major advantages over traditional Boolean logic when it comes to real world applications such as texture representation of real images. To deal accurately with the regions of natural images even in the presence of noise and the different processes of caption and digitization fuzzy logic is introduced on SCDM. The proposed fuzzy logic converts the SCDM grey level range in to 5 levels ranging from 0 to 4. That is the reason the derived model is named as SICFRG model . In LBP binary patterns are evaluated by comparing the neighboring pixels with central pixel. The proposed Second order Image Compressed and Fuzzy Reduced Grey level (SICFRG) model is derived by comparing the each pixel of the 2×2 SCDM with the average pixel values of the SCDM. The SICFRG representation is shown in Fig. 7. The following (13) is used to determine the elements of SICFRG model.
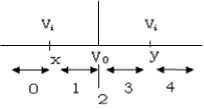
Figure 7. Fuzzy representation of SCDM model of the image
-
I. Step - 9: Find the occurrences of Bezier curves (12 patterns) with different control points, U, V and T patterns on each of the different fuzzy grey levels 0, 1, 2, 3 and 4 as described in section 2.1.
-
J. Step - 10: Based on the frequency occurrences of above TTF of SICFRG model on the facial image, the image is classified as child (0-12), young adults (1325), middle adults (26-45), senior adults (46-60), and old adults (above 60).
2.1 Evaluation of the frequency occurrences of TTF on SICFRG facial Images:
The present Paper initially converts facial image in to SICFRG model, which reduces the overall dimension into (2N/5 x 2M/5) with grey levels ranging from 0 to 4 and while preserving the important texture features and edge information without any loss.
The proposed TTF on SICFRG is considered an exhaustive number of Bezier curves because they represent good topological changes of facial skin as age progress out. The present research considered Bezier curves with twelve different control points on each 5 x 5 mask as shown in Fig. 9. The TTF i.e. U, V and T patterns on a 5x5 mask are shown in Fig. 10.
TTF are evaluated on each of the fuzzy values. That is the frequency occurrences of Bezier curves with different fuzzy grey level values i.e. 0, 1, 2, 3 and 4 are evaluated and denoted as B0, B1, B2, B3 and B4 respectively. In the same way U, V, T patterns are evaluated with different fuzzy grey level values. To have a precise and accurate age group classification, the present study considered sum of the frequencies of occurrences of all TTF’s.
|
1 |
1 |
0 |
0 |
0 |
|
0 |
1 |
0 |
0 |
0 |
|
0 |
1 |
1 |
0 |
0 |
|
0 |
0 |
1 |
1 |
0 |
|
0 |
0 |
0 |
0 |
1 |
|
CP (1, 2), (2,1) |
||||
|
1 |
1 |
0 |
0 |
0 |
|
0 |
1 |
0 |
0 |
0 |
|
0 |
1 |
1 |
0 |
0 |
|
0 |
0 |
1 |
1 |
0 |
|
0 |
0 |
0 |
1 |
1 |
|
CP (1,3), (3,1) |
||||
|
1 |
1 |
0 |
0 |
0 |
|
0 |
1 |
1 |
0 |
0 |
|
0 |
0 |
1 |
0 |
0 |
|
0 |
0 |
1 |
1 |
0 |
|
0 |
0 |
0 |
1 |
1 |
|
CP (1,4), (4,1) |
||||
|
1 |
1 |
1 |
0 |
0 |
|
0 |
0 |
1 |
0 |
0 |
|
0 |
0 |
1 |
0 |
0 |
|
0 |
0 |
1 |
0 |
0 |
|
0 |
0 |
1 |
1 |
1 |
|
CP (1,5), (5,1) |
||||
|
1 |
0 |
0 |
0 |
0 |
|
1 |
1 |
1 |
0 |
0 |
|
0 |
0 |
1 |
0 |
0 |
|
0 |
0 |
1 |
1 |
0 |
|
0 |
0 |
0 |
1 |
1 |
|
CP (2,1), (1,2) |
||||
|
1 |
1 |
0 |
0 |
0 |
|
0 |
1 |
1 |
0 |
0 |
|
0 |
0 |
1 |
1 |
0 |
|
0 |
0 |
0 |
1 |
0 |
|
0 |
0 |
0 |
1 |
1 |
|
CP (3,5), (5,3) |
||||
|
1 |
0 |
0 |
0 |
0 |
|
0 |
1 |
0 |
0 |
0 |
|
0 |
0 |
1 |
0 |
0 |
|
0 |
0 |
0 |
1 |
0 |
|
0 |
0 |
0 |
0 |
1 |
|
CP (1,1), (1,1) |
||||
|
1 |
0 |
0 |
0 |
0 |
|
0 |
1 |
1 |
0 |
0 |
|
0 |
0 |
1 |
1 |
0 |
|
0 |
0 |
0 |
1 |
0 |
|
0 |
0 |
0 |
1 |
1 |
|
CP (4,5), (5,4) |
||||
|
1 |
0 |
0 |
0 |
0 |
|
1 |
1 |
1 |
0 |
0 |
|
0 |
0 |
1 |
1 |
0 |
|
0 |
0 |
0 |
1 |
1 |
|
0 |
0 |
0 |
0 |
1 |
|
CP (3,1), (1,3) |
||||
|
1 |
0 |
0 |
0 |
0 |
|
1 |
1 |
0 |
0 |
0 |
|
0 |
1 |
1 |
1 |
0 |
|
0 |
0 |
0 |
1 |
1 |
|
0 |
0 |
0 |
0 |
1 |
|
CP (3,2), (2,3) |
||||
|
1 |
0 |
0 |
0 |
0 |
|
1 |
0 |
0 |
0 |
0 |
|
1 |
1 |
1 |
1 |
1 |
|
0 |
0 |
0 |
0 |
1 |
|
0 |
0 |
0 |
0 |
1 |
|
CP (5,1), (1,5) |
||||
|
1 |
0 |
0 |
0 |
0 |
|
1 |
1 |
0 |
0 |
0 |
|
0 |
1 |
1 |
0 |
0 |
|
0 |
0 |
1 |
1 |
1 |
|
0 |
0 |
0 |
0 |
1 |
|
CP (5,3), (3,5) |
||||
Figure 9. Bezier curve patterns on a 5×5 window with 00 orientation using various control points (CP) with fuzzy value 1.
|
1 |
0 |
0 |
0 |
1 |
|
1 |
0 |
0 |
1 |
1 |
|
1 |
0 |
0 |
0 |
1 |
|
1 |
0 |
0 |
0 |
1 |
|
1 |
1 |
1 |
1 |
1 |
|
1 |
0 |
0 |
0 |
1 |
|
1 |
0 |
0 |
0 |
1 |
|
1 |
0 |
0 |
0 |
1 |
|
0 |
1 |
0 |
1 |
0 |
|
0 |
0 |
1 |
0 |
0 |
|
1 |
1 |
1 |
1 |
1 |
|
0 |
0 |
1 |
0 |
0 |
|
0 |
0 |
1 |
0 |
0 |
|
0 |
0 |
1 |
0 |
0 |
|
0 |
0 |
1 |
0 |
0 |
(a) (b) (c)
Figure 10. Alphabetic patterns on a 5×5 mask with 00 orientations with fuzzy value 1.
(a)U-pattern, (b) V-pattern, (c) T-pattern.
III. RESULTS AND DISCUSSIONS
The present paper established a database from the 1002 face images collected from FG-NET database and other 600 images collected from the scanned photographs. This leads a total of 1602 sample facial images. In the proposed TTF on SICFRG model the sample images are grouped into five age groups of 0 to 12, 13 to 25, 26 to 45, 46 to 60, and above 60 based on
the frequency of occurrence of TTF’s of the facial image. The table one clearly indicates the frequency occurrences of Bezier curves with different control points with different grey level values. In the table 1 Bo, Uo, Vo and To represents the sum of frequency occurrences or histograms of Bezier curves, U, V, T patterns respectively with fuzzy grey level value0.
From the table 1 it is observed that fuzzy grey level value 2 on the SICFRG model has formed majority of TTF and remaining fuzzy grey level values does not form any TTF. So, for classification purpose the present research evaluated and considered only fuzzy grey level value 2.
The table 2 clearly represents Frequency occurrences of TTF on SICFRG model with grey level value 2. In table 2 STTF indicates the sum of frequencies of all TTF with fuzzy grey level value 2.
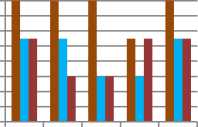
Based on the STTF on SICFRG model with fuzzy grey level 2 on FG-NET ageing database an algorithm is derived for an efficient age classification into five groups which is shown in algorithm 1. The Fig. 11 indicates the classification graph.
Algorithm 1: Age group classification based on sum of frequency occurrences of TTF (STTF) on SICFRG model with grey level value 2 on FG-NET ageing database.
BEGIN
Let the sum of frequencies of TTF is denoted as STTF.
if (STTF < 650 )
Print (facial image age is old adults ( > 60))
Else if (STTF < 950)
Print (facial image age is senior adults (46-60))
Else if (STTF < 1100)
Print (facial image age is middle-aged adults (2645))
Else if (STTF < 1350)
Print (facial image age is young adults (13-25)) Else
Print (facial image age is child (0-12))
End
TABLE 1: Frequency occurrences of TTF using SICFRG on FG-NET sample ageing database
|
S. No. |
Image Name |
B0 |
B1 |
B2 |
B3 |
B4 |
U0 |
U1 |
U2 |
U3 |
U4 |
V0 |
V1 |
V2 |
V3 |
V4 |
T0 |
T1 |
T2 |
T3 |
T4 |
|
1 |
001A05 |
0 |
0 |
1258 |
0 |
0 |
0 |
0 |
65 |
0 |
0 |
0 |
0 |
111 |
0 |
0 |
0 |
0 |
114 |
0 |
0 |
|
2 |
001A08 |
0 |
0 |
1155 |
0 |
0 |
0 |
0 |
61 |
0 |
0 |
0 |
0 |
99 |
0 |
0 |
0 |
0 |
95 |
0 |
0 |
|
3 |
008A12 |
0 |
0 |
1110 |
0 |
0 |
0 |
0 |
69 |
0 |
0 |
0 |
0 |
109 |
0 |
0 |
0 |
0 |
116 |
0 |
0 |
|
4 |
001A14 |
0 |
0 |
1041 |
0 |
0 |
0 |
0 |
69 |
0 |
0 |
0 |
0 |
84 |
0 |
0 |
0 |
0 |
110 |
0 |
0 |
|
5 |
001A18 |
0 |
0 |
937 |
0 |
0 |
0 |
0 |
38 |
0 |
0 |
0 |
0 |
74 |
0 |
0 |
0 |
0 |
84 |
0 |
0 |
|
6 |
001A22 |
0 |
0 |
1052 |
0 |
0 |
0 |
0 |
58 |
0 |
0 |
0 |
0 |
90 |
0 |
0 |
0 |
0 |
85 |
0 |
0 |
|
7 |
001A28 |
0 |
0 |
841 |
0 |
0 |
0 |
0 |
47 |
0 |
0 |
0 |
0 |
64 |
0 |
0 |
0 |
0 |
77 |
0 |
0 |
|
8 |
001A33 |
0 |
0 |
779 |
0 |
0 |
0 |
0 |
51 |
0 |
0 |
0 |
0 |
68 |
0 |
0 |
0 |
0 |
76 |
0 |
0 |
|
9 |
001A40 |
0 |
0 |
860 |
0 |
0 |
0 |
0 |
31 |
0 |
0 |
0 |
0 |
66 |
0 |
0 |
0 |
0 |
65 |
0 |
0 |
|
10 |
003A47 |
0 |
0 |
656 |
0 |
0 |
0 |
0 |
32 |
0 |
0 |
0 |
0 |
55 |
0 |
0 |
0 |
0 |
52 |
0 |
0 |
|
11 |
006A55 |
0 |
0 |
753 |
0 |
0 |
0 |
0 |
52 |
0 |
0 |
0 |
0 |
63 |
0 |
0 |
0 |
0 |
68 |
0 |
0 |
|
12 |
003A60 |
0 |
0 |
614 |
0 |
0 |
0 |
0 |
41 |
0 |
0 |
0 |
0 |
59 |
0 |
0 |
0 |
0 |
73 |
0 |
0 |
|
13 |
006A61 |
0 |
0 |
491 |
0 |
0 |
0 |
0 |
28 |
0 |
0 |
0 |
0 |
52 |
0 |
0 |
0 |
0 |
54 |
0 |
0 |
|
14 |
004A63 |
0 |
0 |
361 |
0 |
0 |
0 |
0 |
0 |
0 |
0 |
0 |
0 |
2 |
0 |
0 |
0 |
0 |
0 |
0 |
0 |
|
15 |
006A69 |
0 |
0 |
379 |
0 |
0 |
0 |
0 |
0 |
0 |
0 |
0 |
0 |
3 |
0 |
0 |
0 |
0 |
0 |
0 |
0 |
TABLE 2: Frequency occurrences of TTF on SICFRG model with grey level value 2 on FG-NET ageing database.
|
S. No. |
Image Name |
B2 |
U2 |
V2 |
T2 |
STTF |
|
1 |
001A05 |
1258 |
65 |
111 |
114 |
1548 |
|
2 |
001A08 |
1155 |
61 |
99 |
95 |
1410 |
|
3 |
008A12 |
1110 |
69 |
109 |
116 |
1404 |
|
4 |
008A03 |
1135 |
62 |
107 |
113 |
1417 |
|
5 |
001A02 |
1127 |
62 |
107 |
98 |
1394 |
|
6 |
002A12 |
1207 |
67 |
98 |
111 |
1483 |
|
7 |
002A07 |
1234 |
63 |
112 |
106 |
1515 |
|
8 |
002A05 |
1198 |
64 |
106 |
103 |
1471 |
|
9 |
008A06 |
1164 |
69 |
103 |
104 |
1440 |
|
10 |
001A10 |
1153 |
71 |
101 |
99 |
1424 |
|
11 |
001A14 |
1041 |
69 |
84 |
110 |
1304 |
|
12 |
001A18 |
937 |
38 |
74 |
84 |
1133 |
|
13 |
001A22 |
1052 |
58 |
90 |
85 |
1285 |
|
14 |
008A13 |
938 |
48 |
84 |
85 |
1155 |
|
15 |
002A16 |
1034 |
45 |
67 |
113 |
1259 |
|
16 |
002A23 |
937 |
43 |
91 |
87 |
1158 |
|
17 |
001A19 |
1064 |
57 |
85 |
93 |
1299 |
|
18 |
002A15 |
1103 |
47 |
81 |
89 |
1320 |
|
19 |
002A16 |
1106 |
54 |
75 |
91 |
1326 |
|
20 |
002A20 |
1057 |
49 |
81 |
90 |
1277 |
|
21 |
001A28 |
841 |
47 |
64 |
77 |
1029 |
|
22 |
001A33 |
779 |
51 |
68 |
76 |
974 |
|
23 |
001A40 |
860 |
31 |
66 |
65 |
1022 |
|
24 |
005A45 |
878 |
33 |
65 |
79 |
1055 |
|
25 |
002A26 |
913 |
32 |
66 |
77 |
1088 |
|
26 |
002A31 |
918 |
39 |
64 |
68 |
1089 |
|
27 |
002A29 |
897 |
37 |
67 |
72 |
1073 |
|
28 |
002A36 |
895 |
36 |
67 |
69 |
1067 |
|
29 |
002A38 |
799 |
41 |
69 |
73 |
982 |
|
30 |
003A35 |
817 |
37 |
65 |
71 |
990 |
|
31 |
003A47 |
656 |
32 |
55 |
52 |
795 |
|
32 |
006A55 |
753 |
52 |
63 |
68 |
936 |
|
33 |
003A60 |
614 |
41 |
59 |
73 |
787 |
|
34 |
004A48 |
714 |
43 |
61 |
67 |
885 |
|
35 |
004A53 |
721 |
45 |
57 |
63 |
886 |
|
36 |
006A59 |
672 |
39 |
54 |
71 |
836 |
|
37 |
003A49 |
715 |
46 |
49 |
70 |
880 |
|
38 |
003A51 |
694 |
50 |
61 |
73 |
878 |
|
39 |
003A58 |
599 |
46 |
56 |
71 |
772 |
|
40 |
004A51 |
619 |
43 |
54 |
68 |
784 |
|
41 |
006A61 |
491 |
28 |
52 |
54 |
625 |
|
42 |
004A63 |
361 |
14 |
29 |
35 |
439 |
|
43 |
006A69 |
379 |
15 |
35 |
36 |
465 |
|
44 |
004A66 |
619 |
27 |
36 |
43 |
725 |
|
45 |
006A67 |
437 |
19 |
48 |
52 |
556 |
|
46 |
006A69 |
515 |
23 |
43 |
39 |
620 |
|
47 |
004A62 |
493 |
18 |
45 |
37 |
593 |
|
48 |
005A61 |
415 |
19 |
38 |
43 |
515 |
|
49 |
005A63 |
468 |
24 |
41 |
44 |
577 |
|
50 |
004A65 |
375 |
28 |
42 |
42 |
487 |
|
^^^^^™0-12 |
|
|
2000 |
|
|
1500 |
13-25 |
|
1000 |
26-45 |
|
500 |
^^^^^™ 46-60 |
|
0 |
> 60 |
|
13579 |
To evaluate the accuracy, and significance of the proposed TTF on SICFRG model probe or test images are taken. On probe image, STTF’s with fuzzy grey level value 2 is evaluated on the facial image. As an experimental case 40 face samples, randomly collected from FG-NET, Google database and some Scanned images, are tested with the proposed method and the results are given in Table 3. The classification percentage of three datasets is shown in table 4 and classification graph of three datasets are shown in Fig. 12.
Figure 11. Age Classification graph based on the proposed method.
TABLE 3: Classification results of the proposed TTF on SICFRG model on test images.
|
S. No |
Image Name |
B2 |
U2 |
V2 |
T2 |
STTF |
Classified Age Group |
Results |
|
1 |
001A0 |
1227 |
6 |
1 |
1 |
1519 |
0-12 |
Succes |
|
2 |
002A1 |
1025 |
5 |
8 |
8 |
1256 |
13-25 |
Succes |
|
3 |
003A2 |
976 |
4 |
7 |
8 |
1183 |
13-25 |
Succes |
|
4 |
005A2 |
1075 |
4 |
8 |
9 |
1296 |
13-25 |
Succes |
|
5 |
063A0 |
1137 |
6 |
9 |
1 |
1406 |
0-12 |
Succes |
|
6 |
064A1 |
1024 |
5 |
8 |
1 |
1259 |
13-25 |
Succes |
|
7 |
064A5 |
707 |
3 |
5 |
6 |
869 |
46-60 |
Succes |
|
8 |
065A0 |
1107 |
6 |
1 |
9 |
1380 |
0-12 |
Succes |
|
9 |
067A1 |
1036 |
5 |
7 |
9 |
1267 |
13-25 |
Succes |
|
10 |
022A2 |
854 |
3 |
6 |
7 |
1029 |
26-45 |
Succes |
|
11 |
023A2 |
789 |
5 |
5 |
7 |
970 |
26-45 |
Succes |
|
12 |
024A3 |
878 |
4 |
5 |
8 |
1063 |
26-45 |
Succes |
|
13 |
025A4 |
697 |
3 |
5 |
7 |
865 |
46-60 |
Succes |
|
14 |
027A3 |
889 |
3 |
5 |
7 |
1055 |
26-45 |
Succes |
|
15 |
017A6 |
462 |
1 |
3 |
3 |
558 |
>60 |
Succes |
|
16 |
018A3 |
819 |
3 |
6 |
6 |
986 |
26-45 |
Succes |
|
17 |
020A3 |
835 |
3 |
6 |
6 |
1000 |
26-45 |
Succes |
|
18 |
025A5 |
434 |
2 |
4 |
3 |
532 |
>60 |
Succes |
|
19 |
Sci-1 |
905 |
4 |
6 |
6 |
1079 |
26-45 |
Succes |
|
20 |
Sci-2 |
837 |
4 |
6 |
7 |
1012 |
26-45 |
Succes |
|
21 |
Sci-3 |
993 |
4 |
7 |
8 |
1205 |
13-25 |
Succes |
|
22 |
Sci-4 |
796 |
3 |
6 |
6 |
954 |
26-45 |
Succes |
|
23 |
Sci-5 |
814 |
4 |
5 |
6 |
978 |
26-45 |
Succes |
|
24 |
Sci-6 |
1023 |
4 |
8 |
8 |
1232 |
13-25 |
Succes |
|
25 |
Sci-7 |
1102 |
4 |
8 |
8 |
1308 |
13-25 |
Succes |
|
26 |
Sci-8 |
1075 |
4 |
7 |
9 |
1298 |
13-25 |
Succes |
|
27 |
20-2 |
1057 |
5 |
8 |
9 |
1284 |
13-25 |
Succes |
|
28 |
25-1 |
827 |
3 |
6 |
6 |
998 |
26-45 |
Succes |
|
29 |
25-2 |
819 |
3 |
6 |
7 |
990 |
26-45 |
Succes |
|
30 |
25-3 |
847 |
3 |
5 |
7 |
1009 |
26-45 |
Succes |
|
31 |
40-6 |
857 |
3 |
5 |
6 |
1014 |
26-45 |
Succes |
|
32 |
40-1 |
836 |
2 |
5 |
6 |
985 |
26-45 |
Succes |
|
33 |
40-2 |
704 |
3 |
6 |
7 |
877 |
46-60 |
Succes |
|
34 |
40-3 |
697 |
4 |
6 |
7 |
879 |
46-60 |
Succes |
|
35 |
40-4 |
667 |
4 |
6 |
6 |
842 |
46-60 |
Succes |
|
36 |
40-5 |
513 |
1 |
3 |
4 |
609 |
>60 |
Succes |
|
37 |
35-1 |
473 |
2 |
3 |
4 |
576 |
>60 |
Succes |
|
38 |
50-1 |
635 |
4 |
6 |
6 |
808 |
46-60 |
Fail |
|
39 |
50-2 |
514 |
2 |
4 |
4 |
627 |
>60 |
Succes |
|
40 |
50-3 |
399 |
2 |
4 |
4 |
505 |
>60 |
Succes |
100.00%
99.00%
98.00%
97.00%
96.00%
95.00%
94.00%
93.00%
92.00%
■ FG-NET database
■ Google database
■ Scanned images

TABLE 4: Classification results of three datasets on proposed TTF on SICFRG model.
|
Image Dataset |
FG-NET database |
Google database |
Scanned images |
|
Child |
100.00% |
97.50% |
97.50% |
|
Young adults |
100.00% |
97.50% |
95.00% |
|
Middle Adults |
100.00% |
95.00% |
95.00% |
|
Senior Adults |
97.50% |
95.00% |
97.50% |
|
Old Adults |
100.00% |
97.50% |
97.50% |
100.00%
98.00%
96.00%
94.00%
92.00%
90.00%
88.00%
86.00%
■ Morphological Primitive Patterns with Grain Components on LDP
■ Geometric properties
<Ф -^ ^ s
■ Proposed method
Figure 12. Mean classification of three datasets.
-
IV. COMPARISON WITH OTHER EXISTING METHODS:
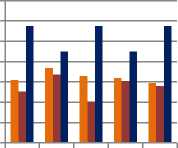
The proposed TTF on SICFRG model is compared with Morphological Primitive Patterns with Grain Components on LDP approach [24] and geometric properties [29] methods. The percentage of classification rates of the proposed TTF on SICFRG model and other existing methods [24, 31] are listed in table 5. The table 5 clearly indicates that the proposed method yields better classification rate when compared with existing methods. Fig. 13 shows the comparison chart of the proposed TTF on SICFRG model with the other existing methods of table 5.
TABLE 5: % mean classification rates for proposed TTF-SICFRG method and other existing methods.
|
Image Dataset |
Morphological Primitive Patterns with Grain Components on |
Geometric properties |
proposed TTF on SICFRG model |
|
Child |
92.17% |
91.04% |
97.50% |
|
Young adults |
93.37% |
92.71% |
95.00% |
|
Middle Adults |
92.56% |
90.07% |
97.50% |
|
Senior Adults |
92.40% |
92.10% |
95.00% |
|
Old Adults |
91.90% |
91.60% |
97.50% |
Figure 13. Comparison graph of proposed TTF on SICFRG model with other existing methods.
-
V. SUMMARY
The present paper developed a new direction for age group classification using frequency occurrences of TTF on SICFRG. The proposed method reduces overall dimensionality drastically while preserving the texture edge and other significant features. The proposed method reduces the overall complexity of classification algorithm because of the facial image size is reduced from N×M to 2N/5 ×2M/5 and also reduced the gray level range 0 to 4. The TTF’s are evaluated on each of the fuzzy gray level and found that only TTF’s are formed only on fuzzy gray level value 2. The other important feature of the present TTF on SICFRG is out of these TTF Bezier curve estimates, the rapid topological changes in the skin at a higher rate, which is the reason an exhaustive number of Bezier curves with twelve different control points are estimated on each 5 x 5 mask. The performance of the present system is more effective for the FG-NET aging database when compare with Google Images and scanned images.
ACKNOWLEDGMENT
I would like to express my cordial thanks to Sri. M.N.Raju, Chairman, Sri. M. Ravi Varma, Director -MNR Educational Trust, Hyderabad, CA. Basha Mohiuddin, Chairman - Vidya Group of Institutions, Hyderabad for providing moral support and encouragement and Dr. P.Rajeswara Reddy, Chairman - Anurag Group of Institutions, Hyderabad for providing advanced research facilities and MGNIRSA, Hyderabad for providing necessary Infrastructure. Authors would like to thank the anonymous reviewers for their valuable comments. And they would like to thank Dr.G.V.S.Ananta Lakshmi, Professor in Dept. of ECS, Anurag Group of Institutions for her invaluable suggestions and constant encouragement that led to improvise the presentation quality of this paper.
References An Effective Age Classification Using Topological Features Based on Compressed and Reduced Grey Level Model of The Facial Skin
- Chellappa, R., Wilson, C.L. and Sirohey, S., “ Human and machine recognition of faces: A survey, “ proc. of the IEEE, vol.83, pp. 705-740 (1995).
- Choi, C., “Age change for predicting future faces”, proc. IEEE Int. Conf. on fuzzy systems, vol 3, pp. 1603-1608 (1999).
- A. Lanitis, C. Draganova, and C. Christodoulou. Comparing different classifiers for automatic age estimation. IEEE Transactions on Systems, Man, and Cybernetics, Part B, 34(l):621-628, February 2004.
- Y. H. Kwon and N. V. Lobo,”Age classification from facial images,” Computer Vision and Image Understanding, vol.74, no.1 pp.1-21, 1999.
- B. Pittenger and R. E. Shaw. Aging faces as viscal-elastic events: Implications for a theory of nonrigid shape perception. Journal of Experimental Psychology: Human Perception and Performance, 1(4):374-382 1975.
- J. B. Pittenger, R. E. Shaw, and L. S. Mark. Perceptual information for the age level of faces as a higher order invariant of growth. Jourtal of Experimental Psychology: Hufman Perception and Per-finance, 5(3):478-493, 1979.
- L. S. Mark and J. T. Todd. The perception of growth in three dimensions. Jourrial ofPerception and Psychophysics, 33(2):193-196, 1983.
- L. S. Mark, J. B. Pittenger, H. Hines, C. Carello, R. E. Shaw, and J. T. Todd. “Wrinkling and head shape as coordinated sources of age level information”, Journal of Perception and Psychophysics, 27(2):1L17-124, 1980.
- D. Burt and D. Perrett. Perception of age in adult caucasian male faces: computer graphic manipulation of shape and colour information. Proceedings of the Royal Society ofLondon B, B-259:137-143, 1995.
- Kwon, Y. H. and da Vitoria Lobo, N., “Age classification from facial images,” Proc. IEEE Conf. on Computer Vision and Pattern Recognition, Seattle, Washington, U. S. A., pp. 762-767 (1994).
- Y Wu, N. Thalmaun, and D. Thalimnann. A dynaimnic wrinkle model in facial animation and skin aging. Journal of Visualization and Computer Animation, 6:195-205, 1995.
- A. Lanitis, C. Draganova, and C. Christodoulou. Comparing different classifiers for automatic age estimation. IEEE Transactions on Systems, Man, and Cybernetics, Part B, 34(l):621-628, February 2004.
- A. Lanitis, C. Taylor, and T. Cootes. Toward automatic simulation of aging effects on face images. IEEE Tran.sactions on Pattern Analysis and Machine Intelligence, 24(4):442-455, April 2002.
- N. Ramanathan and R. Chellappa. Face verification across age progression. IEEE Transactions on lmage Processing, 15(11L):3349- 3361, November 2006.
- C. Scandrett, C. Solomon, and S. Gibson. A personspecific, rigorous aging model of the human face. Prttern Recogtnioti Letters, 27(15):1776-1787B November 2006.
- J. Suo, F. Min, S. Zhu, S. Shan, and X. Chen. A multiresolution dynamic model for face aging simulation. In IEEE Conference of Computer Vision and Pattern Recognition, pages 1-8B 2007.
- X. Geng, Z. Zhou, and K. Smith-Miles. Automatic age estimation based on facial aging patterns. IEEE Transactions on Pattern Analysis and Machine Ititelligence, 29(12):2234-2240, December 2007.
- N. Ramanathan and R. Chellappa. Modeling age progression in young faces. In Proceedings of IEEE International Con/conference on Computer Vision and Porttern Recognition, pages 387-394, 2006.
- Kwon, Y. H. and da Vitoria Lobo, N., “Age classification from facial images,” Proc. IEEE Conf. on Computer Vision and Pattern Recognition, Seattle, Washington, U. S. A., pp. 762-767 (1994).
- F. Yun, X. Ye and T. S. Huang, "Estimating Human Age by Manifold Analysis of Face Pictures and Regression on Aging Features," in Proc. of 2007 IEEE International Conference on Multimedia and Expo, 2007, pp. 1383-1386.
- Wen-Bing Horng, Cheng-Ping Lee and Chun-Wen Chen “Classification of Age Groups Based on Facial Features”, Tamkang Journal of Science and Engineering, Vol. 4, No. 3, pp. 183-192 (2001).
- N. Ramanathan and R. Chellappa. Face verification across age progression. In IEEE Conference on Computer Vision and Pattern Recognition, volume 2, pages 462–469, San Diego, U.S.A, 2005.
- T. Ahonen, A. Hadid, M. Pietikainen, “Face Description with Local Binary Patterns: Application to Face Recognition”, IEEE Trans. Pattern Anal. Mach. Intell., vol. 28, no. 12, pp. 2037 –2041, 2006.
- B.Sujatha, Dr.V.Vijaya Kumar, M.Rama Bai “Morphological Primitive Patterns with Grain Components on LDP for Child and Adult Age Classification” in International Journal of Computer Applications (0975 – 8887) Volume 21– No.3, pp. 50-55, May 2011.
- Todd J. T., Mark L. S., Shaw R. E. and Pittenger J. B. “The perception of human growth,” Scientific American, 242(2):132–144, 1980.
- Kwon Y. H. and da Vitoria Lobo N. “Age classification from facial images,” Proc. IEEE Conf. on Computer Visionand Pattern Recognition, Seattle, Washington, U. S. A., pp. 762-767 (1994).
- Hasegawa H. and Simizu E. “Discrimination of facial age generation using neural networks,” T.IEE Japan, vol.117-C, no.12, pp.1897–1898, 1997.
- Kosugi M. “Human-face recognition using mosaic pattern and neural networks,” IEICE Trans., vol.J76-D-II, no.6, pp.1132–1139, June 1993.
- Chandra Mohan M., Vijaya Kumar V. and Damodaram A. ”Novel Method of Adulthood Classification based on Geometrical Features of Face,” Accepted by GVIP Journal of Graphics, Vision and Image Processing, to publish in June, 2010 issue.
- Sirovich L. and Kirby M. “Low-dimensional procedure for the characterization of human face,” J. Opt. Am. A, vol.7, no.3, pp.519–524, 1987.
- Chandra Mohan M., Vijaya Kumar V. and Venkata Krishna V. ”Novel Method of Adult Age Classification Using Linear Wavelet Transforms,” IJCSNS International Journal of Computer Science and Network Security, VOL. 10 No. 3, pp. 61-68, March, 2010.
