An efficiency optimization for network intrusion detection system

Author: Mahmoud M. Sakr, Medhat A. Tawfeeq, Ashraf B. El-Sisi
Journal: International Journal of Computer Network and Information Security @ijcnis
Article in issue: 10 vol.11, 2019.
Free access
With the enormous rise in the usage of computer networks, the necessity for safeguarding these networks is also increased. Network intrusion detection systems (NIDS) are designed to monitor and inspect the activities in a network. NIDS mainly depends on the features of the input network data as these features give information on the behaviour nature of the network traffic. The irrelevant and redundant network features negatively affect the efficacy and quality of NIDS, particularly its classification accuracy, detection time and processing complexity. In this paper, several feature selection techniques are applied to optimize the efficiency of NIDS. The categories of the applied feature selection techniques are the filter, wrapper and hybrid. Support vector machine (SVM) is employed as the detection model to classify the network connections behaviour into normal and abnormal traffic. NIDS is trained and tested on the benchmark NSL-KDD dataset. The performance of the applied feature selection techniques is compared with each other and the results are discussed. Evaluation results demonstrated the superiority of the wrapper techniques in providing the highest classification accuracy with the lowest detection time and false alarms of the NIDS.
Intrusion Detection System, Network Anomaly Detection, Features Selection, Dimensionality Reduction, NSL-KDD, Swarm Intelligence
Short address: https://sciup.org/15015716
IDR: 15015716 | DOI: 10.5815/ijcnis.2019.10.01
Text of the scientific article An efficiency optimization for network intrusion detection system
With the rapid progress of the communication industry, the technologies utilization has turned into an essential part of the daily life and the connected devices to the internet are in continuously raise [1]. Consequently, unauthorized activities targeting systems of these connected devices raised too. Any tries aim to violate the confidentiality, integrity, and availability (CIA) of a system denoted as an intrusion. Intrusion detection system (IDS) is meant by observing and auditing the occurring activities patterns in computer network [2]. Based on the placement/deployment of the IDS, it divided into three categories: Host-based IDS (HIDS) which observes and audits the host events to detect intrusions inside the host itself, Network-based IDS (NIDS) which monitors and inspects the network activities at the network level to detect the intrusive patterns of network traffic flow and Distributed based IDS (DIDS) that incorporates many HIDS, NIDS or a hybrid of them where they're deployed over a large network for collaboratively observing and checking its activities [3]. The detection strategies of the IDS are divided into three types: Anomaly-based IDS in which it recognizes the intrusions based on any deviation from an acceptable or normal behaviour, Signature-based IDS in which it identifies the intrusions based on known attacks patterns and Hybrid-based IDS in which it incorporates the anomaly and signature-based IDS to supply an inclusive detection ability [4]. NIDS deals with tremendous sizes of network traffic data, and employees data mining and machine learning techniques to analyze and classify the behaviour of these data. Network traffic data are represented by numbers of connection records which consist of sets of network features such as the protocol type, service and flags. One of the challenges that are negatively affecting the learning algorithm efficiency during the learning process from the network traffic data is the existence of irrelevant and noisy features. Such these features increase the training time, overfitting, false alarms generation rates, and computation costs. Eliminating such these features are carried by the feature selection process. Network feature selection is performed by selecting the most informative features from the network traffic data which are sufficient for better identification of network traffic behaviour with higher accuracy and in lesser time [5]. The limitation of the network feature selection process is removing some important network features during the reduction process and therefore losing some of the network data properties. In this paper, several network feature selection techniques are applied to study which of them can optimise the NIDS classification performance. NSL-KDD dataset is utilized as the network data source while the SVM algorithm is adopted for the network traffic classification [6]. The rest of this paper is organized as follows. Several literatures related to this study are highlighted in section II. Section III explains the applied network feature selection techniques in detail. Implementation and experimental results are discussed in section IV. Section V concludes this paper and presents future directions.
-
II. Related Works
Generally, as shown in Fig. 1, the constructing of the NIDS is performed as follow. The network traffic data is captured and logged from the network devices. These data are mapped and normalized before being processed as it includes many features with varied types and different value ranges. Thereafter, the most informative network features of these data are selected, and a suitable learning algorithm learns its behaviour. Accordingly, building an efficient intrusion detection model that can perfectly recognize the behaviour of the input network traffic. Several criterions are used to evaluate the NIDS performance.
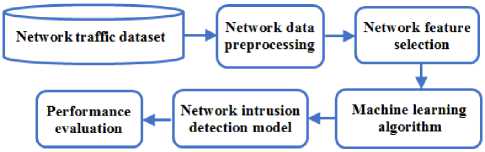
Fig.1. Development Processes Schematic of the Network Intrusion Detection System (NIDS)
Researchers usually incorporate the methodologies of feature selection with the machines leaning techniques in building the NIDS to achieve an effective classification performance as follows.
In [7], M. Sakr, M.Tawfeeq and A. ElSisy proposed an efficient anomaly based NIDS for the cloud environment. They utilized the particle swarm optimization (PSO) with its two versions (standard and binary based PSO) to enhance the SVM classification model. Standard-based PSO is employed for the SVM control parameters tuning. Binary-based PSO is utilized to obtain mostly informative features from the incoming network traffic before the classification procedure. Performance results proved the NIDS effectiveness in perceiving the nature of incoming network traffic. In [8], Hajimirzaei and Jafari used the fuzzy clustering technique to divide the NSL-KDD intrusion dataset into several subsets to train the multilayer perceptron network (MLP) as the classification model of the proposed NIDS. During the model training phase, the artificial bee colony (ABC) technique employed to optimise the MLP classification model by tunning its weights and biases. They assessed their NIDS performance and the results demonstrated its efficiency in comparison with other related NIDSs. In [9], Khorram and Baykan implemented several evolutionary techniques (Ant Colony Optimization (ACO), ABC and PSO) for the network feature selection of the incoming network traffic for the proposed NIDS. The classification model of NIDS built by the KNN and SVM and tested by the NSL-KDD intrusion dataset. Evaluation results stated that the performance of the ABC technique was superior in providing the highest classification accuracy for their NIDS. In [10], Jabez and Gowri proposed NIDS to detect intrusions in a given network. The procedure of the relevant feature selection of input network traffic is carried out by the correlation feature selection (CFS) technique. MLP based neural network is employed to train the NIDS classification model and its performance is evaluated on the NSL-KDD dataset. Several varied sizes of the used dataset are utilized to evaluate their NIDS with other machine learning algorithms. Evaluation results stated that their NIDS provided the best performance in terms of the highest attack detection rate with the least execution time. In [11], Aslahi and Rahmani integrated the genetic algorithm (GA) with the SVM algorithm to proposed NIDS for attack detection. NIDS employed GA to perform the feature selection procedure from the network traffic. GA succeed to select the most informative network features as it reduced the entire network traffic features from 45 to 10. Their results assured the necessary of the feature selection process in achieving better classification performance in terms of a high true positive and low false positive. In [12], Anwer and Farouk provided a framework of various filter and wrapper methodologies to optimise the NIDS. Their framework objective is the selection of the minimum features of network traffic which provided the highest classification accuracy. J48 and Naïve Bayes techniques are employed to build the classification model of NIDS. UNSW-NB15 intrusion dataset is utilized to assess each classifier performance under various feature selection strategies of the framework. Results stated that using J48 as a classifier with the filter-based gain ratio (GR) technique achieved the best performance. In [13], Dash and Chakravarty developed NIDS which can recognize both the normal and intrusive network connections. They faced the problem of high curse of dimensionality and solved it by adopting the principal component analysis (PCA) for selecting the most significant features of the input network traffic. They apply two different techniques of ANN, the MLP and the radial basis function (RBF) in the classification process. NSL-KDD dataset adopted to assess the used NIDS. Evaluation results proved that the optimal network feature subset obtained by PCA achieved a lower rate of false alarms and higher classification accuracy than using the whole network features.
-
III. Network Feature Selection Methodologies
This study aims to employ the strategies of the feature selection in building the NIDS and measures their impact on the intrusion detection process. Network features selection denoted by choosing the most informative features from the incoming network traffic which are sufficient to represent the nature of this traffic efficiently. As a result, leading the NIDS to achieve the best performance to classify this traffic behaviour [14]. Network feature selection process is shown in Fig. 2, where its stopping criteria are determined based on either the fitness function of the feature selection technique such as the classification accuracy, intrusion detection time or intrusion detection error rate, which evaluates the fitness/goodness of each possible features subset from all the network features, or on the generations number of the features subsets of the network feature space. Three strategies of the feature selection process are implemented in this study: the filter, wrapper and hybrid and each is discussed below.
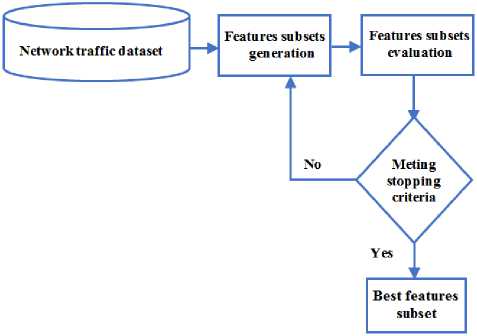
Fig.2. Network Feature Selection Process
-
A. Filter Methodologies
Filter approaches don’t use any learning algorithm to discard the needless features from the entire feature set. They asses the relevance of features by looking at the intrinsic data characteristics and its primary properties on the basis of particular statistical criterion determined by the used filter approach like distance measure, correlation measures, and consistency measures [15]. In this work, three popular filter approaches are used as follow.
-
1. Information gain (IG)
-
2. Principal Component Analysis (PCA)
-
3. Correlation Feature Selection (CFS)
IG measures the merit of a feature/attribute by computing its entropy value with respect to the class. Entropy is an information theory concept that measures the uncertainty of network data. According to this value, IG selects the most relevant features from the network data [16].
PCA identifies patterns of the data and expressing them to highlight their similarity and variations. The main advantage of the PCA is reducing the network traffic dimensionality without much loss of its information by calculating the principal component variances of the network features and discard the lesser variance [17].
CFS evaluates the merit of network feature subset depending on two concepts: the feature-classification correlation, and the feature-feature correlation. CFS determines the relevant feature subset which contains the highly correlated features with the class, yet uncorrelated with each other [18].
-
B. Wrapper Methodologies
Wrapper approaches mainly depend on a classification algorithm to select the subset with the most relevant features on the basis of specific evaluation criteria of the used classification model 15]. They are randomized population based searching methodologies. Their populations include many possible solutions (individuals) encoded as a binary vector in which if the feature bit is set to 1 is to be selected and to 0 is to be eliminated from the output subset. The classification accuracy of the SVM technique is adopted as the fitness function which evaluates each possible solution during the searching phase. Three popular wrapper approaches are implemented in this paper as follows.
-
1. Genetic algorithm (GA)
The motivation of the GA was on the basis of the natural selection concept of Darwin’s evolution theory “survival of the fittest” [19]. In the searching space of GA, its population composed of the number of chromosomes which are randomly initialized. Each chromosome represents a possible network feature subset. Using genetic operators like selection, crossover and mutation in generating the chromosomes for optimizing the results. All chromosomes in each generation will compete with each other and only the most successful ones are allowed to produce their offspring. Table 1. describes the pseudocode of the GA algorithm.
Table 1. The Pseudocode of GA Algorithm
Algorithm 1: Genetic Algorithm (GA)
Input: Training dataset (Binary encoded based network connection instances), N= number of individuals/chromosomes, M= number of generations/iterations, and D= chromosome dimensionality.
Output: Subset of the most informative network features
-
(1) Randomly initialize the binary population
-
(2) Set t = 1
-
(3) While ((t <= M) and (chromosome fitness value < 100)) do
-
(4) Calculate the fitness_value of the population individuals
-
(5) Memorize the best solution so far
-
(6) Selection of the best-fit chromosomes (Parents)
-
(7) Perform the cross over between these selected parents
-
(8) Perform the mutation of the obtained offspring
-
(9) Set t = t + 1
-
(10) End While
-
2. Artificial Bee Colony (ABC)
The Motivation of ABC was based on the nature bees demeanour during locating their food and their measuring mechanisms of its profitability like the nectar amount and its distance from the colony [9]. ABC contains three bees types: worker, onlookers and scout. Scout bees randomly carry out searching processes to locate new food sources. Employee bees explore these food locations and store information about its quality to share it with the onlooker bees which are waiting in the dance region for receiving such information about the located food positions. Then they make a suitable decision for selecting the highest quality food position. In the ABC searching space, its population composed of the number of food locations which are randomly found by the scout bees. Each food location represents a candidate network feature set. The pseudocode of the ABC algorithm is described in Table 2.
-
Table 2. The ABC Algorithm Pseudocode
Algorithm 2: Artificial Bee Colony (ABC)
Input: Training dataset (Binary encoded based network connection instances), N= number of food sources/employed bees, M= number of generations/iterations, D= Food source dimensionality, and Limit= Maximum limit value for a food source.
Output: Subset of the most informative network features
-
Table 3. The Pseudocode of PSO Algorithm
Algorithm 3: Particle Swarm Optimization (PSO)
Output: Subset of the most informative network features
-
(1) For particle i=0 to N do
-
(2) Randomly initialize the binary position X id
-
(3) Randomly initialize velocity V id
-
(4) End For
-
(5) S e 11 = 1
-
(6) While ((t <= M) and (particle fitness value < 100)) do
-
(7) For each particle i do
-
(8) Calculate particle fitness value
-
(9) If its fitness value > Pbest id
-
(10) Set Pbest id = fitness value
-
(11) End If
-
(12) End For
-
(13) Set Gbest = the best ever fitness value
-
(14) For particle i=0 to N do
-
(15) For feature d=0 to D do
-
(16) Vu t+1 = w Vu t + c^ (Pbsstt t - Xu ^ +
c2r2 ( Gb es 1 - Xtcl^
-
(17) Sigmoid (Vu t+1) = 1/(1 + exp (-1 * Vidt+^)
-
(18) Xidt+1 = 1 if the Sig mo id (Vid t+1) >
random value from [0:1], eIse = 0
-
(19) End For
-
(20) End For
-
(21) Se1 1 = 1 + 1
-
(22) End While
-
IV. Implementation and Experimental Results
-
A. Dataset Description
NSL-KDD is the used dataset for carrying out this experiment as it considered the most benchmark intrusion dataset utilized for assessing the anomaly-based NIDS [20]. Network connection instances of this dataset combined 41 attributes/features which are shown in Table 4. Each network connection record was labelled as normal or attack. The training set connection instances included 22 types of intrusions while the testing set instances combined extra varied 16 intrusions types. All these types of attacks fall under four classes as follows.
-
1. Denial of Service (DOS): Intruders attempt to exhaust the resources of the target network due to render its services unreachable by its legitimate users. This attack targets the availability.
-
2. Probe: Intruders try to scan the victim network and to collect details about its systems to carry out attacks on its services. This attack targets the confidentiality.
-
3. Remote to Local (R2L): Intruders attempt to get local access to a remote system by sending it packets in a trial of exploiting the target system vulnerabilities. This attack targets the integrity.
-
4. User to Root (U2R): Intruders attempt to gain the root privileges of the target system by accessing an authentic user account of this system then exploiting its vulnerabilities. This attack targets the integrity.
Table 4. NSL-KDD Network Intrusion Dataset Attributes
|
No. |
Feature Name |
Feature Description |
|
1 |
Duration |
Connection duration in seconds |
|
2 |
Protocol_type |
Type of the protocol used, e.g. TCP and UDP |
|
3 |
Service |
Network service on the destination, e.g. HTTP or telnet |
|
4 |
Flag |
Normal or error flag status of the connection |
|
5 |
Src_bytes |
Number of data bytes from source to destination |
|
6 |
Dst_bytes |
Number of data bytes from destination to source |
|
7 |
Land |
1 if the connection is from/ to the same host/port; 0 otherwise |
|
8 |
Wrong_fragment |
Number of “wrong” fragments |
|
9 |
Urgent |
Number of urgent packets |
|
10 |
Hot |
Number of “hot” indicators in the content such as: entering a system directory |
|
11 |
Num_failed_logins |
Number of failed login attempts |
|
12 |
Logged_in |
1 if successfully logged in; 0 otherwise |
|
13 |
Num_compromised |
Number of “compromised” conditions |
|
14 |
Root_shell |
1 if the root shell is obtained ; 0 otherwise |
|
15 |
Su_attempted |
1 if “su root” command attempted; 0 otherwise |
|
16 |
Num_root |
Number of “root” accesses |
|
17 |
Num_file_creations |
Number of file creation operations |
|
18 |
Num_shells |
Number of logins of normal users |
|
19 |
Num_access_files |
Number of operations on access control files |
|
20 |
Num_outband_cmds |
Number of outbound commands in FTP session |
|
21 |
İs_hot_login |
1 if the login belongs to the “hot” list i.e., root or admin; 0 otherwise |
|
22 |
Is_guest_login |
1 if the login is a “guest” login; 0 otherwise |
|
23 |
Count |
Number of connections to the same destination host in the past 2 seconds |
|
24 |
Srv_count |
Sum of connections to the same service in the past 2 seconds |
|
25 |
Serror_rate |
% of connections that have “SYN” errors among the connections aggregated in count (23) |
|
26 |
Srv_serror_rate |
% of connections that have “SYN” errors among the connections aggregated in srv_count (24) |
|
27 |
Rerror_rate |
% of connections that have “REJ” errors among the connections aggregated in |
|
count (23) |
||
|
28 |
Srv_rerror_rate |
% of connections that have “REJ” errors among the connections aggregated in srv_count (24) |
|
29 |
Same_srv_rate |
% of connections to the same service |
|
30 |
Diff_srv_rate |
% of connections to different services |
|
31 |
Srv_diff_host_rate |
% of connections to different hosts |
|
32 |
Dst_host_count |
Sum of connections to the same destination IP address |
|
33 |
Dst_host_srv_count |
Sum of connections to the same destination port number |
|
34 |
Dst_host_same_srv_rate |
% of connections that were to the same service, among the connections aggregated in dst_host_count |
|
35 |
Dst_host_diff_srv_rate |
% of connections that were to different services, among the connections aggregated in dst_host_count |
|
36 |
Dst_host_same_src_port_ra te |
% of connections that were to the same source port, among the connections aggregated in dst_host_srv_count |
|
37 |
Dst_host_srv_diff_host_rat e |
% of connections that were to different destination machines, among the connections aggregated in dst_host_srv_count |
|
38 |
Dst_host_serror_rate |
% of connections that have activated the flag s0, s1, s2 or s3, among the connections aggregated in dst_host_count |
|
39 |
Dst_host_srv_serror_rate |
% of connections that have activated the flag s0, s1, s2 or s3, among the connections aggregated in dst_host_srv_count |
|
40 |
Dst_host_rerror_rate |
% of connections that have activated the flag REJ, among the connections aggregated in dst_host_count |
|
41 |
Dst_host_srv_rerror_rate |
% of connections that have activated the flag REJ, among the connections aggregated in dst_host_srv_count |
|
42 |
Class label |
Connection behaviour label |
-
B. Experimental setup
Experiments are performed on a machine with CPU: Intel Core i7, Memory: 4 GB and OS: Microsoft Windows 10. The SVM classification model and the wrapper-based network feature selection techniques (PSO, GA and ABC) are implemented in Python language. Their number of individuals and generations were 30 and 40, respectively. The filter-based network feature selection techniques (IG, PCA and CFS) are applied by the WEKA data mining tool with their default values [34]. NSL-KDD dataset is used as the network traffic data source, 20% is selected for training the SVM detection model, while other 80% is used as the testing set for evaluating the detection model performance under the influence of applying the (wrapper, filter and hybrid) feature selection techniques. Network traffic connections behaviour is classified into normal or attack.
-
C. Performance Evaluation Metrics
The study of the NIDS performance under the influence of the aforementioned feature selection techniques is performed on many varied evaluation metrics which are computed on the basis of the following measures [7].
True Positive (TP) denoted by the positive/anomalous instances number which is correctly classified as attacks. True Negative (TN) denoted by the negative/benign instances number which is correctly classified as normal. False Positive (FP) denoted by the negative/benign instances number which is wrongly classified as an attack. False Negative (FN) denoted by the positive/anomalous instances number that is wrongly classified as normal.
The used evaluation metrics are:
TP + TN
-
1. Classification Accuracy =(5)
-
2. False Positive Rate (FPR) = FP(6)
-
3. False Negative Rate (FNR) = р™тр(7)
-
4. Sensitivity / True Positive Rate (TPR) = TP(8)
-
5. Specificity / True Negative Rate (TNR) = TN (9)
6. Precision =
TP
TP+FP
-
7. Recall / Attack Detection Rate (ADR) = TP (11) TP+FN
8. F-Measure =
2TP
2TP+FP+FN
-
9. Mean Absolute Error = — X t = i И c tu а 1t — Predicted 1 1 ,
TP + TN+FP + FN
FP+TN
Where n= number of network connection instances (13)
-
D. Results and Discussion
To evaluate the proposed work, three experiments are conducted to survey the influence of the aforementioned features selection approaches to optimise the SVM classification model performance and boost its efficiency.
For the first experiment, three popular wrapper techniques GA, ABC and PSO are employed in the features selection phase. Their objective was finding the key features from the input network traffic which can sufficiently represent the behaviour of that traffic for the NIDS detection model. The selected network features numbers by the three wrapper techniques GA, ABC and PSO were 30, 22 and 23, respectively as shown in table 5 whereas their impact results on the used detection model are shown in table 6. As the ABC is a faster convergence and has an exploration and exploitation ability than both of GA and PSO. Therefore, its network feature subset achieved higher classification accuracy and lower FPR and FNR for the detection model than them. Moreover, ABC scored the least time for recognizing the nature of network connections with the least value of mean absolute error which reflected the strength of ABC impact on reinforcing the efficiency of intrusion detection process. Although GA came next to ABC and outperformed PSO in achieving more slighter classification accuracy and attack detection rate. However, the PSO, as expected, scored lower attack detection time than GA because of the lower selected features number in favour of PSO.
For the second experiment, three common filter techniques CFS, IG and PCA are applied to determine the most relevant feature subset which is properly enough for the identification of the network traffic nature. As shown in table 5, the network features numbers obtained by the CFS, IG and PCA are 18, 20 and 20, respectively while their influence results on the used detection model are shown in table 6. As the PCA works on removing the correlated features of network traffic which don't contribute in the classification process. In addition, it retains most of the traffic behaviour information during the dimensionality reduction of network traffic. Therefore, it provided better performance than CFS and IG as it achieved higher classification accuracy, attack detection rate and F-measure. Furthermore, it gave lower detection time than them. CFS is the second best after the PCA and surpassed IG in achieving higher classification accuracy with lower detection time, FPR and FNR. Moreover, CFS scored better precision than them.
For the third experiment, the hybrid approach is performed as two scenarios: (wrapper-filter) and (filterwrapper). The first scenario denoted by applying a wrapper approach in selecting the most informative network features then refining the retained feature subset with a filter approach while the second scenario is the vice versa. Their obtained feature subsets are shown in table 5 and their evaluation results are shown in table 6. For the (wrapper-filter) scenario, nine hybrid approaches are applied in the most optimal network feature selection. GA-PCA outperformed these approaches through 22 network features as it yielded the highest classification accuracy, precision rate, recall rate and TPR. However, PSO-PCA scored the lowest detection time than them. On the other hand, the second hybrid approach scenario (filter-wrapper) is applied by different nine hybrid approaches. CFS-ABC was the best of them by only 10 network features as it achieved the highest classification accuracy, TPR, TNR, attack detection rate and precision. In addition, it also scored the lowest FPR, FNR, mean absolute error and detection time.
As a summary of the three experimental results analysis, it can be inferred the followings. Firstly, the whole network features of the network traffic didn’t contribute equally to the classification process, as some could contribute much, some could contribute less, and some could not contribute at all. Secondly, the success of any network feature selection technique depends on how much it reduced the network features dimensionality (selecting the most informative features from the whole network features) in parallel with how the classification performance is optimized as a result of that reduction/selection process. Table 5 details the number of most discriminating network features that are selected by each selection technique, while the performance of the NIDS classification model after applying each selection technique is shown in table 6. As the best network feature selection technique is the one who much reduced the irrelative network features number in parallel with yielding the better classification performance. Therefore, the applied wrapper approaches particularly the ABC clearly outstood all other filter and hybrid approaches in selecting the most optimal network features for the classification model of NIDS. Thirdly, only two-hybrid approaches (GA-PCA) and (CFS-ABC) are yielded remarkable classification results more than all filter approaches. However, the performance of other hybrid approaches was not totally efficient. Therefore, the hybrid feature selection approach must be precisely selected after many implementation trials for studying the effectiveness of the possible combinations of the wrapper and filter techniques.
Table 5. Summary of the Selected Network Features Obtained by Applying the Network Feature Selection Techniques
|
о Z s Ьч |
Wrapper Approaches |
Filter Approaches |
Hybrid Approaches (Wrapper-Filter) |
Hybrid Approaches (Filter-Wrapper) |
||||||||||||||||||||
|
СЛ 6 СЛ Рч |
О СЛ Рч |
Рч 6 СЛ Рч |
04 и ^ 0 |
0 0 |
0 04 ^ 0 |
и |
0 0 03 < |
< и 04 и 03 < |
Рч и |
0 04 0 |
Ьч и |
о Рч |
0 0 |
0 03 < 0 |
О !75 Рч Рч |
0 ^ и 04 |
и 03 < и 04 |
|||||||
|
О iZ) Рч |
0 |
и 03 < |
(Z) Ьч и |
0 |
|
|||||||||||||||||||
|
0 |
* |
* |
* |
* |
* |
* |
||||||||||||||||||
|
1 |
* |
* |
* |
* |
* |
* |
* |
* |
* |
* |
* |
* |
* |
|||||||||||
|
2 |
* |
* |
* |
* |
* |
* |
* |
* |
* |
* |
* |
* |
* |
* |
* |
* |
* |
* |
||||||
|
3 |
* |
* |
* |
* |
* |
* |
* |
* |
* |
* |
* |
* |
* |
* |
* |
* |
* |
* |
||||||
|
4 |
* |
* |
* |
* |
* |
* |
* |
* |
* |
|||||||||||||||
|
5 |
* |
* |
* |
* |
* |
* |
* |
|||||||||||||||||
|
6 |
* |
* |
* |
* |
* |
* |
* |
* |
||||||||||||||||
|
7 |
* |
* |
* |
* |
* |
* |
* |
|||||||||||||||||
|
8 |
* |
* |
* |
* |
* |
* |
* |
* |
||||||||||||||||
|
9 |
* |
* |
* |
* |
* |
* |
* |
* |
* |
* |
||||||||||||||
|
10 |
* |
* |
* |
* |
* |
* |
* |
|||||||||||||||||
|
11 |
* |
* |
* |
* |
* |
* |
* |
* |
* |
* |
* |
* |
||||||||||||
|
12 |
* |
* |
* |
* |
* |
* |
||||||||||||||||||
|
13 |
* |
* |
* |
|||||||||||||||||||||
|
14 |
* |
* |
* |
* |
* |
* |
* |
|||||||||||||||||
|
15 |
* |
* |
* |
* |
* |
* |
* |
* |
||||||||||||||||
|
16 |
* |
* |
* |
* |
* |
* |
* |
|||||||||||||||||
|
17 |
* |
* |
* |
* |
* |
* |
* |
* |
||||||||||||||||
|
18 |
* |
* |
* |
* |
* |
* |
||||||||||||||||||
|
19 |
* |
* |
* |
* |
* |
* |
* |
|||||||||||||||||
|
20 |
* |
* |
* |
* |
* |
|||||||||||||||||||
|
21 |
* |
* |
* |
* |
* |
|||||||||||||||||||
|
22 |
* |
* |
* |
* |
* |
* |
* |
* |
* |
* |
* |
* |
* |
* |
* |
* |
||||||||
|
23 |
* |
* |
* |
* |
||||||||||||||||||||
|
24 |
* |
* |
* |
* |
* |
* |
* |
* |
* |
|||||||||||||||
|
25 |
* |
* |
* |
* |
* |
* |
* |
* |
* |
* |
* |
* |
* |
|||||||||||
|
26 |
* |
* |
* |
* |
* |
* |
||||||||||||||||||
|
27 |
* |
* |
* |
* |
* |
* |
* |
* |
* |
* |
* |
|||||||||||||
|
28 |
* |
* |
* |
* |
* |
* |
* |
* |
* |
* |
* |
* |
* |
|||||||||||
|
29 |
* |
* |
* |
* |
* |
* |
* |
* |
* |
|||||||||||||||
|
30 |
* |
* |
* |
* |
* |
* |
* |
* |
* |
* |
||||||||||||||
|
31 |
* |
* |
* |
* |
* |
* |
* |
* |
* |
* |
||||||||||||||
|
32 |
* |
* |
* |
* |
* |
* |
* |
* |
* |
* |
* |
* |
* |
|||||||||||
|
33 |
* |
* |
* |
* |
* |
* |
* |
* |
* |
* |
||||||||||||||
|
34 |
* |
* |
* |
* |
* |
* |
* |
* |
* |
* |
* |
|||||||||||||
|
35 |
* |
* |
* |
* |
* |
* |
||||||||||||||||||
|
36 |
* |
* |
* |
* |
* |
|||||||||||||||||||
|
37 |
* |
* |
* |
* |
* |
* |
* |
* |
* |
* |
||||||||||||||
|
38 |
* |
* |
* |
* |
* |
* |
* |
|||||||||||||||||
|
39 |
* |
* |
* |
* |
* |
* |
* |
|||||||||||||||||
|
40 |
* |
* |
* |
* |
* |
* |
* |
* |
||||||||||||||||
|
Total |
23 |
30 |
22 |
18 |
20 |
20 |
9 |
13 |
13 |
9 |
22 |
22 |
9 |
12 |
12 |
11 |
13 |
10 |
11 |
15 |
10 |
12 |
14 |
13 |
Table 6. NIDS Classification Performance After Applying the Network Feature Selection Techniques
|
Network Feature Selection Technique |
NIDS Performance Evaluation Metrics |
||||||||||||
|
"S s . to Z |
5& |
FPR |
FNR |
TPR |
TNR |
Precision (%) |
ADR (%) |
s 1^ to |
Mean Absolute Error |
Training Time (sec) |
Detection Time (sec) |
||
|
с. & |
PSO |
23 |
97.75 |
0.014 |
0.030 |
0.969 |
0.985 |
98.37 |
96.94 |
97.65 |
0.022 |
5.34 |
11.85 |
|
GA |
30 |
97.87 |
0.015 |
0.027 |
0.972 |
0.984 |
98.29 |
97.27 |
97.78 |
0.021 |
6.11 |
13.91 |
|
|
ABC |
22 |
98.04 |
0.014 |
0.024 |
0.975 |
0.985 |
98.37 |
97.55 |
97.96 |
0.019 |
5.16 |
10.18 |
|
|
to |
CFS |
18 |
95.76 |
0.015 |
0.071 |
0.928 |
0.984 |
98.23 |
92.87 |
95.48 |
0.042 |
7.63 |
15.09 |
|
IG |
20 |
92.64 |
0.068 |
0.078 |
0.921 |
0.931 |
92.54 |
92.14 |
92.34 |
0.073 |
13.35 |
20.40 |
|
|
PCA |
20 |
96.20 |
0.020 |
0.056 |
0.943 |
0.979 |
97.73 |
94.30 |
95.98 |
0.037 |
5.85 |
13.31 |
|
|
to Q. i я |
PSO-CFS |
9 |
90.59 |
0.072 |
0.117 |
0.882 |
0.927 |
91.84 |
88.29 |
90.03 |
0.094 |
9.49 |
19.67 |
|
PSO-IG |
13 |
90.31 |
0.072 |
0.123 |
0.876 |
0.927 |
91.82 |
87.68 |
89.70 |
0.096 |
12.38 |
25.76 |
|
|
PSO-PCA |
13 |
95.93 |
0.014 |
0.069 |
0.930 |
0.985 |
98.38 |
93.08 |
95.65 |
0.040 |
4.88 |
10.41 |
|
|
GA-CFS |
9 |
92.16 |
0.051 |
0.106 |
0.893 |
0.948 |
94.09 |
89.31 |
91.64 |
0.078 |
8.41 |
17.23 |
|
|
GA-IG |
22 |
94.19 |
0.029 |
0.088 |
0.911 |
0.970 |
96.61 |
91.12 |
93.79 |
0.058 |
10.99 |
19.08 |
|
|
GA-PCA |
22 |
97.67 |
0.020 |
0.025 |
0.974 |
0.979 |
97.75 |
97.40 |
97.58 |
0.023 |
5.47 |
12.30 |
|
|
ABC-CFS |
9 |
86.68 |
0.068 |
0.202 |
0.797 |
0.931 |
91.51 |
79.71 |
85.21 |
0.133 |
17.29 |
27.42 |
|
|
ABC-IG |
12 |
73.36 |
0.221 |
0.314 |
0.685 |
0.778 |
74.16 |
68.54 |
71.24 |
0.266 |
44.23 |
70.66 |
|
|
ABC-PCA |
12 |
94.65 |
0.014 |
0.095 |
0.904 |
0.985 |
98.28 |
90.46 |
94.21 |
0.053 |
6.69 |
13.34 |
|
|
Q. я |
CFS-PSO |
11 |
95.92 |
0.015 |
0.068 |
0.931 |
0.984 |
98.27 |
93.16 |
95.65 |
0.040 |
5.90 |
12.19 |
|
CFS-GA |
13 |
95.87 |
0.015 |
0.069 |
0.930 |
0.984 |
98.24 |
93.08 |
95.59 |
0.041 |
5.63 |
12.31 |
|
|
CFS-ABC |
10 |
96.12 |
0.014 |
0.064 |
0.935 |
0.985 |
98.32 |
93.54 |
95.87 |
0.038 |
5.06 |
11.31 |
|
|
IG-PSO |
11 |
81.39 |
0.047 |
0.335 |
0.664 |
0.952 |
92.86 |
66.44 |
77.46 |
0.186 |
31.11 |
43.54 |
|
|
IG-GA |
15 |
90.91 |
0.084 |
0.097 |
0.902 |
0.915 |
90.79 |
90.28 |
90.53 |
0.090 |
12.53 |
23.05 |
|
|
IG-ABC |
10 |
91.23 |
0.086 |
0.088 |
0.911 |
0.913 |
90.68 |
91.14 |
90.91 |
0.087 |
9.90 |
18 |
|
|
PCA-PSO |
12 |
92.91 |
0.035 |
0.108 |
0.891 |
0.964 |
95.88 |
89.11 |
92.37 |
0.070 |
7.85 |
15.29 |
|
|
PCA-GA |
14 |
95.34 |
0.026 |
0.068 |
0.931 |
0.973 |
97.01 |
93.18 |
95.06 |
0.046 |
5.56 |
12.38 |
|
|
PCA-ABC |
13 |
94.9 |
0.022 |
0.082 |
0.917 |
0.977 |
97.45 |
91.79 |
94.54 |
0.051 |
5.97 |
12.10 |
|
Table 7. NIDS Performance Evaluation with and without Applying the Feature Selection Process
|
Input Network Features |
No. of Selected Features |
NIDS Performance Evaluation Metrics |
||||||||||
|
FPR |
FNR |
TPR |
TNR |
Precision (%) |
ADR (%) |
5 |
Mean Absolute Error |
Training Time (sec) |
Detection Time (sec) |
|||
|
All Network Features |
41 |
97.44 |
0.015 |
0.036 |
0.963 |
0.984 |
98.31 |
96.35 |
97.32 |
0.025 |
12.69 |
26.8 |
|
Selected Network features by ABC |
22 |
98.04 |
0.014 |
0.024 |
0.975 |
0.985 |
98.37 |
97.55 |
97.96 |
0.019 |
5.16 |
10.18 |
Table 8. Performance Comparison between the Proposed ABC-NIDS and other related NIDSs
|
Metrics |
Network Intrusion Detection Systems |
|||||||||||||
|
Proposed |
[21] |
[22] |
[23] |
[24] |
[25] |
[26] |
[27] |
[28] |
[29] |
[30] |
[31] |
[32] |
[33] |
|
|
Network Features Selection Technique |
ABC |
В '1 § & 8 5 |
Gain Ratio |
1 .i М ио |
й -3 3-И Q |
Q |
ABC |
Fisher Score |
и |
IG |
б 6 Щ |
IG |
ChiSquare |
PSO |
|
Selected Features Number |
22 |
16 |
35 |
32 |
4 |
5 |
7 |
19 |
17 |
25 |
35 |
15 |
22 |
23 |
|
Accuracy (%) |
98.04 |
88.73 |
84.25 |
85.05 |
83.24 |
90.4 |
97.1 |
93.95 |
94.02 |
76.54 |
97 |
- |
- |
- |
|
TPR (%) |
97.5 |
89 |
- |
- |
- |
- |
- |
- |
- |
- |
- |
- |
- |
- |
|
TNR (%) |
98.5 |
99.07 |
97.21 |
- |
- |
- |
- |
- |
- |
97.21 |
- |
- |
- |
- |
|
FPR (%) |
1.4 |
0.93 |
2.79 |
12.2 |
4.83 |
- |
4.5 |
10.34 |
- |
2.79 |
0.83 |
2 |
2.46 |
4.01 |
|
ADR (%) |
97.55 |
- |
- |
- |
- |
95.3 |
93.9 |
95.5 |
- |
- |
97.14 |
97.7 |
97.78 |
94.03 |
|
F-Measure |
97.96 |
- |
- |
- |
- |
91.8 |
- |
- |
- |
- |
- |
- |
- |
- |
Regarding evaluation the classification performance of NIDS after and without applying feature selection process on the input network traffic data of the NSL-KDD dataset, results of table 7 proved that building the detection model of NIDS on the whole 41 network features considered non-professional technical procedure. As that not only minimizes the TPR, TNR, attack detection rate, and classification accuracy but also maximizes the FPR, FNR, the underlying complexity of the network traffic data processing, and the detection time. Regarding the comparison between the classification performance of our ABC-NIDS and other related NIDSs on the same NSL-KDD testing dataset, evaluation results of table 8 stated that our ABC-NIDS achieved the best classification performance.
Finally, this study assured the necessity of the network feature selection phase for boosting the NIDS effectiveness and optimizing its overall performance.
-
V. Conclusion
Provision the network security by the NIDS is considered critical for any computer network. Selection of the most informative features of network traffic data plays a crucial role in avoiding the overfitting problem and reducing processing computation costs. Therefore, optimizing the NIDS performance and achieving acceptable classification results. In this paper, several feature selection techniques were implemented to discard irrelevant and uninformative features from the network traffic before its classification. SVM detection model is trained and assessed using the benchmark NSL-KDD dataset. Evaluation results clearly demonstrated the superiority of the wrapper approaches over both the filter and hybrid approaches in boosting the NIDS overall performance. Furthermore, a comparison with other NIDS is carried out and our ABC-NIDS outperformed these systems. Adopting other metaheuristic techniques for selecting important network features, employing the deep learning techniques for building the intrusion detection model, and testing the NIDS on real network traffic are our future interests.
References An efficiency optimization for network intrusion detection system
- Statista. IoT - number of connected devices worldwide 2015-2025. https://www.statista.com/statistics/471264/iot-number-of-connected-devices-worldwide/. Accessed: 01-05-2019.
- N. Kaja, Adnan Shaout and Di Ma, “An intelligent intrusion detection system,” Applied Intelligence, pp. 1-13, 2019.
- C. Modi, D. Patel, B. Borisaniya, H. Patel, A. Patel and M. Radaradan, “A Survey of Intrusion Detection Techniques in Cloud,” Journal of Network and Computer Applications, vol. 36, No.1, pp. 42–57, 2013.
- G. Fernandes, L. Fernando, J.F. Al-Muhadi and M. Lemes, “A comprehensive survey on network anomaly detection,” Telecommunication Systems, vol.70, no.3, pp. 447-489, 2019.
- Prachi, H. Malhotra and P. Sharma, “Intrusion Detection using Machine Learning and Feature Selection,” International Journal of Computer Network and Information security, vol.11, no.4, pp.43-52, 2019.
- M. Awad and R. Khanna, “Support Vector Machines for Classification Efficient Learning Machines,” Apress, Berkeley, California, pp. 39-66, 2015.
- Mahmoud M. Sakr, Medhat A. Tawfeeq and Ashraf B. El-Sisi, “Network Intrusion Detection System based PSO-SVM for Cloud Computing,” International Journal of Computer Network and Information Security, vol.11, no.3, pp.22-29, 2019.
- B. Hajimirzaei and N.J. Navimipour, “Intrusion detection for cloud computing using neural networks and artificial bee colony optimization algorithm,” ICT Express, vol.5, no.1, pp. 56-59, 2019.
- T. Khorram and N.A. Baykan, “Feature selection in network intrusion detection using metaheuristic algorithms,” International Journal of Advanced Research, Ideas and Innovations in Technology, vol.4, no.4, 2018.
- J. Jabez, S. Gowri, S. Vigneshwari, J.A. Mayan and S. Srinivasulu, “Anomaly Detection by Using CFS Subset and Neural Network with WEKA Tools,” Proceedings of ICTIS, vol. 2, pp. 675-682, 2018.
- B.M. Aslahi-Shahri, R. Rahmani, M. Chizari, A. Maralani, M. Eslami, M. Golkar and A. Ebrahimi, “A hybrid method consisting of GA and SVM for intrusion detection system,” Neural computing and applications, vol. 27, no. 6, pp. 1669-1676, 2019.
- H.M. Anwer, Mohamed Farouk and Ayman Abdel-Hamid, “A framework for efficient network anomaly intrusion detection with features selection,” In 9th IEEE International Conference on Information and Communication Systems, pp. 157-162, 2019.
- Nitu Dash, Sujata Chakravarty and Amiya Kumar Ratha, Intrusion Detection System Based on Principal Component Analysis and Machine Learning Techniques. International Journal of Engineering Development and Research (IJEDR) 2018. Vol.6, No.3.
- Jie Ling and Chengzhi Wu, “Feature Selection and Deep Learning-based Approach for Network Intrusion Detection,” In the 3rd International Conference on Mechatronics Engineering and Information Technology, 2019.
- Sofiane Maza and Mohamed Touahria, “Feature Selection Algorithms in Intrusion Detection System: A Survey,” KSII Transactions on Internet and Information Systems, vol.12, no.10, pp.5079-5099, 2018.
- B. Senthilnayaki, K. Venkatalakshmi and K. Arputharaj, “Intrusion Detection System Using Feature Selection and Classification Technique,” In International Journal of Computer Science and Application, vol.3, no.4, pp.145, 2014.
- K. Keerthi Vasan and B. Surendiran, “Dimensionality reduction using Principal Component Analysis for network intrusion detection,” Perspectives in Science, vol.8, pp. 510-512, 2016.
- M.A. Hall and L.A. Smith, “Feature selection for machine learning: Comparing a correlation-based filter approach to the wrapper,” In the 12th international FLAIRS Conference, vol. 1999, pp. 235-239, 1999.
- K. Sanjay Desale and Roshani Ade, “Genetic algorithm based feature selection approach for effective intrusion detection system,” In IEEE International Conference on Computer Communication and Informatics, pp 1-6, 2015.
- L. Dhanabal and S.P. Shantharadah, “A study on NSLKDD dataset for intrusion detection system based on classification algorithms,” International Journal of Advanced Research in Computer and Communication Engineering, vol.4, no.6, pp. 446–452, 2015.
- E. Popoola and A. Adewumi, “Efficient Feature Selection Technique for Network Intrusion Detection System Using Discrete Differential Evolution and Decision,” International Journal of Network Security, vol.19, no.5, pp. 660-669, 2017.
- T. Pham, E. Foo, S. Suriadi and H. Jeffrey, “Improving performance of intrusion detection system using ensemble methods and feature selection,” Australasian Computer Science Week Multi-Conference, ACM, pp.1-6, 2018.
- N.K. Kanakarajan and K. Muniasamy, “Improving the accuracy of intrusion detection using gar-forest with feature selection,” Advances in Intelligent Systems and Computing, vol.404, pp. 539-547, 2016.
- H.H. Pajouh, G.H. Dastghaibyfard, and S. Hashemi, Two-tier network anomaly detection model: a machine learning approach. Journal of Intelligent Information Systems, 2017. Vol.48, No.1, pp. 61–74.
- D. Kwon, H. Kim, J. Kim, S. C. Suh, I. Kim and K. J. Kim, A survey of deep learning-based network anomaly detection. Cluster Computing, 2017. Vol. 4, No. 3, pp. 1-13.
- T. Khorram and N.A. Baykan, Feature selection in network intrusion detection using metaheuristic algorithms. International Journal of Advanced Research, Ideas and Innovations in Technology, 2016. Vol.4, No.4, pp.704-710.
- P. Kar, S. Banerjee, K.C. Mondal, G. Mahapatra and S. Chattopadhyay, A Hybrid Intrusion Detection System for Hierarchical Filtration of Anomalies. Information and Communication Technology for Intelligent Systems, Springer, Singapore, 2019. pp.417-426.
- Kazi Abu Taher, B.MY. Jisan and Md. M Rahman, Network Intrusion Detection using Supervised Machine Learning Technique with Feature Selection. In IEEE International Conference on Robotics, Electrical and Signal Processing Techniques (ICREST), pp.643-646, 2019.
- Partha Ghosh, A.K. Mandal and Rupesh Kumar, An Efficient Cloud Network Intrusion Detection System.Information Systems Design and Intelligent Applications, Advances in Intelligent Systems and Computing, Springer, 2015. vol. 339, pp. 91-99.
- M.G. Raman, N. Somu, K. Kirthivasan, R. Liscano, V.S. Sriram, An efficient intrusion detection system based on hypergraph - genetic algorithm for parameter optimization and feature selection in support vector machine, Knowlege. Based System. Vol.134 (2017) pp. 1–12.
- X.Zhang, J.Tian, P.Zhu and J.Zhang, An Effective Semi-Supervised Model for Intrusion Detection Using Feature Selection Based LapSVM, In IEEE International Conference on Computer, Information and Telecommunication Systems (CITS), pp. 283-286, 2017.
- I.S. Thaseen and Ch.A. Kumar, Intrusion Detection Model Using Chi Square Feature Selection and Modified Naïve Bayes Classifier, In Proceedings of the 3rd International Symposium on Big Data and Cloud Computing Challenges (ISBCC--16’), pp. 81-91, 2016.
- Adriana-Cristina Enache1, V. Sgarciu and A. Petrescu-Ni¸ta, Intelligent Feature Selection Method rooted in Binary Bat Algorithm for Intrusion Detection, In IEEE 10th Jubilee International Symposium on Applied Computational Intelligence and Informatics, pp. 517-521, 2015.
- Ingrid Russell and Zdravko Markov, “An introduction to the Weka data mining system,” In Proceedings of the 11th annual SIGCSE conference on Innovation and technology in computer science education, vol.38, no.3, pp. 367-368, 2006.
