An Efficient Characterization of Gait for Human Identification

Author: Mridul Ghosh, Debotosh Bhattacharjee
Journal: International Journal of Image, Graphics and Signal Processing(IJIGSP) @ijigsp
Article in issue: 7 vol.6, 2014.
Free access
In this work, a simple characterization of human gait, which can be used for surveillance purpose, is presented. Different measures, like leg rise from ground (LRFG), the angles created between the legs with the centroid (ABLC), the distances between the control points and centroid (DBCC) have been taken as different features. In this method, the corner points from the edge of the object in the image have been considered. Out of several corner points thus extracted, a set of eleven significant points, termed as control points, that effectively and rightly characterize the gait pattern, have been selected. The boundary of the object has been considered and using control points on the boundary the centroid of those has been found out. Statistical approach has been used for recognition of individuals based on the n feature vectors, each of size 23(collected from LRFG, ABLCs, and DBCCs) for each video frame, where n is the number of video frames in each gait cycles. It has been found that recognition result of our approach is encouraging with compared to other recent methods.
Gait Recognition, corner points, centroid, LRFG, ABLC, DBCC, Mahalanobis Distance
Short address: https://sciup.org/15013320
IDR: 15013320
Text of the scientific article An Efficient Characterization of Gait for Human Identification
Published Online June 2014 in MECS DOI: 10.5815/ijigsp.2014.07.03
Physical biometric traits like face, fingerprint and iris are typically used in applications to identify human beings. Recent research has demonstrated the possible ancillary information such as gender, height, weight, age and ethnicity to improve the recognition accuracy of biometric systems.
Gait is the systematic study of human walking styles and in due course of time it has drawn lots of attention of people. For example, Borelli [1], an Italian Scientist, in 17th Century, who was very much interested in biomechanics, to be more precise in animal movement (locomotion). Another person, who did a tremendous work on biomechanics using lithographic cross section of human body, was Braune [2] in the year of 1890.
A person at some distance without his/her knowledge that he/she is in observation can be identified through gait recognition [3] [4] [5].
Gait plays a very important role in identifying a person with object (bag, suitcase or rucksack etc.) or without object. Human brain is continuously analyzing motion in some or other sense. Human gait shows distinct motion of person and also the walker’s physical and psychological status. Research on gait can be expressed on medical perspective. One very good example is the work done by Murray [6] who used gait to classify the pathologically abnormal patients into different group for appropriate treatment.
Human gait recognition is developing tremendously in terms of computer vision research because of its potential for human identification. It is difficult to identify human age or gender from a single picture taken from a distance but gait has made it possible by taking a person’s image in different sequences [7].
Gait research has appearance based model [8], which utilizes either the entire image part [9] or just some important parts [10] [11].
To understand human behaviors from image sequence, visual analysis of human motion [12] [13] has also played an important role. By this analysis the detection, tracking and identification of any object has become possible. Through biometric technology the physiological or behavioral characteristics to identify people [14] is possible. Over the past few years, the combination of biometrics and human motion has become a popular research. From the computer vision community the vision based human identification at a distance has gained wider interest. This interest is strongly driven to the need for automated person identification system for visual surveillance and monitoring application for security purpose such as banks, parking lots, airports and railway station etc.
In this work, it has been attempted to develop a simple and effective method for gait-based human identification using Silhouette analysis.
Angles and Distances between the Centroid and the Control points i.e. ABLC and DBCC have been calculated.
Another unique measure is Leg Rise from Ground (LRFG) has been considered.
Mahalanobis distance Statistic has been used for recognition of individuals with the stored features.
Section II describes feature extraction technique, experiments conducted for this work along with results are described in section III and section IV concludes this work.
-
II. Feature extraction
Feature extraction is an important and significant part to any kind of recognition issue. It is known that gait cycle of a person is a periodic activity and covering two types of footsteps: the left foot forward and the right foot forward. Each step spans the double-support posture to the leg-together and leg away posture and back to the double-support posture.
Before approaching the feature extraction stage, it is needed to collect the video sequences of different persons and from the video sequences the images of every moment of walk is taken in such a way that the entire gait movement cycle can be realized and then these images can be converted into binarized form to simplify our work. The process of binarization has been described in the object extraction part.
-
A. Object extraction :
To extract any object, which is the subject of concern of work, from an entire snap shot or from video sequence (shot taken of the moments in such a way that the gait signature is fully characterized), the first assumption made here is that the object is moving and camera is static.
The first and foremost thing is to subtract the background from the shot so that the images of individuals can be extracted and processed in subsequent steps.
In order to extract and track moving silhouettes from the background in each image-frame the detection and tracking algorithm is used which is based on background subtraction and silhouette correlation.
When a fixed camera is used to observe dynamic scenes and to detect fore-ground object, background subtraction is of primary concern. To generate background image from a small portion of image sequence, LMedS (Least Median of Square) [15] method is used.
Siegel's estimator [15] for LMedS is defined as follows:
For any p observations (xi1 , yi1 ), …., (x p ,y p ) which determine a unique parameter vector, the jth coordinate of this vector is denoted by j 1,......., p . The repeated median is then defined coordinatewise as
med med med
-
θ j = i 1 (…..( ip - 1 ( ip θ j(i 1 ,..,ip)))…) (1)
Let I represent a sequence including N images. The background β(x,y) can be computed as given in [15], by
β(x,y)= min { med f (If(x,y)–b)2} (2)
b
Where, b=background brightness value at pixel location (x,y).
med= median value f=frame index from 1 to N
The brightness of the entire sequence of gait cycle may not be same throughout, it may vary on time, and the brightness can be obtained through differencing between the background and the current image. It is difficult to select suitable threshold for binarization, especially in case of low contrast image as the brightness change is too low to distinguish between object from noise [16]. In order to solve this problem the following function has been used to perform differencing [16] indirectly.
-
m ( α β ) = 1 - J ( α ( x , y ) + 1)( β ( x , y ) + 1) 2 J ( η - α ( x , y ))( η - β ( x , y )) m ( α , β ) = 1 - .
( α ( x , y ) + 1) + ( β ( x , y ) + 1) ( η - α ( x , y )) + ( η - β ( x , y ))
Where, α (x,y) is the brightness of current image at pixel position (x,y), β (x,y) is the background at pixel position (x,y) of current image, η is the maximum intensity value i.e. for gray scale it is 255, 0<= α (x,y), β (x,y)<= η and 0<= m ( α , β )<1.
It is important to remove as much noise as possible from the image. In order to fill small holes inside the extracted silhouette, operations such as erosion and dilation are used. The images in the gait sequence obtained after background subtraction are used in feature extraction and matching.
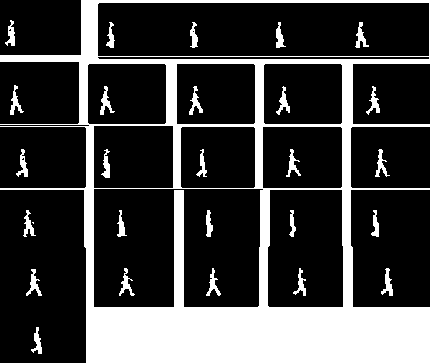
Fig 1: The sample silhouette image database
-
B. Edge detection and Corner Detection
Edge of the object is detected before detecting the corner to find approximate contour of gait images. One of the fundamental tool in image processing is edge detection, it is also used in feature extraction, which aims at identifying points at which in digital image brightness change sharply or has discontinuities. Basically edge detection significantly reduces the amount of data and filters out useless information, while saving important structural properties of the image. In order to filter the image, Sobel operator [17] has been used to detect edge of an object in an image.
After detecting the edge of the silhouette, the corner points on the edge is found out. A silhouette is the image of a person, an object or scene represented as a solid shape of a single colour, usually black or white, its edges matching the outline of the subject. The interior of a silhouette is featureless, and the whole is typically presented on a background, usually white or black or none at all.
The silhouette differs from an outline which depicts the edge of an object in a linear form, while a silhouette appears as a solid shape.
Corner point is the intersection of two edges. The point for which there are two dominant and different edge directions in a local neighborhood of the point is also known as corner point. It is important to do local analysis of detected points in order to detect only corners.
There are many methods for corner detection e.g. Minimum Eigenvalue Method [18], Moravec corner detection algorithm [19], Harris and Stephen corner detection [20] etc.
Minimum Eigenvalue Method is more computationally expensive than Harris corner detection and since Harris and Stephen have improved upon Moravec’s corner detector by considering the differential of the corner score with respect to direction only rather than using shifted patches, so here Harris and Stephen corner detection method has been used to detect the corner of the edge of silhouette.
Consider taking an image patch over the area ( u, v ) and shifting it by ( x, y ) on an image I, the weighted sum of squared differences (SSD) between these two patches, denoted by P, is given [20]:
P(x,y) =∑ ∑ w(u,v) [I(u+x,v+y) – I(u,v)]2 u v
The equation (4) can be written in matrix form:
P(x,y) = (x y)T I * I , Where T is the structure tensor.
I y )
T=
I x 2 I x I y
I x I y I y 2
This matrix is a Harris matrix, and angle brackets denote averaging i.e. summation over (u, v). By large variation of P, corners can be characterized.
-
C. Boundary and Centroid Detection
A normalized point is needed that will be significant point in terms of the boundary points of that object, call it centroid of that object. In order to find the centroid of the body or the silhouettes here, the boundary points are to be found out first. Now, to have the centroid of an object in the image, it is needed to find the total number of boundary points extracted (say the set Z), and then make the sum of boundary points along x and y axis and divide it by total number of boundary points i.e.
Centroid (C) = Σ Boundary points/ Z (6)
-
D. Control points selection.
Selection of control points is very important and imperative in our work, since these points signify the gait characteristics of an object to be extracted. The corner points so generated by Harris and Stephen’s corner detection technique, is in a sequence i.e. the first point generated is the bottom most point of left leg and the last point is bottom most point of right leg and vice versa i.e. lowest x co-ordinate value to highest x coordinate value.
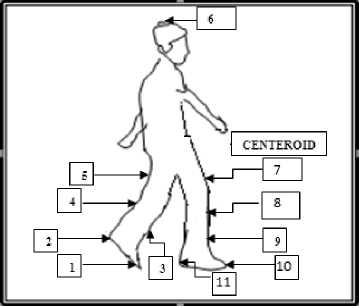
Fig 2: Corner point Selection
Care must be taken while selecting control points, because, it will be dealt with only those corner points that will be very significant in terms of posture of movement and gait signature of a person can be rightly extracted for different movement of work for different person and considered those corner points that will have effect on the measures like ABLC, DBCC, LRFG from person to person in gait sequences and also on very significant (in term of movements) places of the body. Concentration has been put on more on the leg movements than upper portion of the body and thus only one point from the corner points have been considered from the head and five points from as the points of one leg and the last five points from another leg, as the control points. After that the head point is selected by finding the minimum y coordinate point, as the minimum y co-ordinate is the top most point present on head, and the corresponding x coordinate is found in order to get the point on head. The control point so selected is shown in the figure 1.
-
E. Leg Rise from Ground (LRFG)
From the silhouette images the control points have been extracted, so to get more information about the images in the sequences in feature extraction, the measure, LRFG has to be determined. The lowest point of the images is marked as the ground level. To find the lowest point in the image it is needed to determine the maximum y co-ordinate from the corner points extracted. Now, using the index of corner points, the corresponding x coordinate is determined. So now, it has the co-ordinate of lowest point of the object in the image. The vertical positions of knee (K) are then estimated as a fraction of the body height H following anatomical studies in [21] 0.285H. The height is calculated by the Euclidean distance between head point and the perpendicular point B (shown in Fig.3). The algorithm for finding the leg rise is given below:
Algorithm1: Calculation of LRFG measure.
Input: Set of corner points.
Output: Maximum normalized leg rise distance from horizontal line.
Step1. Store the coordinates of the corner points (as discussed in section II B) in the vectors x and y.
Step2. Using the corner points find the maximum y coordinate and the corresponding x co-ordinate.
Y max =max(y) (7)
Where “max” denotes maximum value.
Step3. A horizontal line is drawn with the Co-ordinate found in step 2 and with corresponding x coordinate from vector x.
Step4. Minimum x Co-ordinate has been found out by
X min =min(x) (8)
Where “min” denotes minimum value.
The corresponding y coordinate has been taken from y vector and this point denotes the heel point (A).
Step5. Drop a line from A to C (C is the point considered by maximum y coordinate and minimum x coordinate from x and y vector respectively). The distance from the heel point A to the perpendicular point C is denoted by PER.
Step6. The x coordinate has been determined from the minimum y coordinate and that point denotes the head point. Draw a perpendicular line from head point to the horizontal line point B.
Find the distance from the point A to point B, denoted by AB.
Step7. Check whether the distances AB and AC are less than the distance between knee point (k) to Horizontal line, if so, it will be treated as a valid LRFG distance.
Step8. Find the normalized leg rise (LRFG) by finding the ratio of (PER: AB).
Step9. The maximum normalized leg rise distance among all the stances in a sequence will be taken into the dataset.
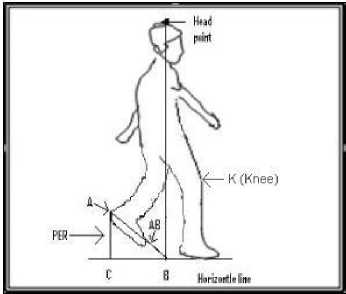
Fig 3: Leg Rise From Ground (LRFG).
-
F. Distance between Control points to (DBCC):
From the silhouette images the boundary of the object in the images has been found out. Then the centroid of the object by the procedure described in II C has been calculated. Eleven control points have been found out for each and every silhouette images by procedure described in II D. Now, the Euclidean distances from the centroid to the control points of the objects are measured. The control points and the centroid are selected is shown by the figure below:
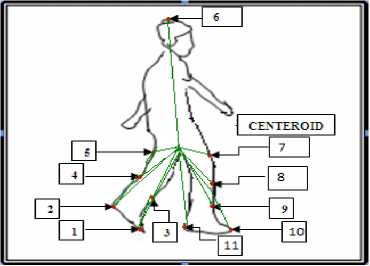
Fig 4: Centroid to control points distance
-
G. Angles created between the legs with the Centroid (ABLC):
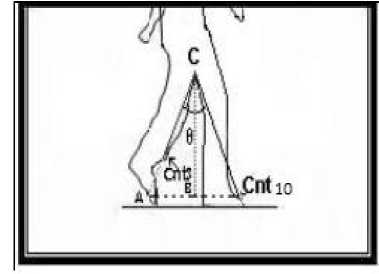
Fig 5: Centroid to Control points angle
To find out the angles between the control points with the centroid, a control point has chosen, say Cnt10 in figure.5, which has maximum y coordinate value and a straight line is drawn from centroid C to a point say A(x, y) via the 2nd control point say Cnt 3 in such a way that both the A and B have same y coordinate. The calculation of angles, given in figure.5 is illustrated with the help of figure.6.
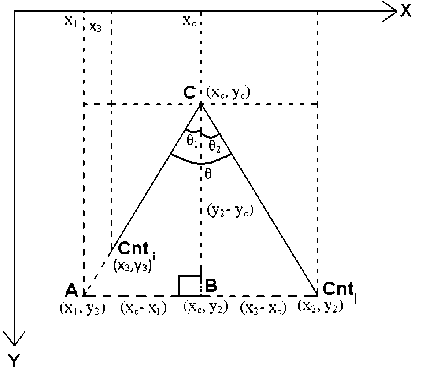
Fig 6: The Angles between the control points with the centroid
From figure.6 it can be observed that coordinate of 3 points are available i.e. Centroid (C), control points Cnt i and Cnt j , where i, j ε control point set. Out of two y-values found from Cnt i and Cnt j the maximum one is selected and termed as y*. Let, B is the intersection point of vertical line through point C and horizontal scan line at y*. Further, a point A is taken as intersection of horizontal scan line at y* and extended line segment drawn from C to the control point with minimum y-value (i.e. with y ≠ y*). A perpendicular point can be drawn from point C to B (x c , y 2 ). The y coordinate of point A is y 2 since A, B and Cnt j lies on the same y coordinate, only the x coordinate of point need to be determined.
Now the equation of straight line passing through the coordinate (x c , y c ) and (x 3 , y 3 )
x - x3 x3 - xc
У - У 3 У 3 - У с
Line AB will intersect this straight line at point
( x ,, У 2 ). So Putting x = X j , y = y 2 on (9)
X3 - xr x 1 = Xз+( У2 - Уз)(--------)(10)
У 3 - У с
Hence, tan 0 ,= xc - x1(11)
У 2 - У с
A x2 - xc and tan 0 =(--------)(12)
У 2 - У с
0 =tan-1( xc - x1 )(13)
-
У 2 - У с
0 =tan-1( x2 - Xc )(14)
-
У 2 - Ус
So, 0 = (0 + 0 )
In this way all the angles between the control points with the centriod can be determined i.e. ^ Cnt10 C Cnt3, Z Cnt io C Cnt2, Z Cnt io C Cnt i , Z Cnt io C Cnt4, Z Cnt10 C Cnt5, Z Cnt2 C Cnt7, Z Cnt2 C Cnt8, Z Cnt2 C Cnt9, Z Cnt2 C Cnt 11 , Z Cnt 1 C Cnt 11 and Z Cnt3 C Cnt 9 .
-
III. Experiment and results
To conduct the experiment CASIA-C database [25] has been considered in this work. To start with, frames which are extracted from video defining single gait cycle of every individual have been considered. From the each video frame the dataset has been created using angles from the centroid to the control points, the distances from the centroid to the control points and the leg rise from the ground. Since, 11 control points have been considered, so for each person’s every gait sequences have 23 parameters (11 for angle, 11 for distance, 1 for LRFG) treating each column as parameter values. If in a sequence there are n images then for a person’s each gait sequence, the training dataset consists of 23x n matrices.
-
A. Mahalanobish Distance
In our study of recognizing human being by their gait sequences, the gait sequences are expressed here by some parameter values. 23 such parameters have been considered to express the gait sequences. The parameter values vary from person to person. Also, for the same person the parameter values fluctuate from one gait sequence to another gait sequence.
In our study, it is assumed that these parameters follow Normal Distribution. Let, X , X ,...., X are the random variables corresponding to the parameters. So the joint PDF (probability density function) of these variates is multinormal. Thus, for each person, the PDF is Multinormal with different population parameter values, such as population mean vector and population variancecovariance matrix.
For two sample matrices of order 23 x n to determine whether they are from same person or not, sample version of Mahalanobis distance [22] has been used.
Let, ^ and ^ be the mean vectors of sample training and testing vectors respectively (the mean vectors are vectors of column wise mean values) and S 1 and S 2 are the sample variance-covariance matrices of the training and testing data respectively.
Let,
5 = ( S + S^ ) /2 (16)
Then the statistic for Mahalanobis distance is as
D 2 = ( ^ 1 -^ 2 ) TS Ч^-^) (17)
If the value of D 2 is less than or equal to a threshold value, then it can be concluded that the gait sequence is of same person, otherwise it is not in the database.
-
B. Threshold value
Let, the parameter values of a gait sequence for a person is stored, which is an 23 x n order matrix. Now, another such k gait sequence-values of same person are compared. In each case, the D2 values have been calculated. Let, these D2 values areD21 ,D22 ,....., D2k . Now, it has been defined
D 2| k = !( D 2| + D 22 ++ D 2 k ) (18)
k
In this way, for p persons D21k , D22k ,.....,D2pk have been calculated and define
D 2 avg = !( D 2j k + D 22 k ++ D 2 pk ) (19)
p
D 2 avg + О , has been chosen to be the threshold value where, О is the precision value defined by
О = !(( D 2аХ д - D 21 k )2 ++ ( D 2 av, - D 2 pk )2)1/2 p
In our experiment gait sequences of 100 persons have been considered and corresponding feature vectors of gait sequences have been created. The vectors for each person and for each sequence of the order of 23 X 25(in each sequence there are 25 images). Since, 3 sequences of a person has been taken, the feature vector would be in the form of three matrices having dimension 23 X 25 and D2 value is calculated with sequence 1-2 ,sequence 1-3 and sequence 2-3 and calculate D2 avg and the precision value by the equations (19) and (20).
For individual persons the D 2 values i.e. D 2 1 , D 2 2 , , D 2 k (where k is the sequence number, in this case k = 3 have been considered) have been calculated.
And for the 100 persons the D2avg has been calculated and it is 0.360138.
To find out the threshold value, the precision value is required. The Precision can be defined as the ability of a measurement to be consistently reproduced and the number of significant digits to which a value has been reliably measured.
-
C. Training and Testing
In the training phase, the dataset has been made by the measures of different gait sequences of different persons as discussed above. In testing phase, it has been tested with unknown gait sequence of person and extracts the features by the same procedure as in the training phase and find a match with stored features of persons gait sequences.
If there is no match between the probe sequence and the gallery sequences then it can be inferred that the information about the person is not available in the database.
Algorithm-2: Training
Input: Image sequences of different persons.
Output: Training dataset and threshold.
Step1. Create Database of Silhouette images of different persons.
Step2. for each pair wise gait sequence of the same person do the following
-
a. Create the dataset by following components-
- i) The Euclidean Distance between
the Centroid Point and the control points (ABLC).
-
ii) The Control angle between the
Centroid Point and the control points (DBCC).
-
iii) The Leg Rise from the ground
(LRFG).
-
b. Compute the pair wise Mahalanobish-distance for the gait sequences of the same person and store these values for each person.
-
c. Compute threshold value using the procedure described in section III B
Algorithm-3: Testing
Input: Unknown Gait Sequence
Output: Match or No Match
Step1. Take a gait sequence of an unknown person.
Step2. Extract features by the procedure described in step2 (a) of algorithm-2.
Step3. Compute Mahalanobish-distance between the testing data and each training sequence data with predefined threshold value to check for matching.
The precision value can be obtained by experimental results. The good response of recognition depends on this precision value. This value can be positive or negative. It has been depicted in the figures (figure.8, Figure.9 and in figure.10) the response of the false rejection rate (FRR), false acceptance rate (FAR) and the correct recognition rate (CRR) in accordance with value of +σ,-σ and ±σ. It has been found out that correct recognition rate is 91% and both the FAR and FRR is 9% if σ = 0.14.i.e for the threshold value D2avg + σ =0.500138 ≈0.5.
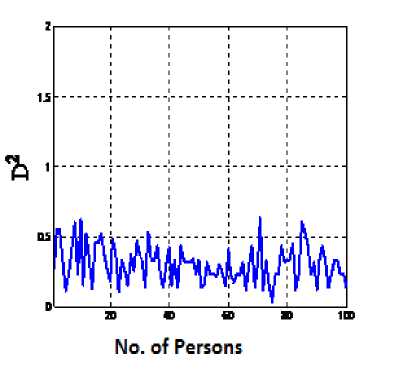
Fig 7: The D 1 k , D 2 k ,....., D pk values corresponding to 100
persons are mapped in this figure.
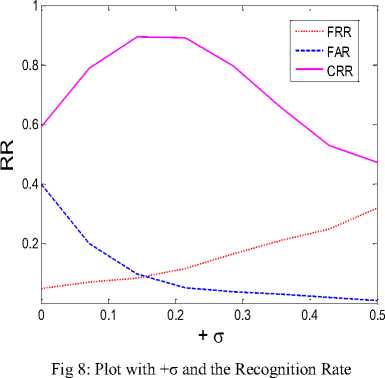
The figure. 8 shows at σ=0, the different recognition rate i.e. FRR is at 6%, FAR is at 40%, CRR at 60% and as the value σ increases FRR slowly increases and the slope of FAR decreases and the slope of CRR increases and at σ= 0.14 FRR and FAR crosses each other and both have values 9% and CRR is 91% and at σ=0.2 the slope of CRR decreases, and FAR becomes less but FRR is increasing .
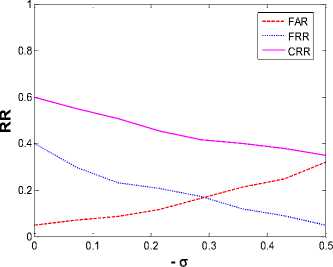
Fig 9: Plot with -σ and the Recognition Rate
The figure. 9 shows how the recognition rates varies with the –ve value of σ . FRR decreases and FAR increases with the increase of –ve value of σ and they crosses each other when σ=-0.3 and their recognition rate is 18%. The slope of CRR gradually decreases as σ becomes more –ve.
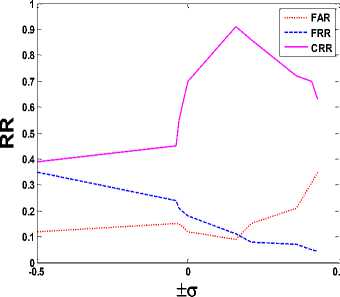
Fig 10: Plot with ±σ and the Recognition Rate
The figure. 10 shows both the +ve and –ve increment of σ with the recognition rates. It shows below the zero value of σ i.e. in the –ve direction the response of CRR and FRR, FAR is not appreciable compared to the +ve direction and when σ=+0.14, CRR becomes maximum i.e. 91% and considering the trade of between FAR; FRR the value can be taken at 0.09 of RR i.e. 9%.
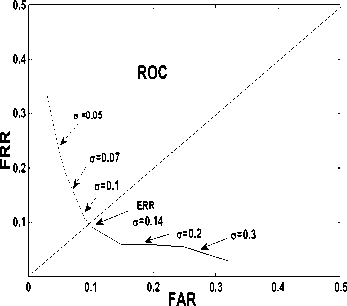
Fig 11: From the ROC curve the ERR value is 0.09 for σ = 0.14 i.e. at this point FAR=FRR.
Table I: Different Recognition Parameters
|
person |
Correct recognition |
Correct rejection rate |
False acceptance rate |
False rejection rate |
|
100 |
91% |
91% |
9% |
9% |
To examine the performance of the proposed algorithm, comparative experiments have been conducted which is shown in table II. From Table II, it is clear that the method, proposed here, has shown significant improvement in performance as compared to other recent methods for same database.
Table II: Comparison of different approaches with our methods
|
Method |
Database |
Recognition Rate |
|
GEI [23] |
CASIA-C |
74% |
|
2DLPP[24] |
CASIA-C |
88.9% |
|
Proposed Method |
CASIA-C |
91% |
-
IV. Conclusion
With strong experiential evaluation, this paper focuses on the idea of using silhouette-based gait characteristics. With the increasing demands of visual surveillance systems, human identification at a distance has recently gained more interest in the field of image processing and pattern recognition. Gait is a potential behavioral feature and many allied studies have demonstrated that it has a rich potential as a biometric for recognition. Gait is sensitive to various covariate conditions, which are circumstantial and physical conditions that can affect either gait itself or the extracted gait features. Example of these conditions includes carrying condition (backpack, briefcase, handbag, etc.), view angle, speed and shoewear type etc. Our technique is very good in terms recognition accuracy but here only lateral view with movement from left to right has been considered, so there is a good scope to extend this technique on different view angle between camera and object.
Acknowledgment
The authors would like to thank Mr. Hongyu Liang for providing the database of the silhouettes named “CASIA Human Gait Database” collected by Institute of Automation, Chinese Academy Of sciences. Their thanks also go to those who have contributed to the establishment of the CASIA database [25].
References An Efficient Characterization of Gait for Human Identification
- Giovanni, B.: 'On the movement of animals', Springer-Verlag, 1989.
- Braune, W., Fischer, O.: Translated by Maquet, P., Furlong, R.: 'The human gait (Der gang des menschen) '. Berlin/New York: Springer Verlag, 1987.
- Johansson, G., 'Visual Perception of Biological Motion and a Model for its Analysis', Perception and Psychophysics, 1973 vol. 14, no. 2, pp. 201-211.
- Troje, N.: 'Decomposing Biological Motion: A Framework for Analysis and Synthesis of Human Gait Patterns', Journal of Vision, 2002, vol. 2, no. 5, pp. 371–387.
- Wang, L., Tan, T., Ning, H., and Hu, W.: 'Silhouette Analysis-Based Gait Recognition for Human Identification', IEEE Trans. on PAMI, December 2003, pp. 1505-1518.
- Murray, M., Drought, A., and Kory, R.:'Walking Pattern of Normal Men', Journal of Bone and Joint Surgery, 1964, vol. 46–A, no. 2, pp. 335–360.
- Boyd, J. E.: 'Synchronization of Oscillations for Machine Perception of Gaits', 2004, CVIU, vol. 96, no. 1, pp. 35–59.
- Sarkar, S., Phillips, P., Liu, Z., et el.: 'The HumanID Gait Challenge Problem: Data Sets, Performance, and Analysis', IEEE Trans. on PAMI, 2005, vol. 27, no. 2, pp. 162–177.
- Collins, R. T., Bross, R., and Shi, J.:'Silhouette based Human Identification from Body Shape and Gait,' FG, Washington DC, 2002, pp. 351–356.
- Davis, J. W. and Bobick, A. F.: 'The Representation and Recognition of Human Movement using Tempora Templates', CVPR, 1997, pp. 928–934.
- Veres, G., Gordon, L., Carter, J., and Nixon, M.: 'What Image Information is Important in Silhouette–based Gait Recognition?' CVPR, 2004, vol. 2, pp. 776–782.
- Gavrila, D.:' The Visual Analysis of Human Movement: A Survey', Computer Vision and Image Understanding, 1999, vol. 73, no. 1, pp. 82-98.
- Wang, L., Hu, W.M., and Tan, T.N.: 'Recent Developments in Human Motion Analysis', Pattern Recognition, 2003, vol. 36, no. 3, pp. 585-601.
- Jain, A., Bolle, R., and Pankanti, S.: 'Biometrics: Personal Identification in Networked Society'. Kluwer Academic Publishers, 1999.
- Rousseeuw, P. J.: 'Least Median of Squares Regression' Journal of the American Statistical Association December 1984, Volume 79, Number 388.
- Kuno, Y., Watanabe, T., Shimosakoda,Y., and Nakagawa, S.: 'Automated Detection of Human for Visual Surveillance System,' Proc. Int'l Conf. Pattern Recognition, 1996, pp. 865-869,.
- Sobel, I. , :'An Isotropic 3×3 Gradient Operator, Machine Vision for Three – DimensionalScenes', Freeman, H., Academic Pres, NY, 1990, pp. 376-379,.
- Shi, J. and Tomasi, C.:'Good Features to Track.' Proceedings of the IEEE Conference on Computer Vision and Pattern Recognition.June 1994, pp. 593–600.
- Moravec, H.: 'Obstacle Avoidance and Navigation in the Real World by a Seeing Robot Rover'. Tech Report CMU-RI-TR-3 Carnegie-Mellon University, Robotics Institute, 1980.
- Harris, C. and Stephens. M.: 'A combined corner and edge detector', Proceedings of the 4th Alvey Vision Conference. 1988, pp. 147–151,
- Winter, D.A.: 'Biomechanics and Motor Control of Human Movement, third ed., John Wiley & Sons, New Jersey, 2004.
- Mahalanobis, P. C.: 'On the generalised distance in statistics'. Proceedings of the National Institute of Sciences of India 2 (1): Retrieved 2012-05-03, 1936, pp. 49–55.
- Jungling, K., Arens, M.: 'A multi-staged system for efficient visual person reidentification' MVA2011 IAPR Conference on Machine Vision Applications, June 13-15, 2011, Nara, JAPAN
- Zhang, E., Zhao, Y., Xiong, W.: 'Active energy image plus 2DLPP for gait recognition'. Signal Process. 2010, vol- 90, pp. 2295–2302.
- CASIA gait database http://www. sinobiometrics .com.
