An Efficient CNN Model for Automatic Diagnosis of Cardiomegaly from Chest Radiographic Images

Author: Akanksha Soni, Avinash Rai
Journal: International Journal of Image, Graphics and Signal Processing @ijigsp
Article in issue: 3 vol.15, 2023.
Free access
This work presents an algorithm for the automatic detection of cardiomegaly on CXR images. Cardiomegaly is a medical condition in which the heart becomes enlarged than the actual and the efficiency of the heart would decrease and sometimes congestive heart failure occurs. Although there could be numerous reasons, high blood pressure and coronary artery disease are the main causes of cardiomegaly. Hence, the main intention of this work is to develop a CNN based model to efficiently identify the presence of cardiomegaly abnormality. The learning phase of the model is achieved by using CXRs that are extracted from the publically available “chest x-ray14” medical dataset and to compute the proposed model performance, an experimental platform is designed and implemented in the MATLAB tool. We have trained the model with 100, 120, 150, and 200 epochs. But the trained model with 120 epochs shows a revolutionary outcome. The acquired accuracies of 100,120,150 and 200 epochs are 84.69%, 98.00%, 89.09% and 87.64% respectively. However, many approaches have been developed for cardiomegaly identification but the proposed model shows record performance.
Cardiomegaly, Cardiothoracic Ratio (CTR), Chest Radiograph (CXR), Convolutional Neural Network (CNN), MATLAB, Adaptive Histogram Equalization
Short address: https://sciup.org/15018764
IDR: 15018764 | DOI: 10.5815/ijigsp.2023.03.07
Text of the scientific article An Efficient CNN Model for Automatic Diagnosis of Cardiomegaly from Chest Radiographic Images
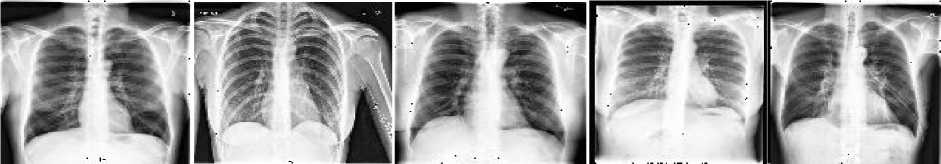
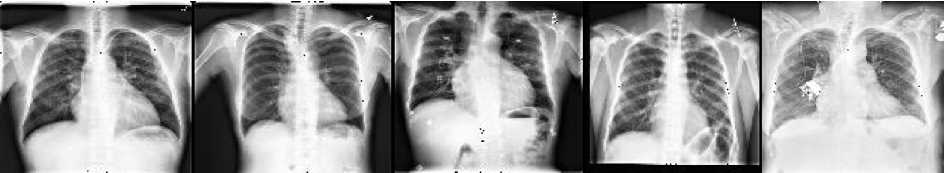
A large number of diseases that influence the worldwide populace are chest-related and cardiomegaly is one of them. The heart is located in the middle of the chest and is responsible for pumping blood throughout the body. But sometimes cardiomegaly may occur that influences the functioning of the heart due to various factors e.g. inactive lifestyle, hypertension, thyroid disorder, diabetes, coronary artery disease, inherited disorder, and cardiomyopathy. Fig. 1 shows the sample of healthy and cardiomegaly affected CXRs that are extracted from the “chest x-ray14” publically available medical dataset. There are mainly 2 kinds of cardiomegaly abnormality-
-
(a) Dilative cardiomyopathy:
This condition affects the ventricles and atria of the heart due to this heart’s muscles get weakened and enlarged. Consequently, the heart's ability to pump blood becomes decreased and in some cases, heart failure can occur. Thus, Dilative cardiomyopathy is the foremost reason for heart enlargement because the muscles of the heart begin to dilate as a result it stretches and becomes thinner.
-
(b) Hypertrophic cardiomyopathy:
In this type of cardiomyopathy condition, the heart muscle becomes abnormally larger and thicker, especially ventricles. The thickened ventricle wall can block or reduce the flow of blood that may obstruct the functionality of the heart.
(a)
(b)
Fig. 1. Samples from the dataset (a) Normal CXRs, (b) Cardiomegaly affected CXRs
Medical imaging has non-invasive characteristics that reveal the interior structure of the body in a visual form for clinical analysis [1]. There are many types of medical imaging techniques e.g. X-ray, ultrasound, CT scan, and MRI. Chest radiograph or X-ray is a form of electromagnetic radiation. It is one of the simplest, cost effective, and widely used techniques which shows the inside structure of the human body [2] to diagnose the abnormal condition of the chest, bones, skull, teeth, and so on. In the radiographs, hard tissues like bones look white because they absorb the radiation most, while fatty and soft tissues absorb less radiation so look gray, and air influenced part looks black due to the least radiation absorption. Thus different tissues absorb different amount of radiation which makes the radiographs readable. Consequently, a huge amount of radiographic images are generated every day but manual detection and classification of chest abnormalities are considered laborious and time-consuming task for radiologists and physicians. In addition, it also requires highly skilled radiologists as these images are often difficult to differentiate from other abnormal conditions of the chest [3]. To eradicate this issue and give a value added solution artificial intelligence (AI) and deep learning (DL) based algorithm shows excellent performance and proved their effectiveness for image segmentation and object identification. However various researches have been done for the detection of cardiomegaly but each model has its own limitation. Consequently, the major intention of this study is to design CNN based model for cardiomegaly identification on CXRs images that can be beneficial in healthcare planning and management strategies. CNN is a multilayer neural network, inspired by the visual system of the human brain, and it is generally used in the analysis of visual imagery. Thus CNNs can be utilized in image recognition and analysis, image classification, and natural language processing and have proven outperformance on image classification tasks.
We are interested in not only identifying cardiomegaly abnormality but also enhancing detection accuracy over previous models. Hence, for implementing this model we have fixed three major objectives: The first goal is to develop an automated approach to detect cardiomegaly abnormality significantly using chest radiographs, the second is to design a lightweight system and the third one is to boost the detection accuracy from the existing models in terms of various performance metrics.
Following are the key contributions of this work:
• Designed an efficient model for automatic recognition of cardiomegaly on CXRs using deep learning approach.
• The raw images were first passed into pre-processing step because some factors adversely affect the image quality. In this step, image quality gets improved by reducing the unwanted information; therefore enhanced image visualizes the affected area effectively for accurate anticipation.
• In the proposed model ten convolutional layers, twelve activation function layers, and four max pooling layers have been utilized that outperform for the identification of cardiomegaly.
• For comparative purpose, we have trained the model with different epochs like 100, 120, 150, and 200.
• The obtained results have been compared with the existing systems in terms of various performance
2. Related Works
parameters like accuracy, sensitivity and specificity.
The rest of the work is arranged as follows. Section 2 depicts the related works. Section 3 is all about the introduction of CNN. Section 4 represents the workflow of proposed. Section 5 and 6 illustrate the material and method of the developed system. Section 7 highlights the performance evaluation and thorough discussion that provide clear picture about the model. Section 8 conclude the paper and highlights future opportunity.
Chest abnormalities identification using basic digital image processing approaches is very time taking and inadequate but Deep Learning and Artificial Intelligence proved a high boost in the area of the medical field. Cardiomegaly disease detection is addressed by the many studies along with other abnormalities of the chest [13,14].
Bouslama et al. [4] proposed a Deep Convolutional Neural Network U-Net based system to identify cardiomegaly from CXR images with appreciable accuracy.
Lee et al. [5] developed a segmentation based approach using deep learning which is helpful for identifying cardiomegaly from chest X-ray images. In addition, it is also determine the cardiothoracic ratio automatically using the mean absolute error and paired t- test.
Chamveha et al. [6] implemented a U-Net with VGG16 encoder based DL model for calculating cardiothoracic ratio from chest radiographs with 67.1% accuracy.
Sogancioglu et al. [7] designed a segmentation based approaches for automatic detection as well as ratio measurement of cardiomegaly from CXR images which acquire the 0.977 AUC performance that is higher than the classification based model. Thus, this technique demonstrates better result than the image-level classification method.
Saiviroonporn et al. [8] proposed an artificial intelligence based cardiothoracic ratio measurement approach using MATLAB software. In this study, AI-assisted, AI- only and manual methods were used for cardiomegaly and CTR value analysis. However AI- assisted method present a promising performance than the others.
Sema Candemir et al. [9] used a deep CNN for automatic identification of cardimegaly from CXRs.
Que et al. [10] designed a deep learning based algorithm called CardioXNet for analyzing cardiomegaly and cardiothoracic ratio measurement from CXRs with remarkable accuracy.
Torres-Robles et al. [11] introduced fuzzy method using Radial Basis Function (RBF) neural network based approach that is capable of analyzing correct measurement of CTR, and provide better classification in comparison with traditional approaches.
Arsalan et al. [12] presented a residual mesh-based chest radiographic semantic segmentation networks for classification of anatomical structure of chest for diagnostic purpose.
Abiyev et al. [13] implemented a deep CNN based algorithm for chest pathologies identification from CXRs. For comparative purpose, competitive neural networks (CpNNs) and back propagation neural networks (BPNNs) are also constructed for chest diseases detection. However, CNN achieved the best result due to their deep structure.
Bharati et al. [14] introduced a hybrid deep learning based algorithm called VDSNet for various lung diseases detection from CXRs with 73% validation accuracy. This new hybrid deep learning approach is designed by combining VGG, data augmentation and spatial transformer network.
Zhou et al. [20] developed and evaluated deep learning models for detection and segmentation of cardiomegaly, pneumothorax, and pleural effusion on CXRs. The detection models acquired appreciable accuracy for cardiomegaly detection.
Tariqul Islam et al. [21] presented an ensemble deep convolutional network (DCN) model for chest abnormality detection and localization. Cardiomegaly classification achieved 92% accuracy while using single DCN model and the Ensemble DCN model acquired 93% detection accuracy.
Allaouzi et al. [22] proposed an approach for multi-label classification of chest diseases. The new method combines the effectiveness of CNN for image feature extraction.
Guan et al. [23] proposed an attention guided two-branch CNN (AG-CNN) for chest disease classification by combining the global and local information. AG-CNN enhances the average AUC to 0.868.
Kim et al. [24] proposed a one-step, end-to-end learning algorithm for multiclass classification of lung diseases on CXRs d using a transfer learning technique.
Lin et al. [25] designed a CXR-RefineDet model by combining RRNet and the improved RefineDet network to solve the problem of multiple lesions detection on chest x-ray. The inference speed and detection accuracy have reached 6.8 fps, and 0.1686 mAP respectively.
Mugahed et al. [26] presented a deep learning CAD system for multiclass prediction on chest radiographs. The two different databases of CXRs were used: ChestX-ray8 and COVID-19. The designed CAD based predictor, acquired overall classification and detection accuracies of 97.40% and 96.31%.
Zhao et al. [27] proposed contralaterally enhanced networks for chest abnormalities localization in x-ray images. The presented approach can also be utilized in weakly supervised disease localization.
Luo et al. [28] developed a model to automatically detect chest diseases using YOLOv5 and ResNet50. mAP, F1-score and precision are used as the evaluation metrics to measure the model’s performance. YOLOv5 + ResNet50 achieved 0.254 mAP (ground truth is 0.6), and 0.512 precision which is bit superior than YOLOv5, Fast RCNN, EfficientDet.
Table 1. shows the existing models summary on cardiomegaly identification.
Table 1. Summary of the Existing Works for Cardiomegaly Detection
|
Author |
Technique Summary |
Model Performance |
|
A . Bouslama et al.[4] |
Deep CNN U-Net based system to identify cardiomegaly from CXR images with appreciable accuracy |
Accuracy of detection between 93 and 94% |
|
M . S . Lee et al.[5] |
Introduced two segmentation based approach using DL models for identifying cardiomegaly from CXR, also determine the cardiothoracic ratio automatically via mean absolute error and paired t- test. In method 1 two separate XLSor18 models has been used for segmenting lungs and heart, while method 2 was developed by standard U-Net 20 architecture. |
- Method 1: Dice = 0.968 and 0.955 for segmenting lungs and heart, respectively; - Method 2: Dice = 0.971 and 0.957 for segmenting lungs and heart respectively |
|
I. Chamveha et al.[6] |
Implemented a U-Net with VGG16 encoder based DL model for calculating CTR on CXRs. |
Accuracy of cardiomegaly detection: - 67.1% for the NIH CXR dataset and - 69.8% for CheXpert dataset. |
|
E. Sogancioglu et al.[7] |
Cardiomegaly recognition on CXRs using two DL approaches (1) anatomical segmentation and (2) image-level classification. However segmentation based approach presents the better performance. |
approach is 97.7%
|
|
S. Bharati et al.[14] |
Introduced a hybrid deep learning based algorithm called VDSNet for various lung disease detection from CXRs |
Validation Accuracy: 73% |
|
S. Candemir et al.[9] |
Studied the deep CNNs performance for automatic identification of cardiomegaly using X-Ray images |
Highest Accuracy: 88.24% (Fine-tuned VGG-16) |
|
Q. Que et al.[10] |
Designed an algorithm called CardioXNet to identify cardiomegaly from CXRs. The CardioXNet utilizes DL methods U-NET. |
|
|
R. H. Abiyev et al.[13] |
Multiple chest disease recognition on CXRs using deep CNN based algorithm. For comparative analysis, BPNNs and CpNNs have been carried out for disease classification. |
|
|
L. Zhou et al. [20] |
Developed and validated DL models for detection and segmentation of cardiomegaly, pneumothorax, and pleural effusion on CXRs |
-Models generated highest accuracy for cardiomegaly detection i.e. 98.0% average precision (AP).
|
|
T. Islam et al.[21] |
Proposed ensemble deep convolutional network (DCN) model for chest abnormality detection and localization |
For cardiomegaly detection:
|
3. Convolutional Neural Network (CNN)
In this framework, we designed CNN based model to extract the CXRs features and use those features to identify cardiomegaly. In recent years, CNN achieved remarkable success in various fields like image analysis, classification, speech recognition, face recognition, language translation, medical image analysis, and other vision tasks.
CNN is the class of Deep Neural Network that plays a very essential role in image classification and other computer vision tasks to extract different spatial and temporal features from the image [15]. Generally, CNN uses raw data as input and executes non-linear and convolutional operations to find out valuable information and features about the images. During the phase of training, CNN regulates their filter values (weights) by optimizing certain loss functions via forward passes and back-propagation process. Consequently, inputs are accurately mapped to the groundtruth labels. Typically, a CNN consists of convolution, pooling, and dense layers. CNN architecture is made up of several kinds of sequential layers some of which are repeated. Below we explain the most common layers:
-
3.1. Input layer
-
3.2. Convolutional Layer
-
3.3. Activation Functions
-
3.4. Pooling Layers
It shows the entry of multiple images in the CNN architecture with standard dimension (W *H).
It is the very first layer and key component of CNN that is advantageous to extract the features from the input images by applying kernel and produces a feature map (convoluted image) as output.
The Convolutional kernels convolve the whole image as well as the intermediate feature maps to generate the feature map. Kernal divides the image into small chunks, which helps to extract the features. The convolutional operation has the weight sharing ability that plays a crucial role to extract the features by sliding the kernel with the same set of weight on the image.
Activation function is a key parameter of the CNN model that is helpful to learn and approximate any type of continuous and complex relationship between network variables. Activation function plays a significant role to avoid linearity because it adds non-linearity to the network that makes the network universal function approximator. There are different kinds of activation functions are available such Sigmoid, Rectified Linear Unit (ReLU), Tangent functions. Here, we preferred ReLU because it replaces all negative values with zero and reduces the training time in comparison to the sigmoid by fastening the convergence of stochastic gradient descent. The mathematical formulation of ReLu is stated in equation 1:
f(x) = max(0,x) (1)
The pooling layer is basically a down sampling operation which usually applied after the convolution operation. It provides a connection between convolutional and FC layer. The pooling layer is responsible for reducing the input data (image) size for feature reduction. Hence, it contains only important characteristics that enhance the model efficiency and avoids over-learning. Max and Average pooling are the two most popular used layers in CNN. However, Maxpooling proved the high performance for the proposed model. Max-pooling picks the maximum value from the feature map and avoids rest of the elements. The mathematical representation of Max- pooling is illustrated in equation 2:
pool tj = max p f ' ^x^ t+pj+p (2)
where, i and j =represents spatial position.
3.5. Fully Connected (FC) Layer
3.6. Dropout
4. Workflow
The FC layer works on a flattened input where each one input is attached to all neurons. To generate the multiplication output, the input of FC is multiplied with FC weight matrix. In the proposed model, a fully connected dense layer is utilized with Soft-max output function for classification purpose. Equation 3 represents the mathematical equation of the softmax function.
Softmax(xt) = ехр(хД (3)
Z j exp(x j ) v 7
Dropouts are added to normalize the CNN by randomly setting the outgoing neurons at the hidden layers 0 at each training iteration. Dropout usually helpful to overcome over-fitting by dropping a few neurons from the neural network during the training process as a result model size gets reduced. In this work, the dropouts are set to 30% for two class classification problem. Hence, dropout and batch normalization are very efficient to boost the system performance.
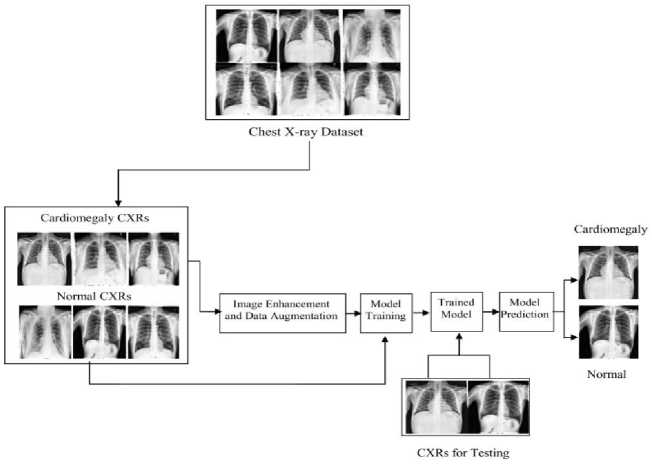
Fig. 2. Workflow of the developed system
As depicted in figure 2, the workflow of the designed system starts with the dataset collection process that has two classes: one belonged to the CXRs of cardiomegaly confirmed cases and other class belonged to the normal CXRs. The next phase is all about image quality enhancement and data augmentation, some factors adversely affect the CXRs quality. So in this step, image quality gets enhanced by suppressing the unwanted features and noise of the image. After that data augmentation was applied to generate the artificial samples from the original dataset to avoid over-fitting. In the third and fourth steps, the obtained result from the pre- processing step was utilized to train the model, and then the model was tested for its performance in the disease identification. The testing of the designed model has been done using test dataset held from the primary dataset as well as using the validation dataset.
5. Materials 5.1. Dataset Description
In this study, we accessed well known publicly available dataset i.e. Chest X-ray14 [16] that contains 112,120 frontal view of CXRs from 30,805 unique patients and has PNG format with 1024 x 1024 resolution. This dataset is dedicatedly available for research purpose. Firstly, we extract the Cardiomegaly images from chest X-ray14 dataset and categorized into two classes, i.e. Cardiomegaly and Normal. From the total 5552 CXRs images (2221 normal and 2221 cardiomegaly), 80% (4442) were used for training + validation purposes and the remaining 20% (1110) were used for testing purpose. Table 2 represents the dataset distribution details efficiently.
Table 2. Dataset Distribution
|
Dataset Division |
Cardiomegaly CXRs |
Normal CXRs |
Total CXRs |
|
Total Data |
2776 |
2776 |
5552 |
|
Training Data + Validation Data |
2221 |
2221 |
4442 |
|
Testing Data |
555 |
555 |
1110 |
6. Method
This part describes the applied procedure in detail to design the proposed model.
-
6.1. Data Pre-processing
-
6.1.1. Histogram Equalization
CXRs always suffer the limited contrast that may degrade the system performance, so the pre-processing step is very essential for better performance of the designed system [11]. The raw images were first passed into pre-processing step because some factors adversely affect the image quality. In this step, image quality gets improved by eliminating the unwanted features and noise of the image and generating the more appropriate image for better segmentation and classification.
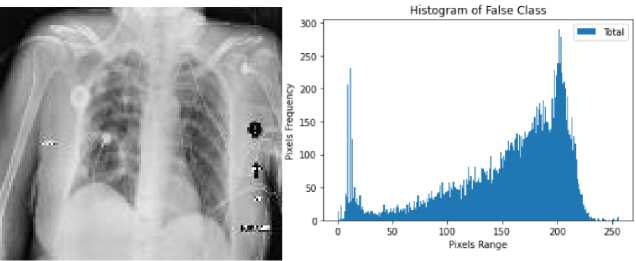
Here, we used one of the most popular histogram equalization technique named contrast limited adaptive histogram equalization (CLAHE). It is a most liked method of histogram equalization and advanced version of AHE that is beneficial to adjust the image contrast and brightness and finally increase the visibility by enhancing hidden information that can contain meaningful details about the image. Fig.3. represents the histogram of true and false class.
(a)
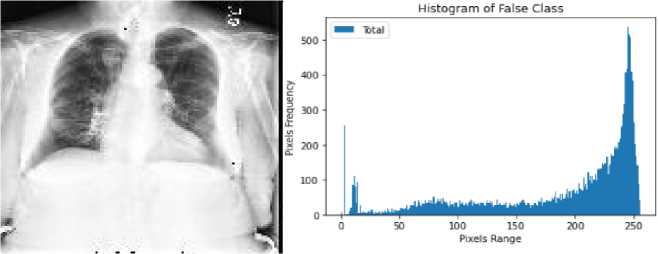
(b)
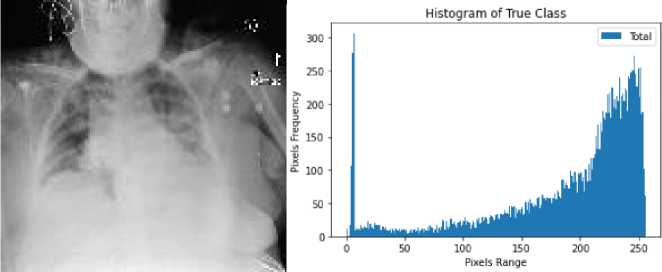
(c)
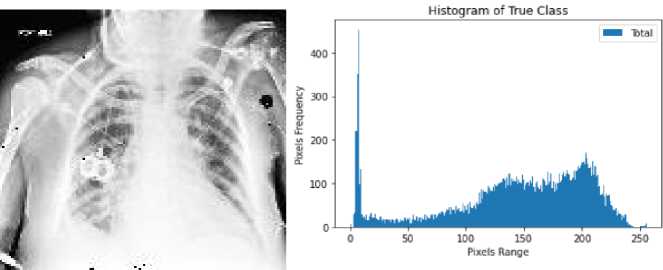
(d)
Fig. 3. Histogram of healthy and cardiomegaly CXRs; (a,b) histogram of false class, (c,d) histogram of true class
-
6.1.2. Data Augmentation
Data augmentation is used to generate the artificial samples significantly from the actual dataset [17] to avoid the over-fitting, also generates more learning features to train the model which is advantageous to make the developed model more robust because small dataset may affect the performance of the model. It performs some image processing operations like rotating, cropping, flipping, and padding. Two well-known operations, Random Rotation and Random Translation, have been utilized in this work for data augmentation.
-
• Random Rotation with kernel size [-20,20]
-
• Random Translation of X and Y axis with kernel size [-3,3]X and [-3,3]Y.
-
6.2. The Architectural Overview of Proposed Model
-
6.3. Matlab Code: Proposed Model
The customized CNN model is made up of 34 layers (see fig.4) which have 1 input layer, 10 convolution (Conv2D) layers, 12 activation function layers, 4 max pooling, 2 dropout layers, 3 fully connected layers, and 2 output layers. The shape of input image of the proposed model is (128,128,1). The 1st, 2nd and 3rd layer of Conv2D, 128 filters have been utilized with kernel size 3×3 to learn from the input, while 4th and 5th layer used 256 filters with kernel size 3×3. The 6th layer of Conv2D utilized 32 filters with kernel size 2×2, and 7th, 8th, 9th and 10th layers of Conv2D utilized 16, 64, 64, 32 filters respectively with kernel size 1×1. The activation function (ReLU) has been used after each Conv2D layer, and the 4 Max pooling layers with pooling size 2x2 applied in the developed architecture also the dropout layer has been utilized with 30% dropout rate. The model has 3 dense layers (fully connected layer) and the last dense layer is followed by a Soft-max output function for classification purpose. To decrease the loss of the model, Adam optimizer has been utilized that change the weight of attribute and learning rate. The learning rate was set to 0.0001. Table.3 presents model parameter values.
During the designing of model architecture, the CNN layers had been used with different configuration styles that had not been able to provide appropriate results. Therefore, we used an incremental approach to take the decision of how many layers of CNN will be used to obtain record performance. Firstly, the model was tested with one convolution layer and the outcome was analyzed, then the model was tested with two layers of convolution and the outcome was analyzed and so on. This approach had been going on till the revolutionary output of the model. Hence, the final architecture of the model has ten convolutional layers.
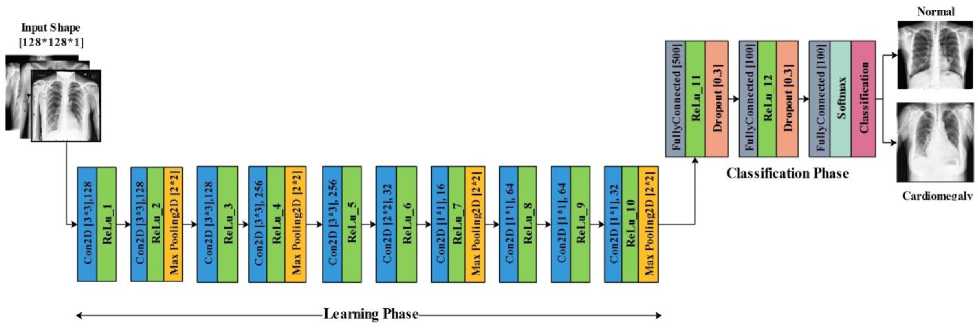
Fig. 4. Proposed model architecture
imageInputLayer([128 128 1],"Name","imageinput")
convolution2dLayer ([3 3],128,"Name","conv_1","Padding","same")
reluLayer ("Name","relu_1")
convolution2dLayer ([3 3],128,"Name","conv_2")
reluLayer ("Name","relu_2")
maxPooling2dLayer ([2 2],"Name","maxpool_1","Padding","same","Stride",[2 2])
convolution2dLayer ([3 3],128,"Name","conv_3")
reluLayer ("Name","relu_3")
convolution2dLayer ([3 3],256,"Name","conv_4")
reluLayer ("Name","relu_4")
maxPooling2dLayer ([2 2],"Name","maxpool_2","Padding","same","Stride",[2 2])
convolution2dLayer ([3 3],256,"Name","conv_5")
reluLayer ("Name","relu_5")
convolution2dLayer ([2 2],32,"Name","conv_6")
reluLayer("Name","relu_6")
convolution2dLayer ([1 1],16,"Name","conv_7")
reluLayer("Name","relu_7")
maxPooling2dLayer ([2 2],"Name","maxpool_3","Padding","same","Stride",[2 2])
convolution2dLayer ([1 1],64,"Name","conv_8")
reluLayer("Name","relu_8")
convolution2dLayer ([1 1],64,"Name","conv_9")
reluLayer("Name","relu_9")
convolution2dLayer ([1 1],32,"Name","conv_10")
reluLayer("Name","relu_10")
maxPooling2dLayer ([2 2],"Name","maxpool_4","Padding","same","Stride",[2 2])
fullyConnectedLayer (500,"Name","fc_1")
reluLayer ("Name","relu_14")
dropoutLayer (0.3,"Name","dropout_1")
fullyConnectedLayer (100,"Name","fc_2")
reluLayer ("Name","relu_15")
dropoutLayer (0.3,"Name","dropout_2")
fullyConnectedLayer (2,"Name","fc_3")
softmaxLayer ("Name","softmax")
classificationLayer ("Name","classoutput")];
Table 3. Hyper-parameters of the Model
|
Parameters |
Value |
|
Neural Network |
2D-CNN |
|
Model |
Sequential |
|
Input Layer Size |
[128,128,1] |
|
Filter to learn |
128,128,128,256,256, 32,16,64,64,32 |
|
Kernel Size |
[3*3] for filter size 128 and 256 |
|
Kernel Size |
[2*2] for filter size 32 |
|
Kernel Size |
[1*1] for filter size 16,64,32 |
|
Activation Function |
ReLU |
|
Pooling Layer |
Max pooling [2*2 ] |
|
Dense Layer |
Fully Connected layer with (500,100) neurons |
|
Dropout Rate |
30% |
|
Output Layer |
2 |
|
Output Function |
Softmax |
|
Optimizer |
Adam |
|
Environment |
Matlab |
|
Training Environment |
GPU |
|
Learning Rate |
0.0001 |
|
Epochs |
100,120,150,200 |
|
Batch Size |
32 |
|
Validation Data |
True |
For the formation of these type of models, a set of organized images in 3 important subsets are required that are helpful in different stages of the model creation.
-
• Training Dataset : The training dataset is exactly as it sounds. It is the set of data that is utilized to train the model. During each one epoch, the model is usually trained again and again over the same data in the training set. The main purpose of training is to fit the model to the training set while still generalizing to unseen data.
-
• Validation Dataset : During training process, validation data infuses new dataset into the model that is not estimated before also provides some useful information to optimize hyperparameters. Therefore, it is utilized to give an unbiased assessment of a model fit on the training dataset while tuning model hyperparameters.
-
• Test Dataset : The test sample is a set of data that is helpful to test the model after the model has already been trained and present an unbiased assessment. The test set is separate from both the training set and validation set.
-
6.4. Evaluation Metrics
To evaluate the performance of the proposed model over the existing models confusion matrix based performance matrics are utilized. These matrics include sensitivity, accuracy, specificity, precision and negative predictive value (see fig.5)
Predicted class

|
Positive |
Negative |
||
|
Positive |
True positive (TP) Obserbalion is positive and is predicted as positive |
False Negative (FN) Observation is positive, but is predicted as negative |
Sensitivity TP (TP+FN) |
|
Negative |
False Positive (FP) Observation is negative, but is predicted as positive |
True Negative(TN) Observation is negative and is predicted as negative |
Specificity TN (TN+FP) |
|
Precision TP (TP+FP) |
Negative Predictive Value TN (TN + FN) |
Accuracy TP+TN |
|
|
(TP+TN+FP+TN) |
Fig. 5. Confusion matrix
• Accuracy- It determines the overall performance of the model by evaluating how many samples are correctly recognized over the whole dataset.
• Precision – It tells about the number of positive predictions by the model that truly belongs to the positive class.
• Sensitivity – It has the ability to correctly identify the diseased samples, means sensitivity is the ratio of actual positive cases that are accurately recognized as +ve.
• Specificity- It is the ratio of actual negative cases that are accurately recognized as –ve.
• F1- Score- It gives a balance b/w precision and recall.
• ROC Curve- ROC is the probability curve that plot of sensitivity against specificity.
7. Results and Discussion
7.1 Experimental setup7.2 Training and Validation Phase
7.3 Performance Analysis
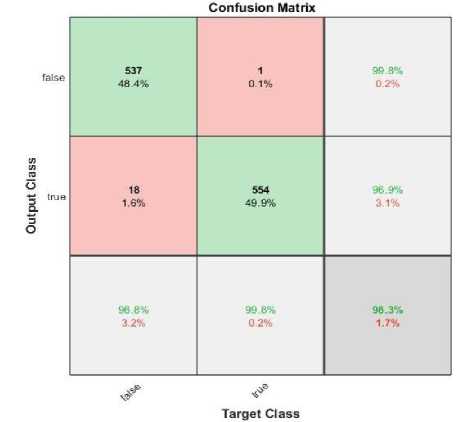
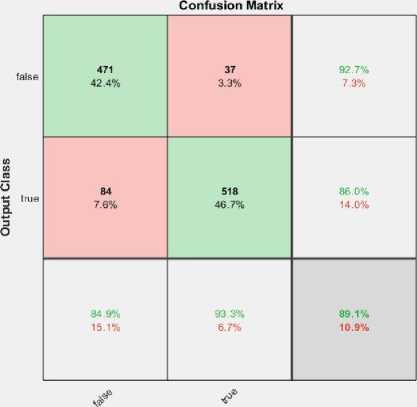
The tested phase performance of the model for 120 epochs is illustrated in fig.7 (b). The confusion matrix shows; the proposed model used 1110 x-ray images for testing purpose, where 555 images belong to the normal class and other 555 images belong to the cardiomegaly. The developed model depicts remarkable performance on testing. Table.4 illustrates the overall performance of the developed model for each epoch with individual classes (i.e. True, False).
The dataset has 5552 cardiomegaly images where 80% samples have been utilized for training + validation and the remaining samples have been used for testing purpose i.e. 20%. The input images were resized to 128 × 128 matrix. We have designed the 34 layers deep model that have: 1 input layer, 10 convolution (Conv2D) layers, 12 activation function layers, 4 max pooling, 2 dropout layers, 3 fully connected layers, and 2 output layers. The experiments were made on different epochs with batch size 32, and before the softmax classification layer, the dropout layer was added with .3 dropout probability. The learning rate was fixed at 0.0001.
The training performance of the developed model was evaluated in terms of various parameters. Fig. 6 illustrates the training and validation phase of the model in terms of accuracy and loss while training the model for 120 epochs. The blue line signifies the training accuracy while the black line signifies the validation accuracy of the model. Similarly, for the loss plot, the training loss is presented by the orange line, whereas validation loss is depicted by the black line. The highest generated training and validation accuracy of the model is 98% and 80% respectively on the 120 epochs. In the same way, the training and validation loss of the model is .4 and .5 respectively on the 120 epochs. However, we have trained the model with different epochs like 100, 120, 150, and 200. But the trained model with 120 epochs presents the revolutionary outcome.
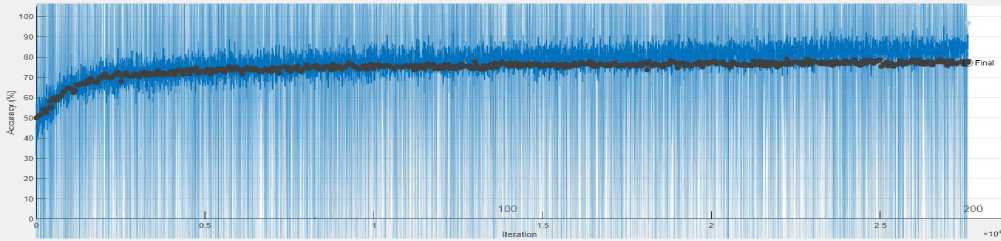
(a)
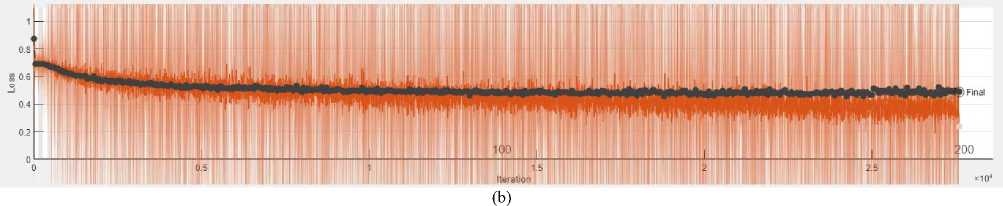
Fig. 6. (a) Training accuracy vs. validation accuracy and (b) training loss vs. validation loss for 120 epochs
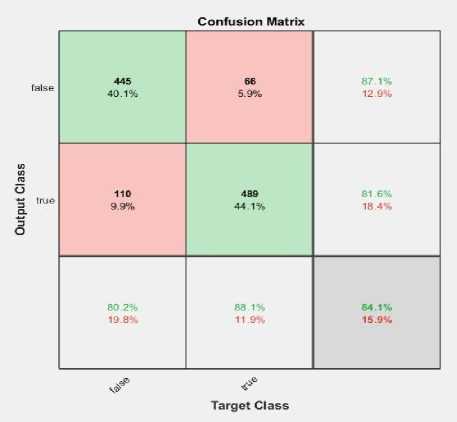
The confusion matrix was produced for the tested dataset that shows the number of CXRs recognized by the model i.e. correctly and incorrectly. To estimate the mentioned scores, the confusion matrix for 100, 120,150, and 200 epochs are shown in fig.7. The fig.7 (b) represents that among total 1110 CXRs images, only 19 samples were misclassified by the model from the test subset. Here, 537 CXRs detected as TP and 1 image were recognized as FN, likewise 18 and 554 images were detected as FP and TN respectively. So, as per the total number of correct predictions; model accuracy has been estimated as 98.00% for 120 epochs which is a bit superior to the existing models.
-
• For 100 epochs: 934 images were correctly predicted out of 1110 CXRs, and 176 images are misclassified.
-
• For 120 epochs: 1091 CXRs were correctly classified while 19 images are misclassified.
-
• For 150 epochs: 989 CXRs were correctly classified and the remaining 121 were wrongly classified.
-
• For 200 epochs: 970 images were correctly detected by the model while 140 CXRs are misclassified.
(a)
(b)
Target Class
(c)
Fig. 7. Confusion matrix for (a) 100 epochs, (b)120 epochs, (c)150 epochs and (d)200 epochs

Target Class
(d)
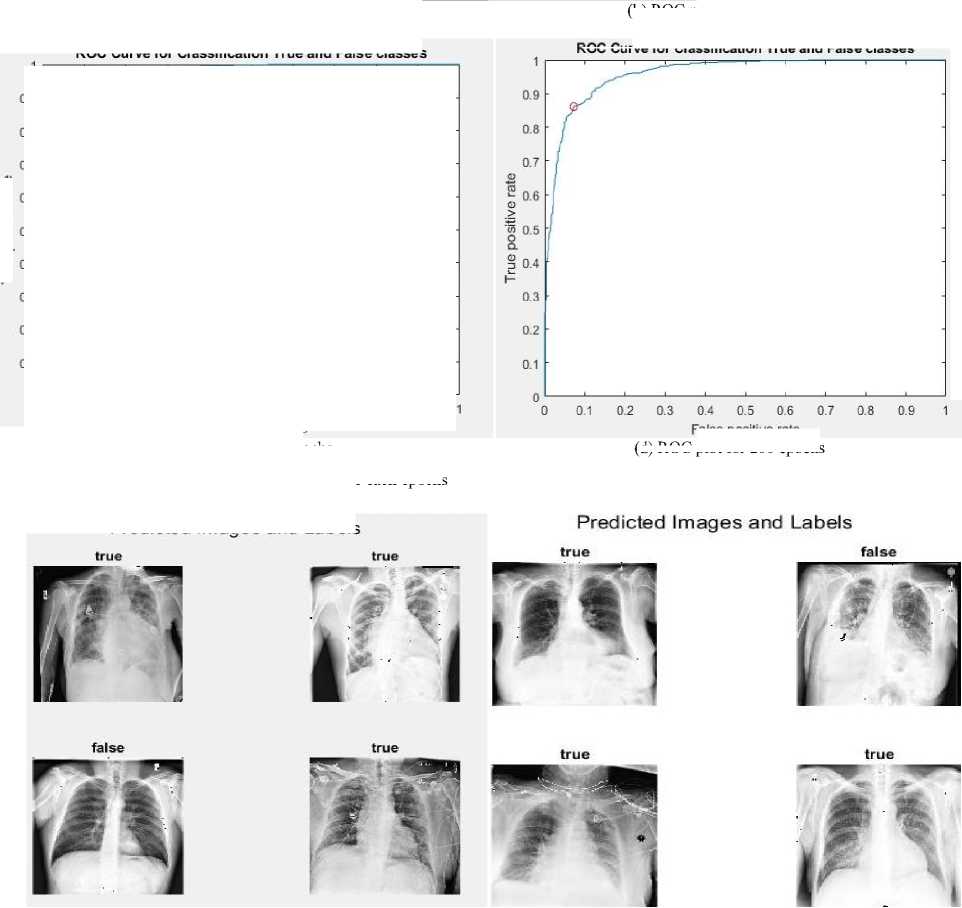
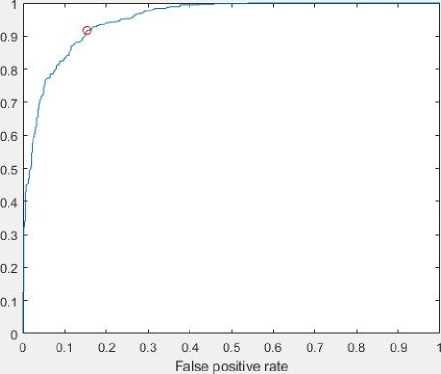
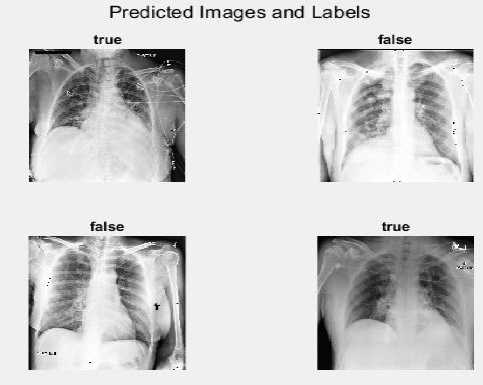
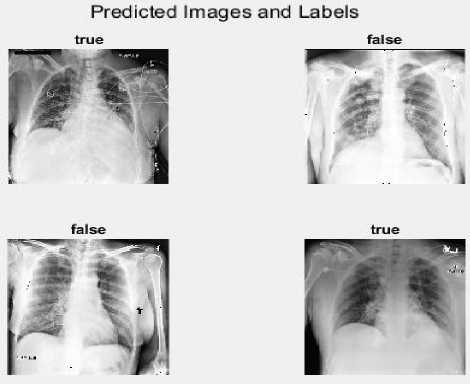
Fig.8 depicts the receiver operating characteristic (ROC) curve for each epoch. Thus, the experimental outcome verifies the efficiency of the developed approach. Fig.9 illustrates the predicted images and labels for 100, 120,150 and 200 epochs respectively.
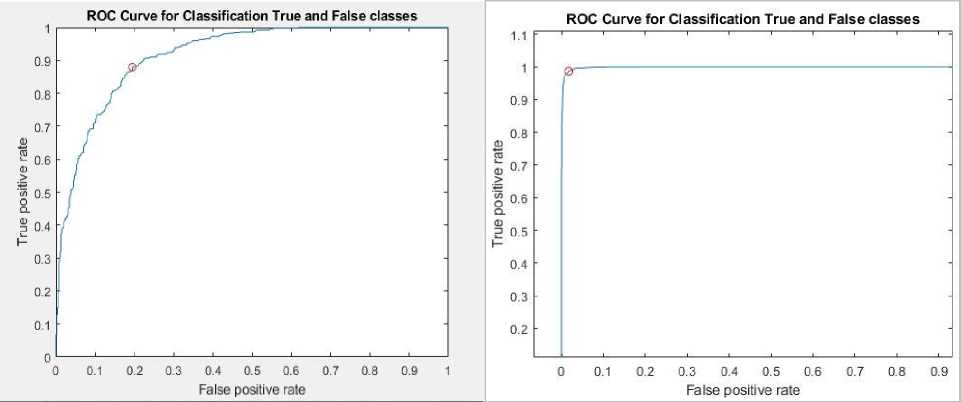
(b) ROC plot for 120 epochs
ROC Curve for Classification True and False classes
(a) ROC plot for 100 epochs
ROC Curve for Classification True and False classes
True positive rate
(b)
(a)
(c) ROC plot for 150 epochs
Fig. 8. Receiver operating characteristic (ROC) curve for each epochs
Predicted Images and Labels
False positive rate
(d) ROC plot for 200 epochs
(c)
Fig. 9. Predicted images and lables for 100, 120,150 and 200 epochs respectively
(d)
Table 4. Overall Performance of the Model on Different Epochs with Individual Classes
|
Metrics |
Classes |
Accuracy % |
Precision % |
Recall % |
F1-Score % |
Sensitivity % |
Specificity % |
|
100 Epochs |
TRUE |
84.69 |
87.75 |
80.64 |
84.05 |
80.64 |
88.74 |
|
FALSE |
82.09 |
88.74 |
85.29 |
88.74 |
80.64 |
||
|
120 Epochs |
TRUE |
98.00 |
99.58 |
96.40 |
97.96 |
96.40 |
99.59 |
|
FALSE |
96.51 |
99.59 |
98.03 |
99.59 |
96.40 |
||
|
150 Epochs |
TRUE |
89.09 |
93.62 |
83.88 |
88.48 |
83.88 |
94.28 |
|
FALSE |
85.40 |
94.28 |
89.62 |
94.28 |
83.88 |
||
|
200 Epochs |
TRUE |
87.64 |
88.63 |
86.36 |
87.48 |
86.36 |
88.92 |
|
FALSE |
86.70 |
88.92 |
87.80 |
88.92 |
86.36 |
7.4 Comparative analysis with exiting models
8. Conclusions and Future Scope
The proposed model shows 98% cardiomegaly detection accuracy, which is quite greater than the existing techniques and it can significantly provide assistance for identifying cardiomegaly using CXRs images that definitely will prove the rapid solution for cardiomegaly diagnosis by giving low cost. Table 5. illustrates the performance evaluation of the developed system with state-of-art techniques. A. Bouslama et al. [4] proposed a Deep CNN U-Net based system to identify cardiomegaly from CXR images with detection accuracy between 93 and 94%. M.S. Lee et al. [5] introduced two segmentation based approach using DL models for cardiomegaly identification from CXR, also determine the CTR with remarkable outcome. I. Chamveha et al. [6] developed a U-Net with VGG16 encoder based DL model for cardiomegaly detection performance with 67.1% accuracy for NIH Chest X-ray dataset and 69.8% accuracy for CheXpert dataset. E. Songancioglu et al. [7] investigated the cardiomegaly detection through two alternative deep-learning approaches i.e. segmentation-based and classification based. The performance of the segmentation-based model was more appreciable than the classification-based system. P. Saiviroonporn et al. [8] presented manual, AI-assisted, and AI-only methods for cardiomegaly identification. The observer and method
Table. 5. Result Comparison with Various Existing Methods
In this framework, we have designed CNN based model for automatic diagnosis of cardiomegaly from CXRs images that can be beneficial in healthcare planning and management strategies. CXRs images always suffer the limited contrast that may degrade the system performance, so the pre-processing step is very essential for better performance of the designed system. The developed system follows 3 important steps i.e. image quality enhancement by applying CLAHE to normalize the images then data augmentation was applied to create the artificial samples from the actual dataset to avoid the over-fitting, also generate the more learning features to train the model and the last step was dedicated to data processing via customized CNN based model. We accessed well known publicly available dataset. Firstly, we extract the cardiomegaly reports from the chest X-ray14 dataset and categorized them into two classes, i.e. Cardiomegaly and Normal. From the total CXRs images, 80% were used for training + validation purposes and the remaining 20% were used for testing purpose. However, we have trained the model with different epochs like 100, 120, 150, and 200. But the trained model with 120 epochs shows the revolutionary outcome. Various performance parameters, e.g., precision, accuracy, specificity, sensitivity, recall, F1- score, confusion matrix, and loss graph were used to validate the system accuracy. The acquired accuracies of 100,120,150 and 200 epochs are 84.69%, 98.00%, 89.09% and 87.64% respectively. However, many approaches have been developed for cardiomegaly detection but the proposed model shows the record performance.
In the future, more evolutionary algorithms can be utilized as feature selection techniques by combining with other classification models and deep learning approaches for acquiring more accurate outcomes with the less computational period. This work may be expanded by considering more diseases other than chest diseases with the large-scale dataset.
References An Efficient CNN Model for Automatic Diagnosis of Cardiomegaly from Chest Radiographic Images
- Cristina Barsanti, Francesca Lenzarini, and Claudia Kusmic, “Diagnostic and prognostic utility of non-invasive imaging in diabetes management,” World Journal of Diabetes, vol. 6, pp.792-806, 2015. DOI: http://doi.org/10.4239/wjd.v6.i6.792
- https://www.mayoclinic.org/tests-procedures/x-ray/about/pac-20395303 . last accessed 5 March 2022.
- Tarun Agrawal, and Prakash Choudhary,“Segmentation and classification on chest radiography: a systematic survey,” The Visual Computer, Springer, 2022. DOI: https://doi.org/10.1007/s00371-021-02352-7
- Abdelilah Bouslama, Yassin Laaziz, and Abdelhak Tali, “Diagnosis and precise localization of cardiomegaly disease using U-NET,” Informatics in Medicine Unlocked, Elsevier, 2020. DOI: https://doi.org/10.1016/j.imu.2020.100306
- Mu Sook Lee, Yong Soo Kim, Minki Kim, Muhammad Usman, Shi Sub Byon, Sung Hyun Kim, Byoung Il Lee and Byoung‑Dai Lee, “Evaluation of the feasibility of explainable computer‑aided detection of cardiomegaly on chest radiographs using deep learning,” Scientific Reports, Nature, 2021. DOI: https://doi.org/10.1038/s41598-021-96433-1
- Isarun Chamveha, Treethep Promwiset, Trongtum Tongdee, Pairash Saiviroonporn, and Warasinee Chaisangmongkon, “Automated Cardiothoracic Ratio Calculation And Cardiomegaly Detection Using Deep Learning Approach,” arXiv:2002.07468v1 [eess.IV] 2020. DOI: https://doi.org/10.48550/arXiv.2002.07468
- Ecem Sogancioglu, Keelin Murphy, Erdi Calli, Ernst T. Scholten, Steven Schalekamp, and Bram Van Ginneken, “Cardiomegaly Detection on Chest Radiographs: Segmentation Versus Classification,” IEEE Access, vol. 8, pp. 9463 – 94642, 2020. DOI: https://doi.org/10.1109/ACCESS.2020.2995567
- Pairash Saiviroonporn, Kanchanaporn Rodbangyang, Trongtum Tongdee, Warasinee Chaisangmongkon, Pakorn Yodprom, Thanogchai Siriapisith, Suwimon Wonglaksanapimon and Phakphoom Thiravit, “Cardiothoracic ratio measurement using artificial intelligence: observer and method validation studies,” BMC Medical Imaging, pp.1-11, 2021. DOI: https://doi.org/10.1186/s12880-021-00625-0
- Sema Candemir, Sivaramakrishnan Rajaraman, George Thoma, and Sameer Antani, “Deep Learning for Grading Cardiomegaly Severity in Chest X-rays: An Investigation,” IEEE Life Sciences Conference (LSC), pp. 109-113, 2018. DOI: https://doi.org/10.1109/LSC.2018.8572113
- Qiwen Que, Ze Tang, Ruoshi Wang....and Bharadwaj Veeravalli, “CardioXNet: Automated Detection for Cardiomegaly Based on Deep Learning,” 40th Annual International Conference of the IEEE Engineering in Medicine and Biology Society (EMBC), pp. 612-615, 2018. DOI: https://doi.org/10.1109/EMBC.2018.8512374
- Fabián Torres-Robles, Alberto Jorge Rosales-Silva, Francisco Javier Gallegos-Funes and Ivonne Bazán-Trujillo, “A robust neuro-fuzzy classifier for the detection of cardiomegaly in digital chest radiographies,” Dyna (Medellin, Colombia), pp. 35-41, 2014 . DOI: http://dx.doi.org/10.15446/dyna.v81n186.37797
- Muhammad Arsalan, Muhammad Owais, Tahir Mahmood, Jiho Choi and Kang Ryoung Park, “Artificial Intelligence-Based Diagnosis of Cardiac and Related Diseases,” Journal of Clinical Medicine, MDPI, pp. 1-25, 2020. DOI: http://dx.doi.org/10.3390/jcm9030871
- Rahib H. Abiyev and Mohammad Khaleel Sallam Ma’aitah, “Deep Convolutional Neural Networks for Chest Diseases Detection,” Journal of Healthcare Engineering, Hindawi, pp.1-11, 2018 DOI: https://doi.org/10.1155/2018/4168538
- Subrato Bharati, Prajoy Podder, M. and Rubaiyat Hossain Mondal, “Hybrid Deep Learning for Detecting Lung Diseases from X-ray Images,” Informatics in Medicine Unlocked, Elsevier, 2020. DOI: https://doi.org/10.1016/j.imu.2020.100391
- Rikiya Yamashita, Mizuho Nishio, Richard Kinh Gian Do et al., “Convolutional neural networks: an overview and application in radiology,” Insights into Imaging, Springer, 2018. DOI: https://doi.org/10.1007/s13244-018-0639-9
- Xiaosong Wang, Yifan Peng, Le Lu et al, “ChestX-ray8: Hospital-scale Chest X-ray Database and Benchmarks on Weakly-Supervised Classification and Localization of Common Thorax Diseases,” arXiv:1705.02315v5 [cs.CV], 2017. DOI: https://doi.org/10.48550/arXiv.1705.02315
- Tawsifur Rahman , Amith Khandakar , Yazan Qiblawey....and Muhammad E.H. Chowdhury, “Exploring the effect of image enhancement techniques on COVID-19 detection using chest X-ray images”, Computers in Biology and Medicine, Elsevier, 2021. DOI: https://doi.org/10.1016/j.compbiomed.2021.104319
- Soham S. Sarpotdar, “Cardiomegaly Detection using Deep Convolutional Neural Network with U-Net”, arXiv:1705.02315v5, 2022.
- Haralabos Bougias, Eleni Georgiadou, Christina Malamateniou and Nikolaos Stogiannos, “Identifying cardiomegaly in chest X-rays: a cross-sectional study of evaluation and comparison between different transfer learning methods”, Acta Radiol., 62(12):1601-1609, 2021. DOI:10.1177/0284185120973630
- Leilei Zhou et al, “Detection and Semiquantitative Analysis of Cardiomegaly, Pneumothorax, and Pleural Effusion on Chest Radiographs”, Radiology: Artificial Intelligence; 3(4):e200172, 2021. DOI: 10.1148/ryai.2021200172
- Mohammad Tariqul Islam, Md Abdul Aowal, Ahmed Tahseen Minhaz, Khalid Ashraf, “Abnormality Detection and Localization in Chest X-Rays using Deep Convolutional Neural Networks”, arXiv:1705.09850v3 [cs.CV, 2017.
- Imane Allaouzi and Mohamed Ben Ahmed, “A Novel Approach for Multi-Label Chest X-Ray Classification of Common Thorax Diseases”, IEEE Access, Vol. 7, 2019. DOI: 10.1109/ACCESS.2019.2916849
- Qingji Guan, Yaping Huang, Zhun Zhong, Zhedong Zheng, Liang Zheng and Yi Yang, “Diagnose like a Radiologist: Attention Guided Convolutional Neural Network for Thorax Disease Classification”, arXiv:1801.09927v1 [cs.CV],2018.
- Sungyeup Kim, Beanbonyka Rim, Seongjun Choi, Ahyoung Lee, Sedong Min and Min Hong, “Deep Learning in Multi-Class Lung Diseases’ Classification on Chest X-ray Images”, Diagnostic, MDPI, 2022. DOI: 10.3390/diagnostics12040915
- Cong Lin,Yongbin Zheng, Xiuchun Xiao ,and Jialun Lin, “CXR-RefineDet: Single-Shot Refinement Neural Network for Chest X-Ray Radiograph Based on Multiple Lesions Detection, Hindawi, Journal of Healthcare Engineering, 2022. DOI:10.1155/2022/4182191
- Mugahed A. Al-antari, Cam-Hao Hua, Jaehun Bang and Sungyoung Lee, “Fast deep learning computer-aided diagnosis of COVID-19 based on digital chest x-ray images” Applied Intelligence, Springer, 51:2890–2907, 2021. DOI : 10.1007/s10489-020-02076-6
- Gangming Zhao, Chaowei Fang, Guanbin Li, Licheng Jiao, and Yizhou Yu, “Contralaterally Enhanced Networks for Thoracic Disease Detection”, IEEE Trans on Medical Imaging, 40(9):2428-2438, 2021. DOI: 10.1109/TMI.2021.3077913.
- Yu Luo, Yifan Zhang, Xize Sun, Hengwei Dai, and Xiaohui Chen, “Intelligent Solutions in Chest Abnormality Detection Based on YOLOv5 and ResNet50” Hindawi, Journal of Healthcare Engineering, 2021. DOI: 10.1155/2021/2267635
