An Empirical Investigation of the Relationships between Learning Styles based on an Arabic version of the Felder-Silverman Model

Author: Nahla M. Aljojo, Abeer Alkhouli
Journal: International Journal of Modern Education and Computer Science (IJMECS) @ijmecs
Article in issue: 4 vol.7, 2015.
Free access
Learning styles vary according to the individual and this diversity is fundamental in terms of teaching as curricula must respond adaptively to the various learning styles of pupils. This study conducts an analysis of an Arabic form of the Index of Learning Styles (ILS), a 44-item questionnaire designed to determine learning styles using the Felder-Silverman learning style model. This study focuses on the interpretation of data derived from the Arabic form of the Index of Learning Styles (ILS) to establish correlations between the learning styles of 1024 female students drawn from two specific departments at the King Abdul-Aziz University in Saudi Arabia. The findings, generated by Multiple Correspondence Analysis and cross-validated by correlation analysis, demonstrate a definite link between certain learning styles from opposing dimensions that are considered to be contradictory within the same dimension of learning. The validity and reliability of the Arabic scale was established and compared to the examples reported in the literature. Findings show comparable reliability and factor analysis supports the interdependencies between dimensions and perhaps the constructs they intend to assess. The results of this paper have implications for the design of e-learning tools, materials and sessions in order to adapt to the relationships between learning styles and have a positive impact on the learners themselves and their learning experience.
Learning styles, Felder-Silverman Learning Style Model, Multiple Correspondence Analysis, Correlation analysis
Short address: https://sciup.org/15014748
IDR: 15014748
Text of the scientific article An Empirical Investigation of the Relationships between Learning Styles based on an Arabic version of the Felder-Silverman Model
Published Online April 2015 in MECS DOI: 10.5815/ijmecs.2015.04.05
The Internet and the World Wide Web offer an excellent and easy way to get learners in contact with learning resources. The hypermedia form of the educational material in a Web-based teaching system makes learning through it a goal-driven process, in which learners motivate themselves to find alternative ways to solve the problems using different resources from around the world. However, the presentation of the domains is usually the same for every learner, and does not take into account the user’s knowledge or learning style preference. This issue should be explored further, especially with web-based instruction, as learners can be easily characterized by their background knowledge, age, experiences, cultural backgrounds, professions, motivations and goals. Learners take the main responsibility of their own learning [1].
Technology enhanced learning solutions offer the potential to provide learning environments that support and acknowledge individual differences. Technology can enable learners to acquire knowledge and skills at a time, place and pace that are appropriate for their own particular circumstances.
There is a vast variety of learners in the world; each person has his or her own learning preference, aims and objectives. Every learner has the right to demand a high quality, personal learning experience. However, as current web-based learning environments offer a ‘one size fits all’ approach to the delivery of learning materials (every learner is given the same set of resources), the personalized approach to education is sadly lacking from most online systems. Adaptive Educational Hypermedia (AEH) seeks to address this lack. It aims to create new opportunities for learners, whilst also enhancing existing approaches – delivering lessons and courses adapted to the requirements of each learner [2]. In spite of the great amount of Adaptive Hypermedia Systems (AHS) research, there is a lack of literature about the attempts to incorporate learning styles in adaptive web-based training. The research objective is to fit the student’s learning style in order to improve the teaching/learning process. We believe that the dynamic course adaptation to the student learning style improves the process of learning. The student follows the course spending less time and obtaining better learning experience (acquiring knowledge in a comfortable environment) [3]. In past decades, researchers from different disciplines have sought to define and classify learning styles that help teachers to improve their individualized teaching.
The aims of this paper are to examine the dependencies among and within the four learning dimensions and between the eight distinct styles. It also aims to establish whether designated questions in the validated Arabic version of the FSLM questionnaire are uniquely aimed at identifying a specific learning dimension with opposite poles.
This study is divided into five sections and the following section will discuss the materials and methodology used in this project. Next, section three will outline the findings, section four will interpret the findings and section 5 will provide some closing remarks on the results.
-
II. Related Works
A wide range of contemporary learning style theories exist and many have been studied in relation to real-life learning situations [4-9]. This article primarily uses the system devised by Felder and Soloman [10], which is referred to as the Index of Learning Styles (ILS). This index contains a 44-item questionnaire that facilitates the identification of learning styles in terms of the FSLSM. Each individual has a tendency towards a particular learning dimension and this is determined by assigning a value between +11 to -11 to each dimension, with a range of +/-2. The scoring system is based on the set of 11 questions that are asked in relation to each of the learning dimensions. An individual who is an active learner absorbs the most information by interacting actively with the course material, usually by applying knowledge in a practical sense. Conversely, a reflective learner is more successful when they explore the material internally and reflect on the knowledge they have acquired. Reflective learners typically like to study alone or perhaps with a trusted friend.
Individuals who are sensory learners prefer to absorb information using primarily their sensory perception. As such, they generally work through problems using conventional methods and are very careful and precise. Conversely, intuitive learners are drawn towards more theoretical or conceptual material and rely primarily on hypothetical theories over definitive facts. In addition, they creatively interpret the material and establish new connections in the content, an approach not usually favored by sensory learners. Visual learners absorb the most knowledge using visual aids and verbal learners recall information easily when they encounter it in a textbased format. The fourth dimension features sequential learners who focus best when approaching tasks on a step-by-step basis, thus they typically follow a strategic logical pattern when working through problems. Conversely, global learners perceive the issue as a whole and approach knowledge in a more general, or universal, manner.
There are obvious limitations to the Felder Silverman learning style model in terms of online education that must be resolved to enhance the student experience. The findings of this analysis can be applied to make the determination of individual learning styles more accurate and if the system is more precise in designating style, online educational resources can design more appropriate course formats and a range of options to suit the different learning preferences. However, these improvements in adaptively can only be made if learning styles are accurately determined and the findings discussed hereafter can be used to devise more precise and customized programs based on the various learning dimensions. For instance, the accurate identification of learning style by the Felder Silverman model would allow for more personalized course content, teaching styles and mediums according to the needs and aptitudes of the student.
There are a wide range of courses available and each have a unique format, topic, target audience and level of quality. As learning styles vary, many unique systems have been devised to facilitate flexibility in terms of learning approach, such as the system formulated by Carver et al. [14], the Arthur system [15], the ACE (Adaptive Courseware Environment) approach [16], LSAS [17], Iweaver [18], INSPIRE [19], MASPLANG [20,21], EDUCE [22], TANGOW [23] and TASAM [24], the very first Arabic adaptive learning development.
In the TASAM system used Felder and Silverman’s LST uses a sliding scale to formulate an individual’s preferred learning. It takes into account four dimensions: sensing-intuitive, visual-verbal, active-reflective and sequential-global [25, 26].
-
A. Materials
The Index of Learning Styles (ILS) was devised by Felder and Soloman and is comprised of a 44-item questionnaire designed to determine the specific learning style of an individual based on the principles of the FSLSM. As discussed earlier, every individual has a tendency toward a specific learning dimension and this is determined by assigning a value between +11 and -11 to each dimension, with a range of +/-2. The scoring system is based on the set of 11 questions that are asked in relation to each of the learning dimensions. For instance, if a respondent provides an answer that translates as an active tendency, their score for the active/reflective dimension is increased by +1; conversely, if they provide a ‘reflective’ answer, their score for the active/reflective dimension is decreased by -1. Thus, a score of either +1 (A) or -1 (B) is allocated for each answer given, an A score is indicative of the first pole of each dimension, namely active, sensing, visual or sequential, and a B score is indicative of the second pole, namely reflective, intuitive, verbal or global [10, 13].
Thus, the tendency toward the different dimensions can be expressed by calculating the total at the end of each questionnaire section as follows:
'dim =∑ t=i чГ (1)
This vector of indices expresses the index of learning styles using a four-feature vector. The series of items contained in each questionnaire section can be expressed as QDIM ={qШМ ,q1™ }. Based on this, each answer is expressed in binary and the index itself is expressed on an ordinal scale whereby an individual is referred to as having more or less of a particular characteristic.
For the analysis, a dataset containing the answers to the Arabic version of the Index of Learning Styles (ILS) from 1024 female students from two faculties at the King Abdul-Aziz University in Saudi Arabia was used. The two faculties included the Arts and Humanities and Economics and Administration, within the Arts and Humanities Faculty, there are two departments, namely Arabic Psychology and Mass Communication. In addition, there are five different departments that form the Economics and Business Administration Faculty: Public Administration, Accounting, Economics, Political Science, Law and Business Administration. M expresses the 1024x44 matrix and comprises one row for each learner and one column for each potential answer to the Arabic version of the model. This matrix generates positive and negative values that are calculated in binary. Based on the Arabic format of the ILS, two variables for each question(Qi ,Q = 44) were generated.
a1= 1 if qj = 1, 0 otherwise (2)
a2 = 1 if q , = -1, 0 otherwise (3)
-
B. Methods
Following the methods used by Viola et al. [22], the research consisted of the following stages:-
Stage 1: Frequencies of occurrence of each style
A is defined as the 1024 X 88 matrix that lists individuals in rows and ai (i= ,…․,88) in columns. This matrix is often used in multivariate statistics as a complete disjunctive form as it illustrates the exact data as the original matrix. Thus, individuals who expressed a tendency toward one of the eight styles were organized into groups, regardless of the strength of preference (See Table 1). In addition, each individual demonstrating '-DIM > 0 or 'dim< 0 in response to each question were totaled and this figure was divided by the number of elements in each data set, more specifically, the frequency of a specific answer within each specific learner group. Learners showing a preference for each of the eight styles, irrespective of the strength of preference, were selected and grouped (Table 1) and the highest-scoring dimension was Visual (87%) while the lowest-scoring dimension was Verbal (13%). The results mirrored the anticipated outcome as it was assumed that the majority of individuals are primarily visual learners and the data generated resembles the findings in many similar studies [27].
Table 1. Frequencies and percentages for each of the learning styles, regardless of the degree of preference
|
ILS dimension |
Active/Reflective |
Sensing/Intuitive |
Visual/Verbal |
Sequential/Global |
||||
|
Learning style |
A |
R |
Sen |
I |
Vis |
Ver |
Seq |
G |
|
Frequency |
649 |
374 |
528 |
495 |
888 |
136 |
635 |
389 |
|
Percentage |
16% |
37% |
52% |
48% |
87% |
13% |
62% |
38% |
Stage 2: Pearson’s Correlation
Pearson’s correlation coefficient (r) and the coefficient of determination (R2 ) refer to the extent of collinearity that exists between simulated and measured figures. The correlation coefficient is measured on a scale of -1 to +1 and indicates the degree of a linear correlation between simulated and observed figures. Thus, if r = 0, there is no linear correlation between them and if r = 1 or -1, either a positive or negative linear correlation is detected. In the same way ,R2, measured on a scale of 0 to 1, refers to the scale of variance in generated data as elucidated by the model. A higher R2 value is indicative of a lower error variance and values above 0.5 are generally satisfactory [28, 29]. These measurements have been incorporated regularly into model analysis but they frequently generate outlier values and do not account for variations between calculated data and figures forecast by the model [30].
M expresses the 1024x44 matrix and comprises one row for each learner and one column for each potential answer to the Arabic version of the model. This matrix generates positive and negative values that are calculated in binary. Based on the Arabic format of the ILS, two variables for each question( Qi , Q = 44) were generated.
a i (1) = 1 if q, = 1,0 otherwise (4)
a i (2) = 1 if q, = -1,0 otherwise (5)
The data was translated into frequencies (on an absolute scale) to maintain consistency using both forms of correlation analysis, including Pearson’s coefficients and multivariate analysis. In cases where a binary variable is indicative of two opposing categories in terms of ILS answers, two distinct variables can be formed from xu namely, x2 1) and x2) ) , each representing the occurrence frequency of each binary class measured as either 0 or 1. For this study, x1 1 ) + x2 2 ) = 1 holds, and the geometrical configuration of the two new variables x1 1) and x2 2 ) in R2 represents the set containing the extreme points based on the left to right diagonal of the unit square [27, 31]. The findings in terms of correlation coefficients analysis of each learning style are compiled in Table 3.
Stage 3: Multiple Correspondence Analyses
Correspondence analysis (CA) is an exploratory data technique for categorical data to visually study relationships among two variables. Multiple correspondence analyses (MCA) is an extension of correspondence analysis (CA) which allows one to analyze the pattern of relationships of several categorical dependent variables. Technically, MCA is obtained by using a standard correspondence analysis on an indicator matrix (i.e. a matrix whose entries are either 0 or 1). The percentages of explained variance need to be corrected, and the correspondence analysis interpretation of interpoint distances need to be adapted. MCA is used to analyze a set of observations described by a set of nominal variables. Each nominal variable comprises several levels, and each of these levels is coded as a binary variable [32].
S is defined as the matrix which lists the 88 questionnaire answers in rows and the 8 defined learning styles in columns. S was then subject to the Multiple Correspondence Analysis (MCA) [33, 34] algorithm. From here, the low graphical exploration of data was completed in reference to the first two axes. See Figure 1 and Table 4 for MCA findings. This approach provides a two-dimensional image that accurately approximates the structure of the clouds of the Arabic version of the Index of Learning Styles (ILS) and the questions and clusters of learning styles to determine which items were shared and how they were shared. Pearson’s correlation coefficients between the eight learning styles, along with their significance levels, were used to validate the results.
Stage 4: Exploratory Factor Analysis (EFA)
Factor analysis is a multivariate statistical procedure that is commonly used in the fields of psychology and education. Exploratory Factor Analysis (EFA) has many uses; it reduces a large number of variables into a smaller set of variables (factors), establishes underlying dimensions between measured variables and latent constructs, provides construct validity for self-reporting scales, examines the structure or relationship between variables and assesses the dimensionality of a theoretical construct. Here, EFA was used primarily to assess the validity of the ILS questionnaire with its four dimensions and also examines the relationship between them. Table 6 shows the results of Factor loading of the first 3 PCA factors and Table 6 illustrates the results of Exploratory Factor Analysis (EFA).
-
IV. Results
This section discusses the findings generated by MCA and correlation analysis and outlines the results to answer groups that relate to each learning style. Following this, a discussion on the primary attributes of learning styles is provided.
-
A. Correlation Analysis
To explore the correlation between the eight learning styles, Pearson’s correlation coefficients, shown in Table 1, reveal some interesting associations between styles, whether they belong to the same dimension or a different one. All correlation coefficients are significant since the probability of obtaining such values by chance alone is relatively small (p value <0.0001) for all the correlation coefficients.
These findings are significant as they uncover interdependencies and intradependencies between the four ILS dimensions. The correlations within the same dimension (Active/Reflective .68, Sensing/Intuitive .65, Visual/Verbal .39 and Sequential /Global .70) do not show a very strong association but indicate that the ILS dimensions, more or less, assess the same variable having two opposite expressions.
A more interesting finding is the strong correlation between Sequential style with Active, Sensing and Visual styles (r=0.94, r=0.93 and r=0.95 respectively). In addition, the correlation between Visual style with Active and sensing styles is indisputable (r=0.97 and 0.92 respectively) and highly significant.
It is crucial that all students identify their unique learning style and aptitudes so that they know how to successfully engage with course content. In addition, an awareness of one’s personal learning preferences shows motivation and focus as the student approaches his/her studies in a way that is most likely to yield positive results.
To this end, classrooms should be designed in a way that facilitates different styles of learning, perhaps with a range of tools and equipment suitable for each style. This would also help the teaching staff approach their role flexibly as they can quickly switch between different teaching mediums. In terms of lay-out, the classroom should be customizable and desks should be easily moved so that groups can be formed. In addition, teachers should consider new ways of presenting information in a way that appeals to different learning styles, perhaps by using visual aids or by holding practical demonstrations. Furthermore, it has been suggested that student’s becoming familiar with their own different learning styles will have a positive effect on the class as a whole.
Table 2: Correlation coefficients of each style. High values (>.9) are in bold
|
Active |
Reflective |
Sensing |
Intuitive |
Visual |
Verbal |
Sequential |
Global |
|
|
Active |
1 |
0.68 |
0.89 |
0.86 |
0.97 |
0.43 |
0.94 |
0.83 |
|
Reflective |
0.68 |
1 |
0.77 |
0.77 |
0.83 |
0.52 |
0.80 |
0.77 |
|
Sensing |
0.89 |
0.77 |
1 |
0.65 |
0.92 |
0.42 |
0.93 |
0.72 |
|
Intuitive |
0.86 |
0.77 |
0.65 |
1 |
0.89 |
0.48 |
0.81 |
0.87 |
|
Visual |
0.97 |
0.83 |
0.92 |
0.89 |
1 |
0.39 |
0.95 |
0.87 |
|
Verbal |
0.43 |
0.52 |
0.42 |
0.48 |
0.39 |
1 |
0.48 |
0.43 |
|
Sequential |
0.94 |
0.80 |
0.93 |
0.81 |
0.95 |
0.48 |
1 |
0.70 |
|
Global |
0.83 |
0.77 |
0.72 |
0.87 |
0.87 |
0.43 |
0.70 |
1 |
-
B. Multiple Correspondence Analysis Outcomes
Correspondence analysis shows four interpretable dimensions with non-trivial singular values of magnitude 10-1 and 10-2. The four eigenvalues (Inertia) represent the percent of variance explained by each dimension which amounts collectively to only 3%. Looking at the high represented answers, Table 3 shows the column marginal masses or style relative percentages.
Table 3: Column marginal masses or style relative percentages
|
Active |
Reflective |
Sensing |
Intuitive |
Visual |
Verbal |
Sequential |
Global |
|
16% |
9% |
13% |
12% |
22% |
3% |
13% |
10% |
With the visual style being the most dominant and verbal the least represented in the sample, for the first latent dimension, we discovered that the Active, Sensing, Visual and Sequential styles fall on the negative side of dimension 1 while the counterpart styles (Reflective, Intuitive, Verbal and Global) fall on the positive side.
The positive semiaxis of latent dimension 2 encompasses the Active, Visual, Intuitive and Global styles while the negative semiaxis encompasses their counterparts. This confirms the theory that they do in fact represent the opposite sides of each other within the same dimension. Some styles belonging to different ILS dimensions seem highly correlated, namely, Active and Visual, Sequential and Sensing and Global and Intuitive.
The positive semiaxis of the latent dimension includes the Active, Visual, Intuitive and Global styles, which are indicative of a learner who recalls information more readily through actively engaging with the content and talking about it with peers. In addition, it is suggestive of a learner that engages visually with material and retains knowledge that is provided in a visual format, perhaps on charts or in active demonstrations. Furthermore, they enjoy thinking about the information abstractly and enjoy finding correlations in data. In contrast, they do not enjoy learning by rote or logical sequences; they tend to view knowledge in a more holistic sense and do not approach learning in a very structured manner. Conversely, the negative semiaxis includes the opposing learning styles (Reflective, Intuitive, Verbal and Global), and these are indicative of learners who prefer approaching knowledge in a logical and sequential manner and prefer content that has real-life applications. In addition, they tend to think about information and retain knowledge that is either text-based or verbal.
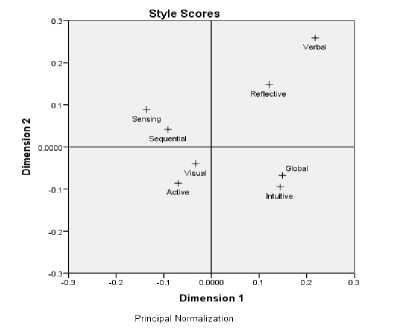
Fig.1. The eight styles on the MCA plane. Euclidean distance from zero are as follows (Active: 0.11, Reflective: 0.9, Sensing: 0.16, Intuitive:
0.17, Visual: 0.34, Sequential: 0.10 and Global: 0.16)
-
C. Analysis of the clusters of answers nearest to each style
Multiple Correspondence Analysis (MCA) quantifies nominal (categorical) data by some measure of correspondence between cases (objects) and categories so that objects within the same category are close together and objects in different categories are far apart. Each object is as close as possible to the category points of categories that apply to the object. In this way, the categories divide the objects into homogeneous subgroups. Variables are considered homogeneous when they classify objects of the same categories into the same subgroup.
It is used as a descriptive/exploratory and dimension reduction technique that results in information which is similar in nature to that produced by Factor Analysis techniques, and they allow one to explore the structure of categorical variables. There are several parallels in interpretation between correspondence analysis and factor analysis. According to the Euclidian distances between questions, the nearest 25 questions are grouped within each learning style (Table 3). We will not distinguish between first 11 questions and the first 25 questions since the distances are repeated and are very close to one another; all 25 questions, in terms of closeness, are indistinguishable. For all eight styles, almost all (10 or 11) questions that are developed to indicate preference for a certain style appear among the nearest 25 of that specific style. The other 14 or 15 questions belong to a style that’s highly correlated to it as indicated in Table 1. The overall implications of Table 3 are very consistent with Figure 2 and Table 1. Looking at proximity measures in Table 3, The Active/Reflective dimension is highly influenced by the Visual/Verbal dimension, in each direction separately. The same is true for the Sensing/Intuitive dimension with the Sequential/Global dimension. Small influences represented by a couple of questions are not explicitly mentioned.
The Active learning style is strongly associated with the Visual style. All 11 questions for the Visual style appear among the nearest 25 to the Active style and 7 Active questions appear among Visual learners. This can be explained by the strong correlation between Active and Visual styles. It implies that visual learners and Active learners answer questions in a similar way. Therefore, they share similar characteristics in acquiring knowledge.
The Reflective style and the Verbal style have 10 questions from each in common, which may also indicate similar learning characteristics.
The Sensing learning style is also strongly associated with the Sequential style. All 11 questions belonging to the Sequential style appeared among the nearest 25 to Sensing style, and 7 questions from the Sensing style appear in the Sequential style, along with five questions from the Visual style. For the negative poles of these two dimensions, namely the Intuitive and Global styles share the 11 questions interchangeably, which reflects the strong influence of both dimensions on each other. In conclusion, we can surmise that learners within a Sensing/Intuitive dimension seem to answer questions similarly to learners within the Sequential/Global dimension (and vice versa).
These associations are attributable to the connection between sensing and sequential styles and mirror the results found in our analysis (Table 1) and many previous studies, for example the study by Felder and Spurlin [35]. This could be explained by the fact that sensing and sequential learners show a fondness for facts.
An interesting finding is that six questions appeared to belong to the opposite pole of different dimensions.
Namely questions 4b, 28b, 40b (Global) and 4b
(Reflective) appeared among the nearest 25 questions in the Visual style, and the same for questions 9a and 39a (Active), as they appeared among the nearest 25 questions in the Intuitive style. This is not a surprising result as Global and Reflective styles are influenced by Visual styles (r=0.87, r=0.86 and p value <0.0001
respectively). In addition, Active and Intuitive styles are strongly correlated (r=0.86, p value <0.0001).
-
D. Learning Styles Characterization
Based on the findings illustrated in Table 4, there are many interdependencies between learning styles. By analyzing the answers associated with the active grouping (7a, 27a, 23a, 11a, 35a, 31a, 43a; 19a, 15a ,39a, 3a from the Visual style based on ILS principles; 1a, 17a, 29a, 13a, 21a, 41a, 33a, 5a, 9a, 37a, 25a from the active style; 12a, 23a and 16a from the sequential style) it is clear that these students respond well to visual stimuli and recall information more effectively if it is presented visually, either on charts, diagrams, videos or in practical demonstrations. In addition, this characterization contains attributes of an Active learner who prefers the practical application of knowledge and Sequential learners who approach problems in a structured and logical way.
The reflective group contained answers from a diverse range of styles (27b, 7b, 11b, 31b, 23b, 3b, 35b, 39b, 19b and 43b from the verbal style; 21b, 1b, 33b, 13b, 25b, 5b, 9b, 41b, 37b, 19b and 17b from the reflective style; 32b, 16b and 12b from the global style; 42b from the intuitive style). Based on this grouping, it is clear that these learners works well using text-based content and can recall information better if they read it. Conversely, these learners also like to think about what they have learnt and generally like to work on their own. The Global learner approaches information in broad manner and does not focus on details or establishing theories on what they learn; conversely, Intuitive learners enjoy looking at information in an abstract way.
The sensing group contained answers from many different styles (18a, 10a, 6a, 2a, 14a, 38a, 30a, 22a, 42a, 34a and 26a from the Sensing style; 36a, 40a, 4a, 44a, 8a, 20a, 24a, 28a, 32a,16a and12a from the Sequential style; 39a from the Visual style; 5a and 29a from the Active style) and indicates a learner with a fondness for a logical and stepped approach to learning and also a fondness for material presented visually. They learn in a group setting.
The intuitive group contained answers from any styles (26b, 20b, 8b, 44b, 24b, 16b, 40b, 32b, 28b, 4b and 12b from to Global style; 38, 34b, 18b, 6b, 22b, 2b, 10b, 30b, 42b, 14b and 26b from the Intuitive style; 5b from the Reflective style; 9a and 37a from the Active style), which represents a learner who approaches information in a broad manner and also enjoys looking at information in an abstract way; in addition, it is suggestive of a learner who prefers to work by themselves and also prefers to work in groups. The Visual group includes answers from a wide variety of styles (15a, 43a, 19a, 3a, 39a, 35a, 23a, 7a, 11a, 27a from the Visual style; 37a, 5a, 9a, 29a, 13a, 1a and 17a from the Active style; 12a, 16a and 32a from the Sequential style; 34a from the Sensing style; 28b, 4b and 40b from the Global style; 17b from the reflective style) and the highest frequency of answers imply a fondness for visual learning, group activities, logical structure, the holistic approach, intuitive absorption and detailed facts. The Verbal group contains answers from a wide variety of styles (43b, 19b, 35b, 15b, 7b, 27b, 11b, 31b, 39b, 23b and 3b from the Verbal style; 29b, 37b, 21b, 13b, 9b, 1b, 33b, 25b, 5b and 41b from the Reflective style; 12b, 16b and 32b from the Global style; 42b from the Intuitive style), which suggests a fondness for verbal content, a tendency to be quiet in class, a fondness for logic and sequences, holistic knowledge, intuitive knowledge and abstract thought.
The Sequential group contained answers from a wide variety of styles (20a, 38a, 44a,8a, 24a, 36a, 32a,16a, 40a,
4a and 12a from the Sequential style; 39a, 2a, 42a, 18a,14a,10a, 6a from the Sensing style; 39a, 35a, 19a, 43a and 3a from the Visual style; 5a and 29a from the Active style), which suggests a learner with a fondness for logical learning, fact-based information, visual data and group activities.
Finally, the Global group contains answers from many styles (36b, 8b, 20b, 24b, 16b, 32b, 44b, 40b, 4b, 28b and 12b from the Global style; 38 b, 6b, 18b, 10b, 34b, 42b, 2b, 22b, 14b, 26b and 30b from the Intuitive style; 5b, 41b and 26b from the Reflective style; 39b from the Verbal style), which suggests a learner with a distinct fondness for holistic learning, intuitive learning, logical data, abstract thought, a desire to think about information and a preference for information that is presented in a text-based or spoken format.
Table 4: The nearest 25 questions (Q) to each style according to Euclidean distance (D) in the MCA plane. Questions (in bold italics) belong to the opposite style of highly related styles.
|
Active |
Reflective |
Sensing |
Intuitive |
Visual |
Verbal |
Sequential |
Global |
|||||||||
|
D |
Q |
D |
Q |
D |
Q |
D |
Q |
D |
Q |
D |
Q |
D |
Q |
D |
Q |
|
|
1 |
0.01 |
7a |
0.01 |
21b |
0.01 |
18a |
0.03 |
38b |
0.01 |
15a |
0.05 |
43b |
0.01 |
20a |
0.01 |
38b |
|
2 |
0.01 |
27a |
0.02 |
27b |
0.02 |
10a |
0.03 |
36b |
0.01 |
43a |
0.07 |
19b |
0.01 |
44a |
0.02 |
36b |
|
3 |
0.02 |
23a |
0.03 |
7b |
0.03 |
36a |
0.04 |
34b |
0.02 |
19a |
0.09 |
35b |
0.02 |
8a |
0.04 |
6b |
|
4 |
0.02 |
11a |
0.04 |
11b |
0.03 |
6a |
0.04 |
18b |
0.02 |
3a |
0.10 |
29b |
0.03 |
24a |
0.04 |
8b |
|
5 |
0.02 |
1a |
0.04 |
1b |
0.04 |
2a |
0.04 |
6b |
0.02 |
37a |
0.11 |
15b |
0.03 |
34a |
0.06 |
18b |
|
6 |
0.02 |
17a |
0.04 |
31b |
0.04 |
40a |
0.04 |
22b |
0.03 |
39a |
0.12 |
7b |
0.03 |
2a |
0.06 |
10b |
|
7 |
0.03 |
29a |
0.04 |
33b |
0.05 |
14a |
0.05 |
2b |
0.03 |
35a |
0.13 |
37b |
0.04 |
36a |
0.06 |
34b |
|
8 |
0.03 |
13a |
0.05 |
13b |
0.05 |
38a |
0.05 |
20b |
0.03 |
5a |
0.15 |
21b |
0.04 |
32a |
0.06 |
20b |
|
9 |
0.04 |
21a |
0.06 |
25b |
0.05 |
4a |
0.06 |
8b |
0.04 |
9a |
0.15 |
13b |
0.05 |
42a |
0.06 |
42b |
|
10 |
0.04 |
35a |
0.08 |
5b |
0.05 |
44a |
0.06 |
10b |
0.04 |
23a |
0.16 |
27b |
0.05 |
16a |
0.07 |
2b |
|
11 |
0.04 |
41a |
0.08 |
9b |
0.06 |
8a |
0.07 |
30b |
0.05 |
7a |
0.17 |
11b |
0.05 |
40a |
0.07 |
24b |
|
12 |
0.05 |
33a |
0.08 |
23b |
0.06 |
20a |
0.07 |
44b |
0.05 |
12a |
0.18 |
31b |
0.05 |
4a |
0.07 |
16b |
|
13 |
0.05 |
31a |
0.09 |
3b |
0.07 |
30a |
0.08 |
24b |
0.05 |
29a |
0.18 |
9b |
0.05 |
12a |
0.07 |
22b |
|
14 |
0.05 |
43a |
0.09 |
41b |
0.07 |
24a |
0.09 |
42b |
0.05 |
16a |
0.18 |
1b |
0.06 |
18a |
0.07 |
32b |
|
15 |
0.05 |
5a |
0.10 |
35b |
0.07 |
28a |
0.09 |
14b |
0.06 |
11a |
0.18 |
33b |
0.08 |
39a |
0.07 |
44b |
|
16 |
0.05 |
9a |
0.10 |
39b |
0.07 |
22a |
0.09 |
16b |
0.07 |
27a |
0.19 |
39b |
0.08 |
14a |
0.09 |
14b |
|
17 |
0.05 |
19a |
0.11 |
19b |
0.09 |
42a |
0.10 |
26b |
0.07 |
28b |
0.21 |
25b |
0.08 |
5a |
0.09 |
26b |
|
18 |
0.05 |
15a |
0.11 |
43b |
0.09 |
34a |
0.10 |
40b |
0.07 |
17b |
0.21 |
5b |
0.09 |
10a |
0.09 |
40b |
|
19 |
0.06 |
37a |
0.14 |
37b |
0.10 |
32a |
0.10 |
32b |
0.07 |
4b |
0.23 |
23b |
0.09 |
35a |
0.10 |
30b |
|
20 |
0.08 |
39a |
0.15 |
32b |
0.11 |
16a |
0.12 |
28b |
0.08 |
32a |
0.23 |
3b |
0.09 |
19a |
0.11 |
4b |
|
21 |
0.08 |
3a |
0.16 |
16b |
0.12 |
12a |
0.12 |
4b |
0.08 |
13a |
0.24 |
41b |
0.09 |
29a |
0.11 |
28b |
|
22 |
0.08 |
12a |
0.16 |
42b |
0.12 |
26a |
0.14 |
12b |
0.08 |
1a |
0.25 |
12b |
0.10 |
6a |
0.12 |
12b |
|
23 |
0.09 |
16a |
0.16 |
29b |
0.14 |
39a |
0.17 |
9a |
0.08 |
17a |
0.27 |
16b |
0.10 |
43a |
0.14 |
5b |
|
24 |
0.09 |
25a |
0.17 |
17b |
0.15 |
5a |
0.17 |
37a |
0.09 |
34a |
0.27 |
42b |
0.10 |
3a |
0.15 |
39b |
|
25 |
0.09 |
32a |
0.18 |
12b |
0.15 |
29a |
0.17 |
5b |
0.09 |
40b |
0.28 |
32b |
0.10 |
38a |
0.15 |
41b |
|
# questions belong to the same style |
11 |
11 |
11 |
11 |
10 |
11 |
11 |
11 |
||||||||
Note that active, visual styles are strongly correlated (.97), and active, sequential is strongly correlated (.93).
-
V. Discussion
In this section we compare our results to the results obtained from other studies.
-
A. Validity and Reliability
Table 5 provides the outcomes generated by Cronbach’s alpha coefficients and the results tend to complement those found in previous studies. For instance, the same relatively low alpha value for Sequential /Global was found as in Van Zwanenberg and S 88 cols; however, the relatively low alpha value for Active/Reflective does not complement the data found in previous studies which are based on a comparably-sized data sample. The alpha coefficients appear to be relatively low overall, even those that exceed .5, thus it has been surmised that various latent dimensions can exist simultaneously and no single one can apply uniquely to only one ILS dimension.
Table 5: Results of Cronbach’s alpha coefficients. Please note that figures marked with * are derived from Felder & Spurlin [35]; those marked ** are drawn from Zywno [36] and refer to 4 pole scores, namely, Active, Sensing, Visual and Sequential.
|
Alpha |
Act/Ref |
Sen/Int |
Vis/Ver |
Seq/Glo |
Size |
|
Zywno [36] ** |
.595 |
.697 |
.633 |
.51 |
>500 |
|
Liversay et al. * [38] |
.56 |
.72 |
.76 |
.65 |
242 |
|
Spurlin* [35] |
.62 |
.76 |
.69 |
.55 |
584 |
|
Van Zwanenbreg* |
.51 |
.65 |
.56 |
.41 |
284 |
|
Litzinger et al., [37] |
.60 |
.77 |
.74 |
.56 |
572 |
|
S 88 cols |
.53 |
.63 |
.63 |
.43 |
207 |
|
Aljojo et al. [24] |
.47 |
.53 |
.58 |
.40 |
1024 |
Validity refers to the accuracy and precision of a measurement tool and is determined by performing Factor analysis. In studies by Felder and Spurlin [35] and Zywno [36], the relationships between sensing/intuitive and sequential/global dimensions (0.3-0.5) are substantiated. The relationship that exists between active/reflective and visual/verbal (0.03-0.18), that which exists between active/reflective and sequential/global (0.01- 0.18), and that which exists between visual/verbal and sensing/intuitive (0.03-0.11) are indeterminate. Zywno [36] obtains the greatest values on account of the absolute scale. Then the correlation of uncertain strength and meaning could be reasonably sustained from the strong correlation of only one pole of the ILS dimension.
The relationships between sensing/intuitive and sequential/global (0.47-0.91) in Viola et al. [27] are substantiated and indeterminate relationships are detected between active/reflective and visual/verbal (0.03-0 .92), between active/reflective and sequential/global (0.73-0.84) and between visual/verbal and sensing/intuitive dimensions (0.1-0.89).
Based on the results generated by this analysis, inter-dimensional relationships between active/reflective, sensing/intuitive, visual/verbal and sequential/global are measured as 0.68, 0.65, 0.0.39 and 0.70 respectively.
Based on the Pearson’s correlation coefficients illustrated in Table 2, results are distinct from, and mostly greater than, the results generated in previous studies.
-
B. Comparison Factor Analysis with Previous Literature
Limiting the number of extracted factors to 3 principal components, we get the factor loading presented in Table 6. As it appears in Table 5, many questions belonging to each style are highly represented by each component, which is indicative of some interdependencies in ILS dimensions. The Visual/Verbal items load highly on Factor 1 and explain approximately 6% of total item variability. This is supported by the fact that 87% of our samples are visuals. The second factor is mostly represented by the Sensing/Intuitive items, followed by Sequential/Global items, and Active/Reflective items load the highest on the third factor.
Table 6: Factor loading of the first 3 PCA factors
|
ACT/REF |
SEN/INT |
VIS/VER |
SEQ/GLO |
||
|
FACTOR 1 |
|||||
|
> I.4 I |
+ |
31,7,15,11 |
|||
|
- |
|||||
|
> I.3 I |
+ |
38,6,42 |
23,27,43,19 |
||
|
- |
|||||
|
> I .2 I |
+ |
13,21,33,29,9,25,37 |
35 |
12,24 |
|
|
- |
30,22 |
||||
|
> I.1 I |
+ |
1,41 |
10,14, |
3 |
16,32,44 |
|
- |
28 |
||||
|
FACTOR 2 |
|||||
|
> I.4 I |
+ |
30,22,2,14,26 |
|||
|
- |
|||||
|
> I.3 I |
+ |
18,20, |
20,36,44 |
||
|
- |
|||||
|
> I .2 I |
+ |
29 |
34 |
39 |
40,8,28 |
|
- |
9 |
||||
|
> I.1 I |
+ |
5,1,41,25,17 |
38,10,6 |
35,19 |
24,32,4 |
|
- |
13 |
11,31,7 |
|||
|
FACTOR 3 |
|||||
|
> I.4 I |
+ |
37,13 |
|||
|
- |
6 |
||||
|
> I.3 I |
+ |
21 |
|||
|
- |
38,10 |
||||
|
> I .2 I |
+ |
9,41,33,5,29 |
42 |
16,32 |
|
|
- |
18 |
7,11,3,23 |
|||
|
> I.1 I |
+ |
2 |
39,35,43 |
24,12,20 |
|
-
VI. Conclusions and Future Work
This study focuses on the interpretation of data derived from the Arabic form of the Index of Learning Styles (ILS) to establish correlations between the learning styles of 1024 female student drawn from two specific departments at the King Abdul-Aziz University in Saudi Arabia. The findings, generated by Multiple Correspondence Analysis and cross-validated by correlation analysis, demonstrate a definite link between certain learning styles from opposing dimensions that are considered to be contradictory within the same dimension of learning.
The application and precision of the ILS system is analyzed and the results are considered in light of those generated by previous authors. The outcomes demonstrate a similar level of validity to previous studies and factor analysis substantiates the existence of dimensional interdependencies.
Based on the findings, the alpha coefficients appear to be relatively low overall, even those that exceed .5, thus it has been surmised that various latent dimensions can exist simultaneously and no single one can apply uniquely to only one ILS dimension only. In addition, the relationship between Visual style with Active and Sensing styles is indisputable (r=0.97 and 0.92 respectively) and must be acknowledged.
In terms of MCA results, it is clear that there is a strong interdependency between the Active/Reflective dimension and the Visual/Verbal dimension from both perspectives. Similarly, the Sensing/Intuitive dimension is clearly influenced by the Sequential/Global dimension and vice versa. A limited level of dependency is identified by a number of questions that were not covered in the discussion. There is a definite relationship between the Active and Visual learning styles and this is attributable to the link between each dimension. In effect, it implies that learners of each dimension provided many of the same answers and learners are believed to share common learning attributes. In addition, ten common answers are identified between Reflective and Verbal learners which may imply that these styles also share mutual learning attributes. A definite correlation is also established between the Sensing and Sequential styles. In summary, it can be concluded that Sensing/Intuitive learners typically answer questions in a similar way to Sequential/Global learners.
Table six illustrates the outcome of factor loading based on the first 3 PCA factors by restricting the amount of extracted factors to 3 primary elements. Based on data compiled in Table 5, a significant number of questions from each dimension are signified by these elements, which suggests the existence of interdependencies between ILS dimensions. Factor 1 is highly loaded with Visual/Verbal questions and accounts for approximately 6% of item variability, substantiated by the knowledge that 87% of samples are visuals. Factor 2 is highly loaded with primarily Sensing/Intuitive items, followed closely by Sequential/Global items. Finally, Factor 3 is representative of primarily Active/Reflective items.
Subsequent study will focus on the creation of a flexible model constructed on the basis of this empirical investigation of the relationships between learning styles based on an Arabic version of the Felder-Silverman Model. If a designated model can only produce data on certain aspects of a learning style, it is important that it outlines the primary attributes of these aspects in order to construct a flexible learning system that is not based solely on the typical traits associated with an umbrella learning style.
Acknowledgment
We would like to thank Professor Kinshuk worked at Athabasca University as the professor and director of the School of Computing and Information Systems for his support and guidance which helped considerably in giving the advices and suggestion for writing this paper
References An Empirical Investigation of the Relationships between Learning Styles based on an Arabic version of the Felder-Silverman Model
- Papa Nikolaou, K.A., Grigoriadou, M., Magoulas, G.D., Kornilakis, H. (2002) Towards new forms of knowledge communication: the adaptive dimension of a web-based learning environment, www.elsevier.com/locate/compedu.
- Brusilovsky, P., and Peylo, C. (2003). Adaptive and Intelligent Web-based Educational Systems. International Journal of Arificial Intelligence in Education, 13(2-4), pp159-172.
- Paredes, P. and Rodriguez, P. (2004) A Mixed Approach to Modelling Styles in Adaptive Educational Hypermedia, Advanced Technology for Learning.
- Briggs Myers, I. (1962). Manual: The Myers-Briggs Type Indicator. Consulting Psychologists Press, Palo Alto, CA.
- Gregorc, A. F. (1982a). An Adult's Guide to Style. Gabriel Systems Inc., Maynard, MA.
- Kolb, D. (1984). Experiential learning: Experience as the source of learning and development. Englewood Cliffs, NJ: Prentice-Hall.
- Pask, G. (1976b). Styles and Strategies of Learning. British Journal of Educational Psychology, 46, 128-148.
- Honey, P., and Mumford, A. (1982). The Manual of Learning Styles. Peter Honey, Maidenhead.
- Dunn, R., and Dunn, K. (1974). Learning Style as a Criterion for Placement in Alternative Programs. Phi Delta Kappan, 56 (4), 275-278.
- Felder, R. M., and Soloman, B. A. (1997). Index of Learning Styles Questionnaire. Retrieved 30 November, 2007, from http://www.engr.ncsu.edu/learningstyles/ilsweb.html.
- Cha, H. J., Kim, Y. S., Park, S. H., Yoon, T. B., Jung, Y.M. and Lee, J.-H. (2006). Learning Style Diagnosis Based on User Interface Behavior for the Customization of Learning Interfaces in an Intelligent Tutoring System. In M. Ikeda, K. D. Ashley and T.-W. Chan (Eds.), Proceedings of the 8thInternational Conference on Intelligent Tutoring Systems, LNCS Vol. 4053, pp. 513–524, Springer-Verlag.
- Garcia, P., Amandi, A., Schiaffino, S. and Campo, M. (2006). Evaluating Bayesian networks' precision for detecting students' learning styles. Computers and Education, in press.
- 1Graf, S. and Kinshuk (2006) An Approach for detecting Learning Styles in Learning Management Systems. In Proceedings of ICALT 2006, 6th IEEE Int. Conf. on Advanced Learning Technologies (ICALT 2006), IEEE Press, Los Alamitos, pp. 161–163.
- Carver, C. A., Howard, R. A. and Lane, W. D (1999). Enhancing Student Learning Through Hypermedia Courseware and Incorporation of Student Learning Styles, IEEE Transactions on Education, vol. 42, no. 1, 1999, pp. 33-38.
- Gilbert, J. E. and Han C. Y. (1999). Arthur: Adapting Instruction to Accommodate Learning Style. Proceedings ofWebNetʹ99, World Conference of the WWW and Internet, Honolulu, HI, 433-438.
- Specht, M. and Oppermann, R. (1998). ACE - Adaptive Courseware Environment. The New Review of Hypermedia and Multimedia 4, 141-161.
- Bajraktarevic, N., Hall, W., & Fullick, P. (2003).Incorporating learning styles in hypermedia environment: Empirical evaluation. In P. de Bra, H. C. Davis, J. Kay & M. Schraefel (Eds.), Proceedings of the Workshop on Adaptive Hypermedia and Adaptive Web-Based Systems (pp. 41–52). Nottingham, UK.
- Wolf, C. (2003). Towards `Learning Style'-Based E-Learning in Computer Science Education.In Proceedings of the Australasian Computing Education Conference.Adelaide, Australia, pp. 273-279.
- Papanikolaou K, Grigoriadou M, Kornilakis H and Magoulas G D (2003) Personalising the interaction in a Web-based educational hypermedia system: the case of INSPIRE User-Modeling and User-Adapted Interaction, forthcoming.
- Peña, C.,I. (2004). Intelligent Agents to Improve Adaptivity in a Web-Based Learning Environment.University of Girona.
- Peña,C.I, J.L. Marzo. and J.L. de la Rosa (2002). "Intelligent agents in a teaching and learning environment on the web", IEEE International Conference on Advanced Learning Technologies (ICALT 2002).Kazan, Russia.
- Kelly, D. (2005). On the dynamic multiple intelligence informed personalization of the learning environment. University of Dublin, TrinityFaculty, Dublin.
- Paredes, P. and Rodriguez, P. (2004) A Mixed Approach toModelling Styles in Adaptive Educational Hypermedia, Advanced Technolo.gy for Learning.
- Aljojo, N. (2012) Teacher Assisting and Subject Adaptive Material system: An Arabic Adaptive Learning Environment. University o f Portsmouth, Portsmouth.
- Felder, R. M. & Silverman, L. K. (1988). Learning Styles and Teaching Styles in Engineering Education, Engr. Education, 78(7), 674-681.
- Felder, R. M. (1993). Reaching the Second Tier: Learning and Teaching Styles in Faculty Science Education, J. Coll. Sci. Teaching, 23, 5, 286-290.
- Viola, S., Graf, S, R., Kinshuk and Leo T. (2007). Investigating relationships within the Indexof Learning Styles: a data driven approach, Interactive Technology & Smart Education, pp. 7-18.
- Santhi, C, J. G. Arnold, J. R. Williams, W. A. Dugas, R. Srinivasan,and L. M. Hauck. (2001). Validation of the SWAT model on alarge river basin with point and nonpoint sources. J. AmericanWater Resources Assoc. 37(5): 1169-1188.
- Van Liew, M. W., J. G. Arnold, and J. D. Garbrecht. (2003). Hydrologicsimulation on agricultural watersheds: Choosing betweentwo models. Trans. ASAE 46(6): 1539-1551.
- Legates, D. R., and G. J. McCabe. 1999. Evaluating the use of "goodness-of-fit" measures in hydrologic and hydroclimatic model validation. Water Resources Res. 35(1): 233-241.
- Aitchison, J. (1986) The Statistical Analysis of Compositional Data. Chapman and Hall, London.
- Abdi H., Dominique V (2007) Multiple Correspondence Analysis. Neil Salkind (Ed.). Encyclopedia of Measurement and Statistics. Thousand Oaks (CA): Sage.
- Warwick, K. M., & Morineau, A. (1984). Multivariate descriptive statistical analysis. John Wiley & Sons, Inc.
- Greenacre, M.J (1984). Theory and Applications of Correspondence Analysis, Academic Press, New York, 1984.
- Felder, R.M. and J. Spurlin. (2005). "Reliability and Validity of the Index of Learning Styles: a Meta-analysis." International Journal of Engineering Education. 21(1), 103–112.
- Zywno, M. S. (2003) A Contribution to Validation of Score Meaning for Felder-Soloman's Index of Learning Styles. In Proceedings of the 2003 AmericanSociety for Engineering Annual Conference and Exposition. Available online at http://www.ncsu.edu/felder-public/ILSdir/Zywno _Validation_Study.pdf (retrieved October, 2006).
- Litzinger, T. A., Lee, S. H., and Wise, J. C. (2005) AStudy of the Reliability and Validity of the Felder-Solomon Index of Learning Styles. In Proceedings of the2005 American Society for Engineering Annual Conferenceand Exposition. Available at http://www.ncsu.edu/felder-public/ILSdir/Litzinger_Validation_Study.pdf (retrieved October, 2006).
- Livesay, G., Dee, K., Felder, R., Hites, L., Nauman, E. & O'Neal, E., Statistical Evaluation of the Index of Learning Styles, Session 2430, 2002 ASEE Annual Conference and Exposition, Montreal, Quebec, Canada, (2002).
