An Empirical Predictive Model for Formation Rate of the Day 5 Blastocyst

Author: Xi Wang, Zhongqiang Liu
Journal: International Journal of Mathematical Sciences and Computing @ijmsc
Article in issue: 2 vol.9, 2023.
Free access
Day 5 (D5) blastocyst transfers present higher clinical pregnancy and live birth rates than day 6 in both fresh and frozen transfers [1]. To investigate the D5 blastocyst formation rate, in this study, we first collected clinical data from a hospital in Jiaozuo and partitioned the data into training set and validation set. We conducted univariate logistic regression analyses, which were possible predictors of the D5 blastocyst formation rate, on 12 patient covariates. According to the univariate analysis, we determined 10 covariates were suitable for multivariate analysis. Finally, we identified five covariates to construct a logistic regression model to predict the D5 blastocyst formation rate. We also used the receiver operating characteristic curve, the Hosmer–Lemeshow test, and the calibration curve to verify the accuracy of this model. The results showed that logistic regression model of D5 blastocyst formation rate directly reflected the relationship between transplantation results and covariates. According to the model, doctors can provide guidance to patients before treatment and improve the rate of blastocyst formation by changing patients' physical fitness. The model has certain clinical application value.
Day 5 blastocyst, Nomogram, Logistic regression, Hosmer-Lemeshow test
Short address: https://sciup.org/15019050
IDR: 15019050 | DOI: 10.5815/ijmsc.2023.02.03
Text of the scientific article An Empirical Predictive Model for Formation Rate of the Day 5 Blastocyst
With the advancement of assisted reproductive technology, traditional assisted reproductive transfer of two to three blastocysts can lead to multiple pregnancies [2,3]. The American Academy of Reproductive Medicine, however, has proposed that multiple pregnancies can cause pregnancy-related complications and adverse pregnancy for patients [4]. Studies have shown that multiple pregnancies increase the incidence of maternal and infant complications, which include preterm birth, intrauterine growth restriction, cerebral palsy, learning cognitive impairment, and developmental delay. In 1998, some scholars proposed that the most effective treatment method to reduce the multiple birth rate is single-embryo transfer [5]. With the advancement of medical technology, experts have gradually carried out singleblastocyst transfer to clinical practice to reduce multiple pregnancies during assisted reproduction. European agency pioneered single-blastocyst transfer and applied this method of clinical treatment. Researchers analyzed the data and found no difference in pregnancy rates for single-embryo transfer and twin-embryo transfer among infertile patients. Single-embryo transfer, however, could significantly reduce the multiple pregnancy rate [6,7].
At present, many hospitals use single-blastocyst transfer to reduce the occurrence of multiple pregnancies on the basis of ensuring the clinical pregnancy rate [8]. With the mature application of blastocyst vitrification technology, blastocyst transfer from patients with a resuscitation cycle can reduce the impact on ovulation-inducing drugs on the body’s energy and endometrial effects [9]. Experiments have shown that frozen single-blastocyst transfer resulted in a higher singleton live birth rate than did fresh single-blastocyst transfer in ovulatory women with good prognosis [10].
To improve the clinical pregnancy rate, blastocyst transfer in a resuscitation cycle can be used to screen cultured blastocysts with better developmental potential. Resuscitation-cycle blastocyst transfer can be used to transfer blastocysts to increase the pregnancy rate and reduce the multiple pregnancy rate, to a certain extent. The key to improving the therapeutic effect of clinical treatment is to ensure that the cultured blastocysts can be formed and the clinical pregnancy rate can be guaranteed. Pregnancy with embryo freezing and thawing was first reported in 1983 [11]. Subsequently, in 1994, Wang et al. made a reliable evaluation of the survival rate and conception rate of frozen embryos [12]. In the early 21st century, embryo-freezing technology developed rapidly.
Previous studies have found that blastocysts developed on day 5 (D5) in the medium have a higher implantation rate (implantation rate is determined by fetal heart and ongoing pregnancy rate) than blastocysts developed on day 3. The implantation rate of blastocysts transferred at the blastocyst developmental stage was twice that observed in blastocysts transferred at day 3 [13]. Therefore, our study of D5 blastocyst holds greater practical significance. In this study, we used a training set to establish a logistic regression model for the formation of D5 blastocysts, and applied this data to the validation set to test the accuracy of the model. Doctors use models to estimate treatment outcomes and inform patients of expected treatment outcomes for patients undergoing single-blastocyst transfer. In this way, patients can better accept blastocyst transfer and cooperate with clinical treatment. Single-blastocyst transfer also can reduce the rate of multiple pregnancies and related complications.
Through prediction model, doctors can estimate the probability of successful pregnancy according to a patient’s specific situation and can better carry out in vitro fertilization (IVF) consultation. Patients also have certain psychological expectations for the results of treatment. However, most of the existing models are predictive models of blastocyst transfer results. To our knowledge, no predictive model for blastocyst formation outcome of the recovery cycle has been found. Our logistic model mainly aims to understand the relationship between patients' own physical conditions and blastocyst formation, and show the final result in the form of the nomogram.
2. Literature Review
In 2013, van Loendersloot et al. proposed a predictive model of in vitro fertilization [14]. This was the first model in history to predict assisted reproductive success, but the covariates included in the model were not perfect. In 2015, Dhillon et al. used logistic regression to obtain pretreatment factors, such as female body mass index (BMI), race, and ovarian reserve, and determined that these factors were the keys to the success of assisted conception [15]. In 2016, Sarais et al. performed external validation of van Loendersloot’s predictive model [16]. They verified whether the model performed consistently across different geographic and cultural contexts. In the same year, Hafiz et al. used the receiver operating characteristic curve (ROC) and area under the curve (AUC) to verify that women older than 38 have a low probability of pregnancy through blastocyst transfer [17]. In 2019, Blank et al. used the random forest model to predict the implantation potential of blastocysts for the first time [18].
3. The predictive model for D5 blastocyst formation 3.1. Data Sources
We first collected the clinical data on patients undergoing assisted reproductive treatment in a hospital in Jiaozuo from 2019 to 2021. To avoid statistical bias, we screened 1732 data eligible for single-blastocyst transfer. We permuted these data and selected the first 1386 patients as the training set and the last 346 patients as the validation set. To ensure that the model had a certain degree of rationality, we selected patient physical examination indicators as covariates of the model. Selection criteria were based on the literature [19] and clinical knowledge. The possible predictors of the model included age, BMI, cause of infertility, duration of infertility, treatment solutions, follicle stimulating hormone (FSH), anti-Müllerian hormone (AMH), gonadotropin (Gn) usage, follicle formation, and fertilization method.
To describe and analyze covariates conveniently, we divided them into quantitative data and qualitative data. Covariates such as age, duration of infertility, and number of hormone doses, were called quantitative data, and covariates, such as cause of infertility, D5 blastocyst and formation outcome, were called qualitative data. For quantitative data, we used mean ± standard to represent within-group data characteristics. The data characteristics are shown in Table 1.
Table 1. Training set and validation set clinical data
|
Index |
Training set (n=1386) |
validation set (n=346) |
|
woman's age (year) |
30.30±4.30 |
30.50±4.29 |
|
20-34years [ n (%)] |
1184(85.43) |
289(83.53) |
|
35-39years [ n (%)] |
147(10.61) |
44(12.72) |
|
>40years [ n (%)] |
55(3.96) |
13(3.75) |
|
man's age (year) |
31.35±4.54 |
31.40±4.60 |
|
20-34years [ n (%)] |
1125(81.17) |
281(81.21) |
|
35-39years [ n (%)] |
180(12.99) |
42(12.14) |
|
>40years [ n (%)] |
81(5.84) |
23(6.65) |
|
cause of infertility |
||
|
Primary infertility [ n (%)] |
720(51.95) |
175(50.58) |
|
Secondary infertility [ n (%)] |
666(48.05) |
171(49.42) |
|
Duration of infertility (year) |
3.57±2.70 |
3.65±2.75 |
|
0-4.25 [ n (%)] 4.26-10.25 [ n (%)] >10.25 [ n (%)] |
990(71.43) 355(25.61) 41(2.96) |
239(69.08) 97(28.03) 10(2.89) |
|
treatment solutions |
||
|
Down regulation [ n (%)] |
986(71.14) |
251(72.54) |
|
Non-down regulation [ n (%)] |
400(28.86) |
95(27.46) |
|
BMI (kg/m2) |
24.17±3.84 |
24.24±4.08 |
|
0-24 [ n (%0)] |
738(53.25) |
183(52.89) |
|
24-27.99 [ n (%)] |
426(30.74) |
101(29.19) |
|
>27.99 [ n (%)] |
222(16.01) |
62(17.92) |
|
FSH (U/L) |
6.52±1.90 |
6.41±1.86 |
|
<10 [ n (%)] |
1325(95.60) |
337(97.40) |
|
10 [ n (%)] |
61(4.40) |
9(2.60) |
|
AMH (ng/ml) |
4.45±3.48 |
4.30±3.21 |
|
0-2 [ n (%)] |
311(22.44) |
77(22.25) |
|
2-6.8 [ n (%)] |
851(61.40) |
209(60.40) |
|
>6.8 [ n (%)] |
224(16.16) |
60(17.35) |
|
Total dose of Gn (IU) |
2743.69±1072.43 |
2897.58±1187.86 |
|
0-1200 [ n (%)] |
28(2.02) |
10(2.89) |
|
1200-2400 [ n (%)] |
626(45.17) |
128(36.99) |
|
2400-3600 [ n (%)] |
472(34.05) |
120(34.68) |
|
>3600 [ n (%)] |
260(18.76) |
88(25.43) |
|
Use Gn days (day) |
11.30±2.26 |
11.55±2.63 |
|
0-8 [ n (%)] |
149(10.75) |
34(9.83) |
|
8-11 [ n (%)] |
566(40.84) |
139(40.17) |
|
11-14 [ n (%)] |
591(42.64) |
143(41.33) |
|
>14 [ n (%)] |
80(5.77) |
30(8.67) |
|
Number of oocytes |
11.57±6.35 |
11.31±5.92 |
|
0-10 [ n (%)] |
608(43.87) |
159(45.95) |
|
10-15 [ n (%)] |
466(33.62) |
114(32.95) |
|
>15 [ n (%)] |
312(22.51) |
73(21.10) |
|
Number of cultured blastocysts |
4.98±3.64 |
5.14±3.57 |
|
0-10 [ n (%)] |
1243(89.68) |
306(88.44) |
|
10-20 [ n (%)] |
135(9.74) |
38(10.98) |
|
>20 [ n (%)] |
8(0.58) |
2(0.58) |
|
D5 blastocyst formation |
||
|
Not formed [ n (%)] |
640(46.18) |
158(45.66) |
|
Formed [ n (%)] |
746(53.82) |
188(54.34) |
3.2. Statistical method
3.3. Model validation
4. Results
4.1. Model construction
Considering the correlation between covariates and the large number of candidate covariates, we used the stepwise method of logistic regression to screen covariates. logistic regression model has high computational efficiency and accurate prediction results, and the drawing of the nomogram is also based on logistic regression model.
When building the prediction model, we used logistic univariate to analyze the effects of each covariate on blastocyst formation outcome and calculated their odd ratio (OR) and p-values. We used these two values to judge the effect of each covariate on the outcome of D5 blastocyst formation. To obtain the best regression equation, we left the covariate with a significant effect in the regression equation and selected the next covariate based on this criterion. We selected significant covariates ( p < 0.05 ) for logistic multivariate analysis. Because of the large number of covariates, the model obtained by screening covariates in this way was more convincing. Among these covariates, we used the “glm” function in R software to calculate logistic univariate analysis and multivariate analysis. Finally, we used the survival package and the “rms” package in R software to build the model.
Our validation set verified that the model's predictions were as good as we expected. We evaluated and calibrated models using ROC, the Hosmer–Lemeshow test, and calibration curves. We plotted the ROC and calculated the AUC using the ROCR package in R software. ROC is a coordinate graph consisting of false alarm probability as horizontal axis and hit probability as vertical axis. And the curves drawn by the subjects under certain stimulus conditions due to the use of different criteria. We used the AUC to judge the fit of the model. Because our data contained continuous covariates, we selected the Hosmer–Lemeshow goodness-of-fit test and calibration curve to evaluate the model and followed a detailed process to validate the results. The Hosmer-Lemeshow test and calibration curve is the model fitting index, and its principle is to judge the predicted value and the real value.
All statistical analyses were performed using the R(ver.4.1.2). A value of p < 0.05 was considered significant.
We considered the interactions between covariates and used the one-to-one approach to analyze the effect of individual covariates on the outcome of D5 blastocyst formation. We performed logistic univariate regression on the training set and found that male age, female age, cause of infertility, duration of infertility, treatment solutions, FSH dosage, AMH dosage, total Gn dosage, number of oocytes, and method of fertilization were important factors for the formation of D5 blastocysts (Table 2.). We then selected the filtered covariates for logistic multivariate regression. This method not only considered the interaction between covariates but also ensured the accuracy of the model. The results showed that female age, duration of infertility, AMH dosage, number of oocytes, and method of fertilization were important covariates affecting D5 blastocyst formation (Table 3.). We were able to build the desired model using just these five covariates. The logistic regression model of the D5 blastocyst formation outcome and the five covariates follows:
L ( p ) = - 2.0010 - 0.0033 x - 0.4140 x 2 + 0.0478 x 3 + 0.1295 x 4 + 0.8967 x5 (1)
(Remark: x is the female age, x is the duration of infertility, x is the AMH, x is the number of oocytes, x is the fertilization method.)
Finally, built the model with the help of R software (Fig.1.). The nomogram was similar to the scoring system, with a score for each covariate. The size of the score was related to its own influencing factors.
Table 2. Logistic regression univariate results in the training set
|
Index |
Univariate analysis |
|
|
OR (95%CI) |
P-value |
|
|
woman's age (year) 20-34years [ n (%)] |
4.5444(2.4487-9.0941) |
<0.0001 |
|
35-39years [ n (%)] |
3.4400(1.7237-7.3049) |
0.0007 |
|
>40years [ n (%)] |
Reference |
|
|
man's age (year) 20-34years [ n (%)] |
1.9660(1.2442-3.1530) |
0.0042 |
|
35-39years [ n (%)] |
1.8850(1.1087~3.2427) |
0.0203 |
|
>40years [ n (%)] |
Reference |
|
|
cause of infertility Primary infertility [ n (%)] |
1.2398(1.0034~1.5323) |
0.0465 |
|
Secondary infertility [ n (%)] |
Reference |
|
|
Duration of infertility (year) 0-4.25 [ n (%)] |
2.5515(1.2936~5.3140) |
0.0087 |
|
4.26-10.25 [ n (%)] |
2.3162(1.1509~4.9087) |
0.0220 |
|
>10.25 [ n (%)] |
Reference |
|
|
treatment solutions Down regulation [ n (%)] |
Reference |
|
|
Non-down regulation [ n (%)] |
0.5415(0.4277~0.6844) |
<0.0001 |
|
BMI (kg/m2) 0-24 [ n (%)] |
Reference |
|
|
24-27.99 [ n (%)] |
1.1734(0.9237~1.4919) |
0.1910 |
|
>27.99 [ n (%)] |
1.1945(0.8839~1.6178) |
0.2490 |
|
FSH (U/L) <10 [ n (%)] |
Reference |
|
|
10 [ n (%)] |
0.4683(0.2705~0.7910) |
0.0053 |
|
AMH (ng/ml) 0-2 [ n (%)] |
Reference |
|
|
2-6.8 [ n (%)] |
2.5875(1.9761~3.4044) |
<0.0001 |
|
>6.8 [ n (%)] |
5.0865(3.5135~7.4373) |
<0.0001 |
|
Total dose of Gn (IU) 0-1200 [ n (%)] |
Reference |
|
|
1200-2400 [ n (%)] |
0.4255(0.1656~0.9694) |
0.0542 |
|
2400-3600 [ n (%)] |
0.3628(0.1407~0.8307) |
0.0230 |
|
>3600 [ n (%)] |
0.3232(0.1237~0.7524) |
0.0128 |
|
Use Gn days (day) 0-8 [ n (%)] |
0.4733(0.2707~0.8194) |
0.0080 |
|
8-11 [ n (%)] |
0.7071(0.4370~1.1326) |
0.1524 |
|
11-14 [ n (%)] |
1.0562(0.6528~1.6918) |
0.8215 |
|
>14 [ n (%)] |
Reference |
Number of oocytes
|
0-10 [ n (%)] |
Reference |
|
|
10-15 [ n (%)] |
2.5350(1.9808~3.2518) |
<0.0001 |
|
>15 [ n (%)] |
6.1513(4.5102~8.4785) |
<0.0001 |
|
Fertilization method |
||
|
0 [ n (%)] |
Reference |
|
|
1 [ n (%)] |
2.3641(1.7575-3.1995) |
<0.0001 |
|
Table 3. Logistic regression multivariate analysis results in the training set |
||
|
multivariate analysis |
||
|
OR (95%CI) |
P-value |
|
|
woman's age (year) |
||
|
20-34years [ n (%)] |
3.4098(1.4848~8.3023) |
0.0050 |
|
35-39years [ n (%)] |
3.5316(1.5685~8.4059) |
0.0031 |
|
>40years [ n (%)] |
Reference |
|
|
man's age (year) |
||
|
20-34years [ n (%)] |
0.6315(0.3171~1.2374) |
0.1841 |
|
35-39years [ n (%)] |
0.8898(0.4505~1.7394) |
0.7339 |
|
>40years [ n (%)] |
Reference |
|
|
cause of infertility |
||
|
Primary infertility [ n (%)] |
1.0144(0.7957~1.2924) |
0.9082 |
|
Secondary infertility [ n (%)] |
Reference |
|
|
Duration of infertility (year) |
||
|
0-4.25 [ n (%)] |
3.0615(1.3814-7.0973) |
0.0070 |
|
4.26-10.25 [ n (%)] |
2.7808(1.2394-6.5170) |
0.0151 |
|
>10.25 [ n (%)] |
Reference |
|
|
treatment solutions |
||
|
Down regulation [ n (%)] |
Reference |
|
|
Non-down regulation [ n (%)] |
0.9256(0.6832~1.2560) |
0.6185 |
|
FSH (U/L) |
||
|
<10 [ n (%)] |
Reference |
|
|
10 [ n (%)] |
0.8863(0.4853-1.5935) |
0.6894 |
|
AMH (ng/ml) |
||
|
0-2 [ n (%)] |
Reference |
|
|
2-6.8 [ n (%)] |
1.4730(1.0590~2.0528) |
0.0217 |
|
>6.8 [ n (%)] |
2.2517(1.4228~3.5823) |
0.0006 |
|
Use Gn days (day) |
||
|
0-8 [ n (%)] |
0.7646(0.2708-1.9476) |
0.5896 |
|
8-11 [ n (%)] |
0.7646(0.2746-2.0547) |
0.6399 |
|
11-14 [ n (%)] |
0.7646(0.2693-2.1152) |
0.6505 |
|
>14 [ n (%)] |
Reference |
|
|
Number of oocytes |
||
|
0-10 [ n (%)] |
Reference |
|
|
10-15 [ n (%)] |
1.9951(1.5049~2.6503) |
<0.0001 |
|
>15 [ n (%)] |
4.8003(3.3541~6.9343) |
<0.0001 |
|
Fertilization method |
||
|
0 [ n (%)] |
Reference |
|
|
1 [ n (%)] |
2.5803(1.8686-3.5867) |
<0.0001 |
|
0 10 |
20 30 40 50 60 70 80 90 |
100 |
|
19'35 |
||
|
female age ।----------- |
----------------------------------------------------------------------------------1-------------------------------1 |
|
|
>39 |
34'40 |
|
|
4 26-10.5 |
||
|
duration of infertility ।-------------- |
------------------------------------------------------------------------------------------------------------------------------------------------------------------------------1---------------- |
|
|
>10,5 |
0'4 25 |
|
|
2'6 8 |
||
|
АМН ।--------- |
--------------------------------------1----------------------------------------------------------------------------------------------------------1 |
|
|
<2 |
>6.8 |
|
|
10'15 |
||
|
number of oocytes ■---------- |
---------------------------------------------------------------------------------------------------------------------------1------------------------------------------------------------------------------------------------------------------------------------------------------------------------------------------------------------ |
|
|
<10 |
>15 |
|
|
natural fertilization |
||
|
fertilization method r------------ |
---------------------------------------------------------------------------------------------------------------------------------------------------------------------------------1 |
|
|
artificial insemination |
||
|
Total Points ....... |
-i—>—।— ..........—। ।। । ......... |
------! |
|
0 50 |
100 150 200 250 300 350 |
400 |
|
D5 blastocyst formation |
0 1 02 0.3 0.4 05 06 0.7 0.8 0.9 |
|
Fig. 1. Nomogram.
If a patient is using this model for prediction, the scores to be calculated should correspond to the patient’s indicators. Then, all of the scores should be added. Finally, after comparing the probability of the total score table, the probability obtained by this simple calculation should be the probability of D5 blastocyst formation. Each patient then can decide probabilistically whether or not to pursue treatment, thus providing a reasonable prediction.
-
4.2. Model validation
We used three methods to validate and calibrate the model. According to the screened covariates, we drew ROC plots for the data of the training set and the data of the validation set (Fig.2., Fig.3.). We calculated that the AUC of the test and validation sets were 0.7291 and 0.7688, respectively. In general, when the AUC was greater than 0.6, we considered the model to be well fitted.
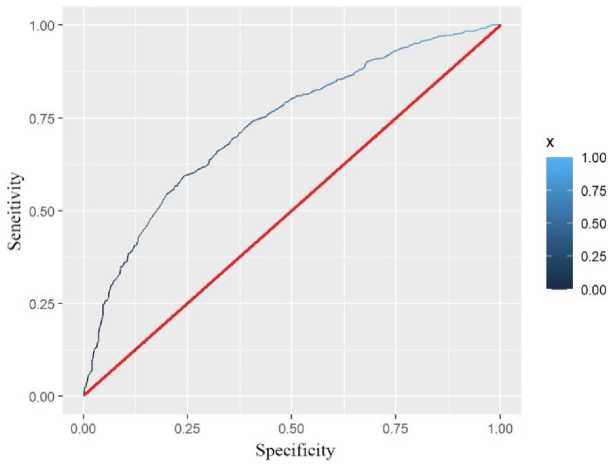
Fig. 2. Training set ROC.
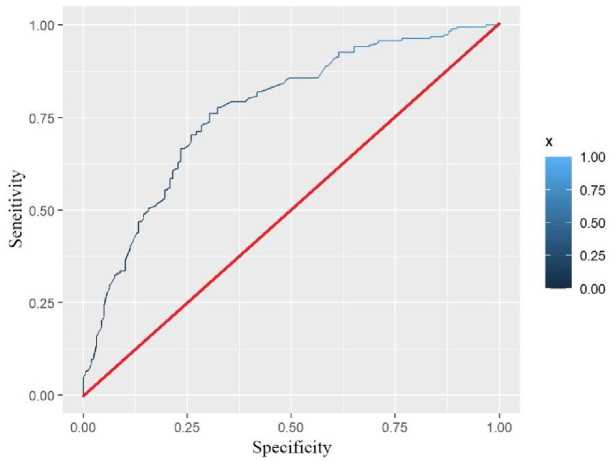
Fig. 3. Validation set ROC.
We used the Hosmer–Lemeshow goodness-of-fit test to assess the calibration ability of the predictive models. We started the test by substituting the validation set data onto the model. Then we sorted the predicted probabilities from small to large and divided them into 10 groups. By plotting their values in a histogram, we were able to compare the predicted probability with the actual probability value more intuitively (Fig.4.). The figure shows that there was little difference between each group, which also could be calculated by R software to obtain p ≥ 0.05 . The result showed that the predicted probability of the model and the actual observed probability were not statistically different.
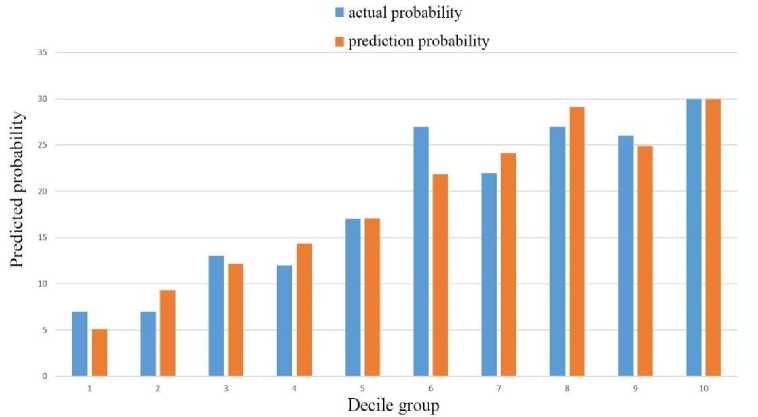
Fig. 4. The relationship between predicted and actual probabilities of nomograms.
The calibration curve tells us that both the predicted value curve and the actual value curve are close to the diagonal (Fig.5.), indicating that the model fit was good.
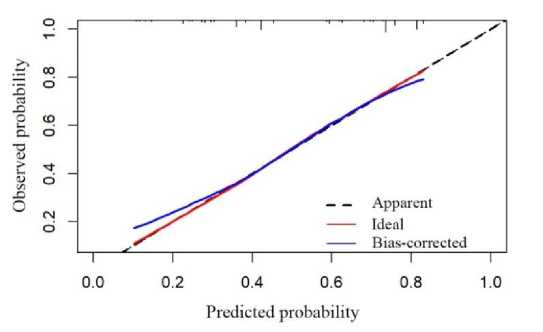
Fig. 5. Calibration curve.
4.3. Discussion
5. Conclusions
This model used logistic regression analysis to screen for five covariates, including female age, duration of infertility, AMH, number of oocytes, and fertilization method. Because ovarian function and endometrial receptivity decline with age [20], a woman’s age and years of infertility are recognized factors that affect pregnancy rates. From the data, we found that the D5 blastocyst formation rate was slightly lower in patients with secondary infertility than in patients with primary infertility. We speculated that the main reason for this difference is that after China began to encourage the birth of a second child, the number of elderly women with reproductive needs who were infertile for a long time increased. Taking advantage of assisted reproductive technology to conceive [21], these women have opted for single-blastocyst transfer to avoid a multiple pregnancy. A large number of studies have shown that AMH has a certain correlation between pregnancy outcomes and that its index size is directly related to clinical pregnancy and live birth rates. Xiao et al. found that AMH was positively correlated with the number of oocytes, the fertilization rate, and the number of blastocysts transfer [22]. Substantial clinical trial evidence has indicated that AMH levels have a strong predictive value of ovarian reserve and ovarian responsiveness [23], and moderate predictive value of in vitro fertilization [24,25]. These covariances all performed the same way in our model, which indicated that our model aligned with the clinical trial results.
Based on clinical data, we developed and validated a predictive model for D5 blastocyst formation outcomes by logistic regression. In addition, the AUC of the model in this study was 0.7688, which could effectively predict the treatment effect. Our logistic regression model was different from published assisted reproductive clinical models at this stage. It was specifically designed to predict D5 blastocyst formation results and directly displayed the results of the nomogram. Doctors could easily and quickly calculate the success rate of treatment by combining the patient’s physical conditions with graphics. This approach was more intuitive and practical than previous models. Using this model, doctors can help patients reduce psychological pressure according to psychological expectations, better perform single blastocyst transfer, and reduce the incidence of multiple pregnancy and ectopic pregnancy.
Predicting the probability of blastocyst formation in an assisted reproductive treatment cycle is a common problem faced by reproductive medicine scientists. Pregnancy rate also has an important relationship with blastocyst formation. Blastocyst formation is related to many complex factors, most of which are unknown or cyclical. We used a logistic regression model to predict the probability of D5 blastocyst formation during single-blastocyst transfer in a resuscitation cycle. This work represented an attempt in the field of assisted reproduction clinical prediction models. The covariates included in the model can be collected conveniently and accurately; however, the model lacked valid external validation and data collection may not be complete. Important predictors, such as smoking and drinking status, were not included in the covariates. In addition, male infertility factors, such as obstructive azoospermia and oligoasthenozoospermia, could achieve higher pregnancy rates with the help of intracytoplasmic sperm injection technology, but the impact on sperm factors of the outcome of D5 blastocysts cannot be ignored. In future studies, more covariates will be added to this prediction model. We also need to combine multiple regions to develop more comprehensive predictive models. From a clinical and economic perspective, we should avoid wasting resources to a certain extent.
Acknowledgment
We thank LetPub ( for its linguistic assistance during the preparation of this manuscript.
References An Empirical Predictive Model for Formation Rate of the Day 5 Blastocyst
- M. Bourdon and K. Pocate-Cheriet, “Day 5 versus Day 6 blastocyst transfers: a systematic review and meta-analysis of clinical outcomes”, Human Reproduction. (2019), 34(10), 1948-1964.
- A. D. Kulkarni, D. J. Jamieson and H. W. Jones, “Fertility Treatments and Multiple Births in the United State.”, New England Journal of Medicine. (2013), 369(23), 2218-2225.
- I. Scholten,G. M. Chambers and L Van Loendersloot, “Impact of assisted reproductive technology on the incidence ofmultiple-gestation infants: apopulation perspective.”, Fertility and Sterility. (2015), 103(1), 179-183.
- J. Qin and H. Wang Van, “Pregnancy-related complications and adverse pregnancy outcomes in multiple pregnancies resulting from assisted reproductive technology: a meta-analysis of cohort studies.”, Fertility and Sterility. (2015), 103(6), 1492-1508.
- T. Coetsier and M. Dhont, “Avoiding multiple pregnancies in in-vitro fertilization: who's afraid of single embryo transfer?”, Human Reproduction. (1998), 13, 2663-2664.
- R. Z. Karaki, S. S. Samarraie and N. A. Younis, “Blastocyst culture and transfer: a step toward improved in vitro fertilization outcome.”, Fertility and Sterility. (2002), 77(1), 114-118.
- C. Serdar, H. Johannes, “Day 5 versus day 3 embryo transfer: a controlled randomized trial.”, Human Reproduction. (2000), 9, 1947-1952.
- M. Henman and J. W. Catt, “Elective transfer of single fresh blastocysts and later transfer of cryostored blastocysts reduces the twin pregnancy rate and can improve the in vitro fertilization live birth rate in younger women.”, Digest of the World Core Medical Journals. (2006), 84(6), 1620-1627.
- D. Wei, Y. Sun, “single blastocyst transfer (Frefro-blastocyst): study protocol for a randomized controlled trial.”, Trials. (2017), 18(1), 1-7.
- D. Wei, J. Y. Liu and Y. Sun, “Frozen versus fresh single blastocyst transfer in ovulatory women: a multicentre, randomised controlled trial.”, The Lancet. (2019), 393, 1310-1318.
- A. Trounson, L. Mohr, “Human pregnancy following cryopreservation, thawing and transfer of an eight-cell embryo.”, Nature. (1983), 305(5936), 707.
- X. J. Wang and W. Ledger, “The contribution of embryo cryopreservation to in-vitro fertilization/gamete intra-fallopian transfer: 8 years’ experience.”, Human reproduction. (1994), 9, 103-109.
- D. Gardner, “Culture and transfer of human blastocysts increases implantation rates and reduces the need for multiple embryo transfers.”, Fertility and sterility. (1998), 69.
- L. L. Loendersloot ang M. Wely, “Individualized decision-making in IVF: calculating the chances of pregnancy.”, Human reproduction. (2013), 11, 2972-2980.
- R. K. Dhillon and D. J. McLernon, “Predicting the chance of live birth for women undergoing IVF: a novel pretreatment counselling tool.”, Human reproduction. (2015), 1, 84.
- S. Veronica and R. Marco, “Predicting the success of IVF: external validation of the van Loendersloot's model.”, Human reproduction. (2016), 6, 1245.
- P. Hafiz and M. Nematollahi, “Predicting Implantation Outcome of In Vitro Fertilization and Intracytoplasmic Sperm Injection Using Data Mining Techniques.”, International journal of fertility & sterility. (2017), 11(3), 184-190.
- C. Blank and R. R. Wildeboer, “Prediction of implantation after blastocyst transfer in in vitro fertilization: a machine-learning perspective.”, Fertility and Sterility. (2019), 111(2), 318-326.
- L. L. Loendersloot ang M. Wely, “Predictive factors in in vitro fertilization (IVF): a systematic review and meta-analysis.”, Human reproduction update. (2010), 16(6), 577-589.
- X. H. Deng ang Y. Z. Xu, “Fertility evaluation and assisted reproduction in elder women.”, Journal of Shandong University: Medical Edition. (2017), 55(1), 5-10.
- Z. J. Chen, “Clinical concern of the second pregnancy under the two-child policy.”, Journal of Shandong University: Medical Edition. (2017), 55(1), 1-4.
- J. X. Xiao, “Study on the correlation between anti-Müllerian hormone and pregnancy outcome of controlled ovarian hyperstimulation.”, China Maternal and Child Health. (2016), 31(19), 4010-4013.
- S. L. Broer, “Added value of ovarian reserve testing on patient characteristics in the prediction of ovarian response and ongoing pregnancy: an individual patient data approach.”, Human Reproduction Update. (2013), 19(1), 26-36.
- S. E. Alson, “Anti-müllerian hormone levels are associated with live birth rates in ART, but the predictive ability of anti-müllerian hormone is modest.”, Eur J Obstet Gynecol Reprod Biol. (2018), 19(1), 26-36.
- M. D. Reshef Tal, “Antimüllerian hormone as a predictor of live birth following assisted reproduction: an analysis of 85,062 fresh and thawed cycles from the Society for Assisted Reproductive Technology Clinic Outcome Reporting System database for 2012-2013.”, Fertility and sterility. (2018), 109(2), 258-265.
