An Enhanced Feature Extraction Technique for Diagnosis of Pathological Problems in Mango Crop

Author: S. B. Ullagaddi, S.Viswanadha Raju
Journal: International Journal of Image, Graphics and Signal Processing(IJIGSP) @ijigsp
Article in issue: 9 vol.9, 2017.
Free access
Lack of apparent shape and texture features in disease recognition (Powdery Mildew and Anthracnose) of crop is a key challenge of Agriculture domain in the last few decades. The various soft computing techniques exists in computer vision system still there is need of most efficient methods to meet accuracy. In this work An enhanced Wavelet-PCA based Statistical Feature Extraction technique along with Modified Rotation Kernel Transformation (MRKT) based directional features is proposed in order to address the issues arising in different methodologies for plant disease recognition. This enhanced scheme extracts twenty wavelet features in addition to twelve direction features for different plant parts mango flower, fruit and leaf. This research work is an extended part presents in reference 1 by the authors. The feature set of total 32 features is used to train with Artificial Neural Network to diagnose both Powdery Mildew and Anthracnose disease which occur in the form of Fungus and black spots respectively on different parts of mango plant. The results obtained are found with accuracy of 98.50%, 98.75%, and 98.70% respectively for flower, fruit and leaf .
Wavelets, Principal Component Analysis (PCA), Statistical Features, Powdery Mildew, Anthracnose, Neural Network, Mean Square Error (MSE)
Short address: https://sciup.org/15014227
IDR: 15014227
Text of the scientific article An Enhanced Feature Extraction Technique for Diagnosis of Pathological Problems in Mango Crop
Published Online September 2017 in MECS
India is a seventh largest economic country in the world with the highest GDP growth rate currently. The long-run development prospect of an Indian economy is highly encouraging because of its young population, equivalent low relience ratio, rate of investments, admirable savings and escalating integration with global economy. The backbone of an Indian economy is agriculture which largely depends on the crops grown here in different seasons throughout the year. Diversity in crops like fruits, horticulture, vegetables, grams etc. is also a great factor in agriculture dependent economy. India is ranking second in world in outcomes of Agriculture and associated areas like horticulture, fishing, forestry and logging are responsible for 17% of the GDP and providing employment around 49% of the total labor force reported in 2014.Use of modern machines and technology have greatly improved the production and quality of crops. In every crop cycle the management of recurrent fruit crops are also important for yield in farms. There is a need of great attention predominantly to monitor the diseases which are going to affect the production severely. Increase in use of pesticides have results into induced diseases which affect the crops and reduce the production. Hence, a serious challenge exist for researchers to introduce the new techniques to diagnose these diseases and to control the effects with preventive measures accordingly. In large farms to detect the diseases with bare eye becomes more tedious and time consuming task in real world. thus, an automatic detection of these diseases in domain of agriculture science is a current area of research.
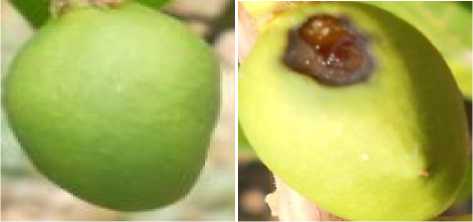
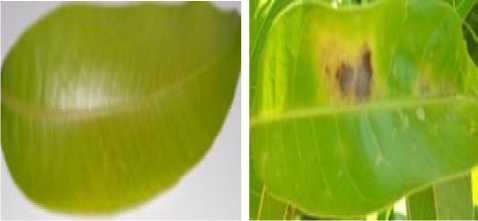
India is among the largest producers of mango crop across the world. Dashehari and Alphanso are two main varieties of mango crop grown in India. However, Farmers are still lagging far in global export market due to quite low yield and quality grading of fruit as a result of bacterial growth in mango. This bacterial growth in mango crops occurs in different part of plant such as fruits, flowers, stems and leaves which is a major factor for rapid decline of nurturing growth in upcoming years for the farms. There are several diseases occur to mango crop among which Powdery Mildew (Oidium Mangiferae) and Anthracnose / BlossomBlight (colletrichum Gloeosporioides) are two major diseases which are going to affect the production of mango crop greatly. In this paper, Authors discussed the techniques to diagnose the Anthracnose disease. This disease results in irregular shaped black patches which appear over the leaf surface or early grown fruits. Also, the fungus may occur under damp situations in these patches. These patches start in small shape but soon they cover the entire area of the fruit or leaf and finally result in rotten leaves or rotten fruits.
In this research, Author proposes an enhanced technique for mango crop disease recognition and classification based on image processing techniques. This is an extended work of [1]. The machine learning based automatic pathology diagnose scheme proves to be a milestone for flourishing cultivation and enhanced marketing for mango crop. The accuracy of the recognition system mainly depends on the features extracted from the image. Hence, in order to enhance the accuracy, Authors have combined the wavelet and PCA based statistical features to the work implemented in [1]. The total 32 features are extracted and used during training and testing phase to diagnose the disease in different parts of mango plant such as leaf, fruit and flower. To process the images generally three major types of features are extracted namely shape features, texture features and color features [2] [3]. These additional features have increase the accuracy of the system at the cost of increased coding and execution time. The rest of the paper is organized as follows: Section II presents the literature review of the domain. Section III describe the proposed research work with flow diagram. section IV shows experimental results obtained and. Section V conclude the work.
-
II. Literature Survey
The security of food still looks in danger due to various issues like plant diseases [4], climate change [5] etc. Plant diseases are not only a key hazard to food security all over the world, but can also have desperate consequences for countries whose economy largely depends on Agriculture. Their prompt recognition is still difficult due to the deficiency of the vital infrastructure. In image processing, regardless a lot of efforts [6–9] have employs, plant identification is still a difficult and vague problem. The main reason behind this issue is a plant in environment has very analogous shape and color version. several research papers are published in the related domain with their relevant pros and cons. A various efforts have implemented to overcome the crop loss due to diseases. An autonomous approach to diagnose a disease suitably when it first occurs is a critical step for proficient disease management system. The traditional disease diagnosis is assisted by agricultural organizations. Nowadays, such efforts have been carried out with online disease detection for providing information, in addition increase in use of internet and availability of advance technology hand held devices/ smart phone and digital camera have greatly motivate the work.
In [10] author presents an adaptive scheme for diagnosis of fruit diseases. Image processing techniques are employed to diagnose the disease in fruits. K-means clustering technique is employed for segmentation along with feature extraction for recognition. Extracted features are used to classify the diseased images among database with use of support vector machine. The accuracy obtained in this work is approximately 93%. In [11] author propose an automatic plant identification system for image database using all three types of shape, color and texture features. The major issue occurred in transformation are shape and pattern of leaf along with age of plant and leaf composition in addition to usual problems in object recognition such as variation in pose, light and orientation. The experimental results obtained shows an accuracy of 60% to 80% in all kinds of plant species.
In [12] author works on convolution neural networks (CNN) to learn unsupervised features for 44 various types of plant classes, collected at the Royal Botanic Garden, Kew, England. To grow perception on the selected features from the CNN model, a visualization method based on the de-convolution networks (DN) have used. Experimental results of CNN features based classifiers demonstrate reliability and accuracy compared to the fantasy solutions which solely depend upon handcraft features. To develop the accurate image classifier system for the plant disease recognition, There is a need of a large, confirmed dataset of images of diseased and healthy plants. To collect such a dataset is a much difficult task, and even online standard datasets are not available. To overcome such issues, the “Plant Village” project has initiated for collecting millions of images of diseased and healthy crop plants [13], which have been made open and free access to each researcher. In the process of image, object recognition gives the most of enhancement schemes in the last few years. The PASCAL VOC Challenge [14], and further recent the Large Scale Visual Recognition Challenge (ILSVRC) [15] based on the Image Net dataset [16] have been extensively utilized as standards for various visualization-related issues in image processing domain along with object recognition and classification.
In [17] using texture features, a detection and classification system for plant leaf diseases has designed. The work address an automated software implementation technique for diagnose of plant leaves. Also, various researches have tried to extract a number of features based on statistical parameters [18] and junction feature parameters [19]. In [20] author implements mathematical model for image processing techniques to understand growth analysis of crops. The challenge in this case is improper edge locations of leaves where, segmentation scheme is difficult to apply and hence turned out to be improper technique. There are many good results obtained in terms of either crop pest or disease recognition [21-24].
In [1] author extracts directional features using Modified Rotational Kernel Transform which results in a good accuracy, still it is limited to specific plant parts and extracted features are not sufficient to diagnose the diseases. Hence, an effort is made in this work to diagnose the diseases more accurately with combining Wavelet-PCA based statistical features with MRKT directional features..
-
III. Proposed Work
The flow of proposed research work is shown in Fig.1. As discussed in [1], on the acquired color images of plant parts (fruits, flowers and leaves), image-preprocessing steps such as color space conversion to obtain the grayness component and illumination normalization for recovering non-uniform illumination are applied. next. Adaptive K-means segmentation technique is applied to gray image to segment the image into lesion region and non-lesion region. In segmented lesion areas, sharp edges at the boundaries are obtained by applying various types of edge transformation techniques and then the edges are combined with segments to achieve the segmented lesion with better accuracy.
-
A. Image Acquisition and Pre-Processing
For experimental analysis of proposed method Author have captured about 500 images individually for each fruit, flower and leaf with healthy parts and diseased parts using high quality Nikon 16MP digital camera during Indian mango spring i.e. from March to July from the mango orchids and The Agricultural University situated at Dharwad, Karnataka,India. Each of the captured images is has high resolution of 4320x3240. The captured images are the color images. However, there may be possibility of uneven illumination regions occurring due to imaging equipment or external environmental issues. To recover the image parts from such situations a wavelet based technique is used where the image is decomposed into two parts as approximate coefficients (cA) and detail coefficients (cD). Furthermore, for contrast enhancement histogram equalization is employed on the approximation coefficients. Also edge enhancement, Gamma correction methodology (with γ>1) is used on detail coefficients. Finally, a uniform illumination image is reconstructed from these altered coefficients using inverse wavelet transform technique. Here,the signal can be expressed in terms of wavelet and scaling basis functions as following
f(x) = 'Ll ^0,t Фод(х)+ XjXtMjM (1)
Where, ^jt are the scaling coefficients, Ф у ; is scaling function for scale j,^.. is wavelet function for scale of j and [3 are the wavelet coefficients. Next, in order to normalize the brightness of captured image and to make it beneficial for human visual perspective, the color space conversion from RGB to YIQ is performed, Y (Grayness) is used for illumination level along with value I (Hue) and Q (Saturation) both for chrominance information.
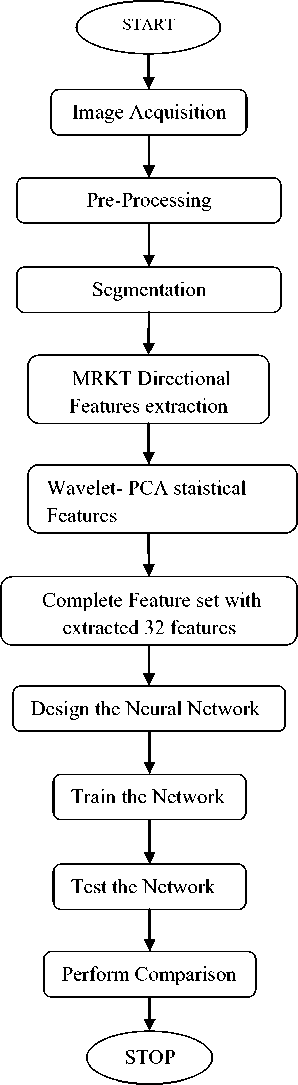
Fig.1. Flow Diagram of Proposed Work
-
B. Segmentation of Lesion Region
Adaptive K-Means Clustering technique is used to segment the lesion area from the plant part. This is the modified version of conventional K-Means segmentation method. In this technique, an iterative scheme is used by optimal minimization of objective function, which generates optimal solutions for initial k- centroids. The objective function used here is–
E d = Z fc=i Z n=1 5(^ min ^max ) (2)
Where, Ed is the Euclidean distance obtained between the local minimum pixel value Imin and local maximum pixel value7maz; P represents the total number of pixels present in image and c is the total number of cluster for image. Authors apply various types of edge detection transforms to determine the edges or boundaries of these lesion areas, based on pixel discontinuity scheme calculates the first order and second order derivatives and other transforms such as Sobel, Prewitt, and Roberts etc. Next, these extracted edges are superimposed on the segmented image. The Absolute Gradient or magnitude and Direction of Gradient or phase for these different types of transforms is commonly expressed as –
Magnitude of Gradient(Gr)
= 7^ 12 + W 22 (3)
Phase of Gradient^-)
= arctan® (4)
Where, w 1 and w2 are transformed values which are generated using first and second window of the particular transform respectively.
-
C. Directional Feature Extraction using MRKT and Recognition
In order to have the most accurate results during recognition, feature extraction is one of the most important phase. Lee and Rhodes [25] suggests the implementation of Rotating Kernel Transform (RKT), using number of directional kernels which are convolved with original image. After performing the convolution the one with maximum results is selected as the filtered result in order to enhance image. Based on this technique, Authors propose the method of Modified Rotational Kernel Transform (MRKT) by modifying the definitions and expressions of kernels for various directions. These transformations are still useful to obtain the edges and statistics of directions for image under effect of noise. Here, the image’s edge area is evaluated by different types of directional kernels. Statistics of particular edge direction are calculated and directional vectors named as MRKT features are obtained using them. For a particular segmented image I, first define the size of Kernel i.e. S and then the number of directions (DnMm) to be calculated is defined as –
D num =(2*5)-2 (5)
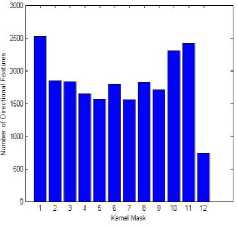
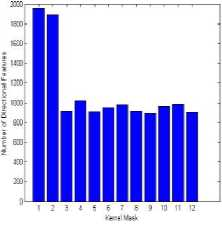
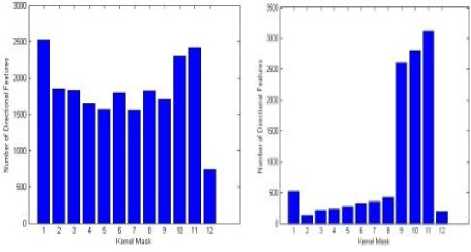
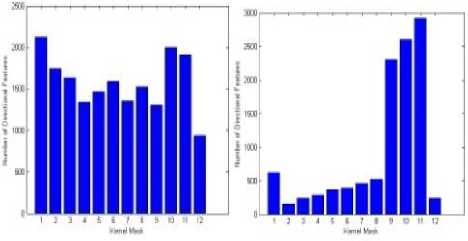
As a result of [1], Kernel Size is taken as S=7 which results in total number of directions as DnMm = 12. After feature extraction, for each directional feature a histogram is drawn. The histogram peaks help us to distinguish among the directional features. More variation and larger values of these features indicate the lesion area in the plant parts. Hence, by analyzing histograms one can easily visualize the dispersion of these lesion regions across the plant part. From the distribution of directional features of disease patches it is quite obvious that these parameters are having larger values, the probability of Anthracnose disease is more and parameters having very small values indicates the plant part is either disease free or dot type patches (inferior severity). However, these features gives quite accurate results to enhance the accuracy further Wavelet-PCA based features have also extracted.
-
D. Wavelet - PCA based Statistical Feature Extraction
To enhance the accuracy of recognition extracting thre additional 20 wavelet-based PCA statistical features. Nowadays, wavelet transform is enormously in image processing domain for image decomposition due to its various salient features such as –
Wavelet transform decompose an image such that the obtained sub images have a smaller resolution. This smaller resolution is very useful to reduce the complexity of mathematical computation and operations.
Wavelet transform is more useful than Fourier transform as Fourier transform supports only the data in frequency domain but Wavelet transform supports the local information in both frequency domain and spatial domain.
Since wavelet transform decomposes the image into sub images, it produces the images with different frequency bands. These obtained sub images are used in accordance to minimize the overhead of computation.
The wavelet transform is generally expressed as decomposition of any signal
f(x)
£
K2(G^)
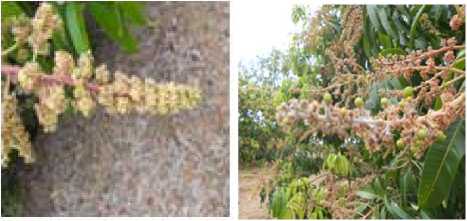
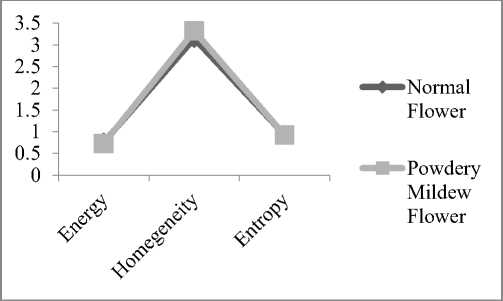
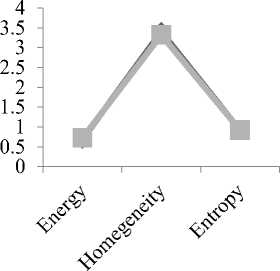
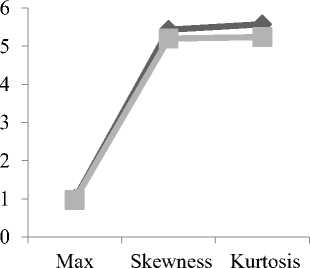
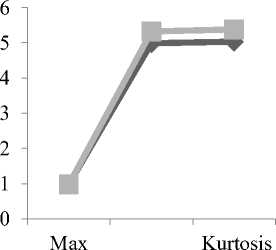
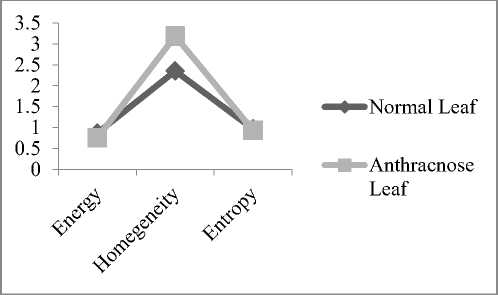
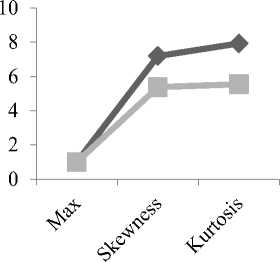
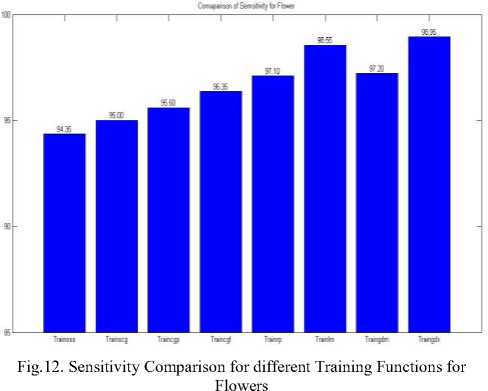
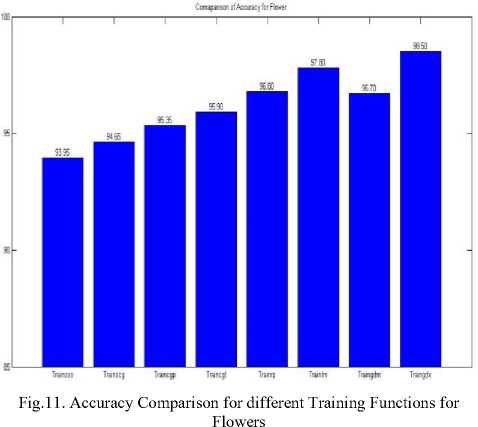
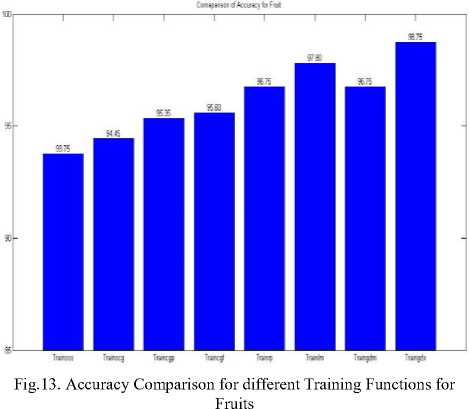
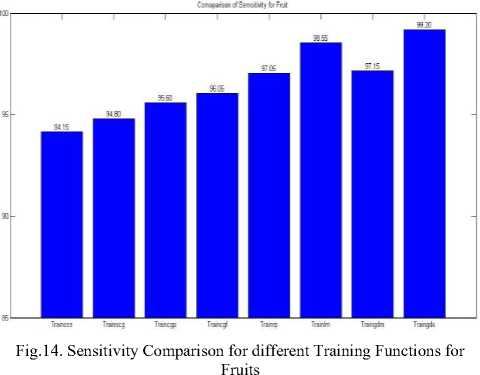
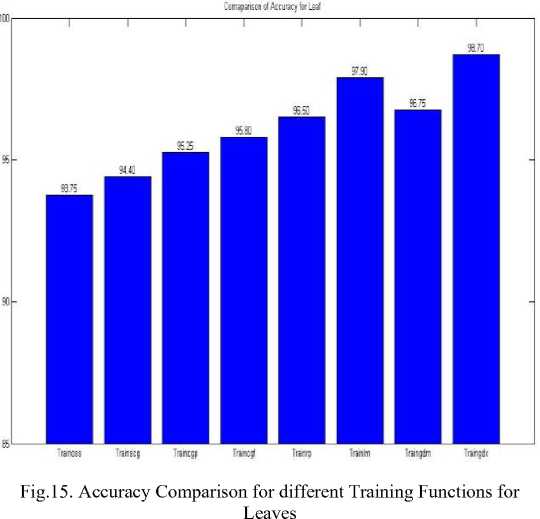
into a functions’ family. These functions are generally dilations and translations of their mother wavelet function Along with Wavelet, Authors use Principal Component Analysis (PCA) reduce the dimensions of data to the suited size which is more feasible for computations. It is also used to extract the most representative feature data out of the complete input data besides the reduced size of data in order to retain the significant features to represent the original data. It uses Eigen value decomposition methodology on the covariance matrix and evaluates the data on Eigen basis which are generally defined by the corresponding Eigen vectors. In obtained Eigen values only few of the Eigen values have larger values while rest of the Eigen values are significantly very small and hence they are not the part of major data variations. Consequently these directions of significantly higher variances are only utilized by calculating the inner product of data with the Eigen vectors for relevant Eigen values. The general steps of PCA methodology are given below – Step-1: Calculate the covariance matrix of given input data as 2V=NUm((diag(m) - diag(m)) (diag(n) - diag(n ■■} Where, 1 < m, n< Num Step-2: Calculate the Eigen vectors matrix (V) and diagonal matrix (D) of obtained Eigen values as V-1jV = D (7) Step-3: Arrange the obtained Eigen vectors in the descending order of corresponding magnitude of Eigen values and obtain the principal component parameter. Step-4: Finally, in the direction of principal components data is projected by calculating the inner product of data with the Eigen vectors for relevant Eigen values. In this work the input segmented images obtained with resolution of 256x256 are used to apply a three level ‘Haar’ wavelet transform to obtain sub bands of resolution of 32x32. The sub-band images are further applied and PCA parameter values are obtained. The PCA matrix is further used to calculate twenty statistical features which are formulated below. Let’s first divide all captured images in three groups Fruit (Fr), Flower (Fl) and Leaf (Lf). Now, take a set of fruit images for analysis of research, which is represented as – Imp = {Fri, Fr2,FT3,. Frm} (8) Where, Fr represents an image from Fruit group and m representing the number of images of fruit used for analysis. The key objective of wavelet based PCA component feature extraction is to enhance the accuracy of recognition to diagnose pathological problems in mango crop. set of images used for classification here is represented as – SFr = {sfri, sfr2,sfr3,s/rn} (9) Where, n represents the number of class sets and particular class is represented by sfr for respective image. Here, 20 wavelet based features are extracted which are used for an efficient classification scheme in order to diagnose the disease in mango crop. The obtained feature set values t be represented as – FV = {fui,fv2,fv3,.fv2o} (10) a) . Contrast: fvi = ZiZj(i-j)2.sfr(i.j) (11) b) . Correlation: f^2 lilj(ii)^fr(ij)- ц xцy oxo^ Where, = УУ j.sfr(i,j) µ yI J CTx = yy(i- Ц J2. sfr(i,j) i j гр = ЬЬи — ц ^)2^.sMt,i') c) . Energy (Uniformity): f^3 = ZiZjsfr(i,;)2(14) d). Homogeneity: e) . Mean: n ZiZjSfr(i,j) fv5 =---j (16) m*n f) . Standard Deviation: f^6 Z^^jj^^d^^iP)-^)^ A](N-1) g) . Entropy (Randomness): f-»7 = - ’Li’Lj sfr(i,j).\og(sfr(i,j))(18) h) . Root Mean Square (RMS): f I ZlZjSfr(i,j)2 fV8 = ^ jm.n i) . Skewness: f тр^гга,D-fvs)3 fV9 = ---j---N------- * fV6(20) j) . Kurtosis: T.iT.jdiMMWvP4 fvio = —j----------* fv6(21) k) . Variance: n ZiZj(Sfr(i,D-fV5)2 fVii = —j---- (22) l) . Smoothness: fV12 = - а+ыТ^Ц)) m) . Inverse Difference Moment (IDM): f^i3-XiXj^-^.sfr(i,j)(24) n) . Max Value: /V14 = max(sfr(i,j))(25) o) . Min Value: fvi5 - min(sfr(i,;))(26) p) . Range Value: fvi6=fvi4—fvi5(27) q) . Median: tsfrp+sfrp+1 ; p ^ Whole Number fV17 = ) 2 P ( sfrp ; p £ Fraction Where, all sf r's are arranged in the ascending order and p — 50 * N/100 r) . First Quartile: tsfrp+sfrp+1 ; p £ whole Number f (29) [ sfrp ; p £ Fraction Where, all sfr's are arranged in the ascending order and p = 25* N/100 s) . Third Quartile: tsfrp+sfrp+1 ; p £ whole Number fV19 -2 (30) ( sfrp ; p £ Fraction Where, all sfr's are arranged in the ascending order and p - 75* N/100 t) . Inter Quartile Range (IQR): fV20 - fV19 — fV18 (31) E. Classification using Artificial Neural Network Artificial neural network is known as sixth generation of soft computing. This system has three different types of layers named as, input layer, hidden layers and the output layer. The number of layers and the neurons or nodes present in a particular layer are assigned depending on the problem definition of the system. In this research work, the feed forward neural network has been used with input layer having 32 nodes, specified by total 32 valued feature set consisting of twenty Wavelet-PCA based statistical features and twelve dimensional MRKT directional features extracted as explained above. However, four hidden layers with each having four nodes have been used. Author use different types of training functions for training of network such as trainlm, trainrp, traingdx, trainoss, traincgp etc. with Multi category Continuous Perceptron Training Algorithm (MCPTA). Fig.2. Original images for (a).Healthy Flower (b) Powdery Mildew Flower —^Normal Fruit —■—Anthracnose Fruit ^—Normal Flower -*-Powdery Mildew Flower —•—Normal Fruit ^—Anthracnose Fruit Skewness Fig.6. (a)-(b) Comparative Analysis of Wavelet-PCA based Features for Normal and Anthracnose Fruit Fig.3. (a)-(b) Comparative Analysis of Wavelet-PCA based Features for Normal and Powdery Mildew Flower Fig.4. (a)-(b) Directional Frequency Histogram for Extracted MRKT Features for Normal and Powdery Mildew Flower Fig.7. (a)-(b) Directional Frequency Histogram for Extracted MRKT Features for Normal and Anthracnose Fruit Fig.5. Original images for (a). Healthy Fruit (b) Anthracnose Fruit Fig.8. Original images for (a) Healthy Leaf (b) Anthracnose Leaf ^^Normal Leaf —^Anthracnose Leaf Fig.9. (a)-(b) Comparative Analysis of Wavelet-PCA based Features for Normal and Anthracnose Leaf Fig.10. (a)-(b) Directional Frequency Histogram for Extracted MRKT Features for Normal and Anthracnose Leaf From the comparative results obtained in Fig.3, 6, and 9 it is obvious that no particular statistical analysis and no single feature value extracted is adequate to classify promptly the lesion area of the image data set into healthy and diseased classes. To progress the reult twelve MRKT features and a set of twenty Wavelet-PCA based feature vector have used in combine to classify the data set more promptly. Furthermore, for classification Researcher use neural networks with various training functions. For analysis, Authors have prepared a database with 32 dimensional feature vectors (Twelve MRKT features and twenty Wavelet-PCA based features) for all 500 images for each part of mango crop i.e. flower, fruit and leaf. Out of this database, 70% of database is used for training of the network and remaining 30% is used for testing purpose. Subsequently calculate the Confusion Matrix for the performance analysis, which is a 2x2 matrix with its elements as True Positive (TP), True Sensitivity (TPR) = TP/P where, P=TP+FN(32) Specificity (TNR) = TN/N where, N=TN+FP(33) FallOu (FPR) =FP/N(34) MissRate(FNR)= FN/P(35) Accuracy=(TP+TN/P+N)*100%(36) The results obtained are compared with some of the existing techniques as explained by a. kadir in [8], S.R. Dubey in [10], S. H. Lee in [12], J. Zhang in [21], L.Yuan in [22] and one of the technique implemented by author using MRKT features as in [1] applied for feature extraction. The comparison table with the comparative analysis graphs are presented in Table-IV and Fig.18 respectively. From the comparison results it is an evident to appeal that the proposed research performs better for all the plant parts flower, fruit and leaf. Training Algorithm Accuracy (%) Sensitivity (%) Traincgp 95.35 95.60 Traincgf 95.90 96.35 Traingdm 96.70 97.10 Traingdx 98.50 98.95 Trainlm 97.80 98.55 Trainrp 96.80 97.10 Trainoss 93.95 94.35 Trainscg 94.65 95.00 Training Algorithm Accuracy (%) Sensitivity (%) Traincgp 95.35 95.60 Traincgf 95.60 96.05 Traingdm 96.75 97.15 Traingdx 98.75 99.20 Trainlm 97.80 98.55 Trainrp 96.75 97.05 Trainoss 93.75 94.15 Trainscg 94.45 94.80 Training Algorithm Accuracy (%) Sensitivity (%) Traincgp 95.25 95.70 Traincgf 95.80 96.25 Traingdm 96.75 97.15 Traingdx 98.70 99.15 Trainlm 97.90 98.65 Trainrp 96.50 96.85 Trainoss 93.75 94.15 Trainscg 94.40 94.75 Table IV. Comparison of Accuracy of Proposed Research Work with other Existing WorksIV. Experimental Results
References An Enhanced Feature Extraction Technique for Diagnosis of Pathological Problems in Mango Crop
- S.B. Ullagaddi, S.Viswanadh.Raju, “Disease Recognition in Mango Crop Using Modified Rotational Kernel Transform Features” Advanced Computing and Communication Systems - ICACCS 2017.
- Y.Chai, X.Wang, “Recognition of greenhouse tomato disease based on image processing technology” Pattern Recognition and Simulation, 2013, vol.9, pp. 83-89.
- B.Zhang, J.Zhu, Y.Liu, “Image segmentation of crop leaves lesion based on the fuzzy C-means clustering,” Intelligent Computer and Applications, 2011, vol. 1, no.3, pp. 50-51.
- Tai AP, Martin MV, Heald CL (2014) “Threat to future global food security from climate change and ozone air pollution.” Nature Climate Change 4(9):817–821.
- Strange RN, Scott PR (2005) “Plant disease: a threat to global food security.” Phytopathology43.
- Neeraj Kumar, Peter N Belhumeur, Arijit Biswas, David W Jacobs, W John Kress, Ida C Lopez, andJoão VB Soares, “Leaf snap: A computer vision system for automatic plant species identification,” in ECCV, pp.502–516. Springer, 2012.
- CemKalyoncu and OnsenToygar, “Geometric leaf classification,” Computer Vision and Image Understanding” in Press, http://dx.doi.org/10.1016/j.cviu.2014.11.001.
- Abdul Kadir, Lukito Edi Nugroho, AdhiSusanto,and Paulus InsapSantosa, “Leaf classification using shape, color, and texture features,” arXiv preprintarXiv:1401.4447, 2013.
- Thibaut Beghin, James S Cope, Paolo Remagnino, and Sarah Barman, “Shape and texture based plant leaf classification,” in Advanced Concepts for Intelligent Vision Systems, 2010, pp. 345–353.
- Shiv Ram Dubey, Anand Singh Jalal (2012) “Adapted Approach for Fruit disease Identification using Images”, in International Journal of computer vision and image processing (IJCVIP) Vol. 2, no. 3:44-58.
- B. Yanikoglu, E. Aptoula, C. Tirkaz, “Automatic plant identification from photographs”, Machine Vision and Applications: 1369–1383.Springer-2014.
- Sue Han Lee, Chee Seng Chan, Paul Wilkin, Paolo Remagnino, “Deep-plant: plant identification with Convolutional neural networks”, rearXiv: 1506.08425v1, 2015
- Hughes DP, Salathé M (2015), “An open access repository of images on plant health to enablethe development of mobile disease diagnostics.” CoRRabs/1511.08060.
- Everingham M, Van Gool L, Williams CK, Winn J, Zisserman A (2010), “The pascal visual object classes (voc) challenge.” International journal of computer vision 88(2):303–33
- Russakovsky O et al. (2015) “Image Net Large Scale Visual Recognition Challenge.” International Journal of Computer Vision (IJCV) 115(3):211–252.
- Deng J et al. (2009) “Imagenet: A large-scale hierarchical image database in Computer Vision and Pattern Recognition” 2009. CVPR 2009. IEEE Conference on. (IEEE), pp. 248–255.
- Yinmao Song, ZhihuaDiao, Yunpeng Wang, Huan Wang, “Image Feature Extraction of Crop Disease” in IEEE Symposium on Electrical & Electronics Engineering (EEESYM), 2012
- Z.Peng, X.Si, X.Wang, H.Yuan, “Feature extraction of cucumber diseases based on computer image processing technology” Journal of Agricultural Mechanization Research, 2014, vol.02, pp.179-182,187.
- T.Liu, X.Zhong, C.Sun, W.Guo, Y.Chen, J.Sun, “Recognition of rice leaf diseases based on computer vision” Scientia AgriculturaSinica, 2014, vol.47, no.4, pp.664-674.
- G.E.Meyer, D.A.Davison, “An electronic image plant growth measurement system,” Transactions of the ASAE, 1987, vol.30, no.3, pp.591-596.
- J.Zhang, R.Pu, J.Wang ,W.Huang, L.Yuan, J.Luo, “Detecting powdery mildew of winter wheat using leaf level hyper spectral measurements” Computers and Electronics in Agriculture, 2012, vol.85, pp. 13-23.
- L.Yuan, Y.Huang, R.W.Loraamm, et al, “Spectral analysis of winter wheat leaves for detection and differentiation of diseases and insects” Field Crops Research, 2014, vol.156, pp.199-207.
- J.Zhang, R.Pu, W.Huang, L.Yuan, J.Luo, J.Wang, “Using in-situ hyper spectral data for detecting and discriminating yellow rust disease from nutrient stresses” Field Crops Research, 2012, vol.134,pp.165-174.
- J .Zhang, L.Yuan, R.Pu, R.W.Loraamm, G.Yang, J .Wang, “Comparison between wavelet spectral features and conventional spectral features in detecting yellow rust for winter wheat” Computers and Electronics in Agriculture, 2014, vol.100, pp.79-87.
- Y.K.Lee, W.T.Rhodes, “Nonlinear image processing by a rotating kernel transformation” Optics letters, 1990, vol.15, no.23, pp.1383-1385.
- S.B. Ullagaddi, Viswanadh Raju, “Automatic Robust Segmentation Scheme for Pathological Problems in Mango Crop” International Journal of Modern Education and Computer Science (IJMECS), Vol.9, No.1, pp.43-51, 2017.
