An Experimental and Statistical Analysis to Assess impact of Regional Accent on Distress Non-linguistic Scream of Young Women

Author: Disha Handa, Renu Vig, Mukesh Kumar, Namarta Vij
Journal: International Journal of Image, Graphics and Signal Processing @ijigsp
Article in issue: 4 vol.15, 2023.
Free access
Scream is recognized as constant and ear-splitting non-linguistic verbal communication that has no phonological structure. This research is based on the study to assess the effect of regional accent on distress screams of women of a very specific age group. The primary goal of this research is to identify the components of non-speech sound so that the region of origin of the speaker can be determined. Furthermore, this research can aid in the development of security techniques based on emotions to prevent and report criminal activities where victims used to yell for help. For the time being, we have limited the study to women because women are the primary victims of all types of criminal’s activities. The Non-Speech corpus has been used to explore different parameters of scream samples collected from three different regions by using high-reliability audio recordings. The detailed investigation is based on the vocal characteristics of female speakers. Further, the investigations have been verified with bi-variate, partial correlation and one-way ANOVA to find out the impact of region-based accent non-speech distress signal. Results from the correlation techniques indicate that out of four attributes only jitter varies with respect to the specific region. Whereas ANOVA depicts that there is no significant regional impact on distress non-speech signals.
Speech, Regional accent, screaming, women scream, correlation, statistical approach, Acoustic features
Short address: https://sciup.org/15018769
IDR: 15018769 | DOI: 10.5815/ijigsp.2023.04.03
Text of the scientific article An Experimental and Statistical Analysis to Assess impact of Regional Accent on Distress Non-linguistic Scream of Young Women
This study defines scream as persistent, loud vocalisations that lack phonological organization. Screams are indeed a form of expressing diverse emotional states, such as displeasure, anxiety, panic, etc. For the purposes of this study and future research, we distinguish screams from other loud vocalizations by specifying that they have lack of phonological pattern. By this way we are able to distinguish scream from the term’s "yell" or "shout." In literature, the term yell can be used as a typically concise, command-like, and contains verbal material. Human noises can be divided into two categories: 1) non-linguistics and 2) linguistics. A variety of mouth and tongue formations are used to make sounds such as whistles, screams, laughter, coughs, sneezes, and hiccups. Non-speech sounds do not contain any methodical organization of alphabets but have some meaning. For example, whistles and hoot express joy whereas Sneeze, snore, and hiccups are natural processes. Further the Screams articulate many emotional states such as anger, fear, distress or joy of human being. This is the most obvious response to signal ‘Go away, run away.’ All around the universe, a scream is one of the important and basic human emotions to express their self in danger.
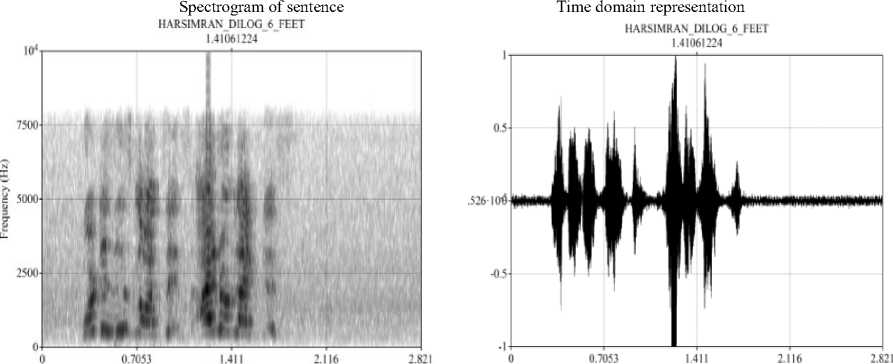
One important point here is that in the study we are considering only non-speech distress signals that mean these patterns have no word at all. This is an experimental analysis to validate the statement “Non-linguistic Screams have common characteristics to represent danger/anger/fear or pain irrespective of the region”. This is the first analysis of its type to find similarities/differences if any in the screaming signal tested among speakers from three different regions to contribute towards the new era of emotion-based intelligence. The basic goal of this study is to set the foundation for a complete IOT acoustic-based security system for women. Fig. 1. shows a sampling of a young female scream along both time and frequency axes with its Spectrogram analysis. It has been done using a Short-Time Fourier Transform method. The spectrogram of scream shows a sustained frequency with a limited, non-phonemic structure. The natural scream could consist of the yell, cry, or any short messages for rescue following it. Therefore, we are not comparing complete full-length screams. We have considered for comparison the scariest piece of a scream which comes out from the vocal cord having single respiratory exhalation having no voice break. Similarly, Fig. 2. represents the sampling of the young female’s normal speech utterance along both time and frequency axes with window length=0.005s. The uttered sentence is “what’s this nonsense! I don’t like this”.
Spectrogram of woman screams Time domain representation
GLRSIMRAN-uiet-3
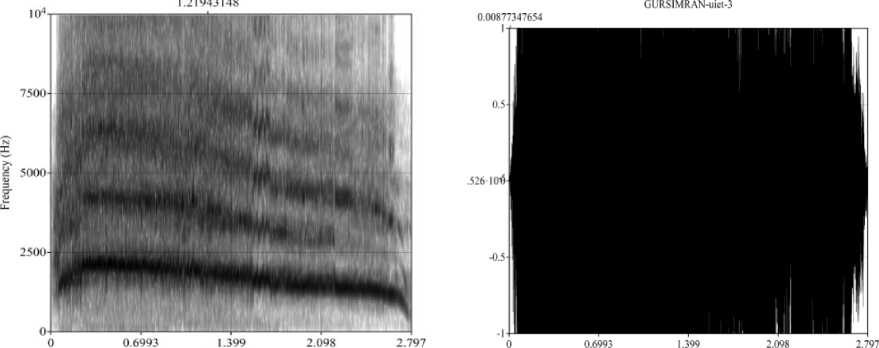
Time (s) Time (s)
Fig. 1. F0 domain and Time domain representation of women scream
Time (s) Time ($)
Fig. 2. F0 domain and Time domain representation of a sentence spoken by the female participant
The spectrogram and time domain representations that are being shown in fig. 1. and fig. 2. have generated by the same speaker. From Table 1, it can be seen how much work has already been done in this area. Few of the researchers have actually implanted any devices to detect screams. The overall paper has prepared as follows: Section two discusses the already used or implemented methods. Section three describes the corpus development for the project. Section four describes detailed measurements taken with Praat section five elaborates the results. The last section presents concluding remarks.
2. Related Work
Work-related to speech as well as scream signal processing have been considered in many studies. A neuroscientist David Poeppel and his team worked on the screaming science to determine the scare factor. According to their research, a scream has a unique characteristic called “roughness” [1]. Similarly, in [2] the authors made a differentiation between the distress screaming and joyful screaming based on a few specific parameters. In [3], A method for detecting distress signals in real time has been described. It is dependent on a blend of log energy constancy, compact MFCCs frames and high pitch analysis using an SVM technique. In [4], With the use of MARS and SVM technology, human sounds such as distress screams, coughs, and snores have been distinguished and categorized. In [5], the authors compared the performance of the auditory features such as flatness in audio spectral domain, LPC Coefficient, MFCCs, and Mel-Spectrum to detect distress signal with the help of SVM classifiers. James Green and Pamela G. Whitney have been measured the emotional tantrums of children by taking samples of cries/yells and screams [6]. The authors have projected an approach to recognize emotion from speech using formant analysis in [7]. In [8] the authors examined whether individual differences in F0 have retained across neutral speech, valence speech and nonverbal vocalizations with a help of well a corpus of 51 vocal sounds from both men and women. And, the results suggest that F0 may function as a consistent biosocial and individual indicator at hwart unlike communication contexts. In [9] a corpus of 260 naturalistic human nonverbal vocalizations representing nine emotions is analyzed by using acoustic simulator Praat as well as the statistical approach. The main classification algorithm used is a Random Forest that is a nonparametric method. The results show that the recognition correctness in a rating task is comparatively low for emotions such as joy, anger, and pain and high for some emotions like amusement, pleasure, fear, and sadness. Similarly, several studies explored information related to speech characteristics. In [10] the authors investigated speech characteristics for Velo-cardio-facial Syndrome (VCFS) in children, Adults with Mild and Moderate Intellectual Disabilities [11], Speech attributes in children with cleft palate and velopharyngeal dysfunction after articulation therapy [12]. In 2012, the journal of voice published a study to examine the use of vocal fry in young adult American native speakers and found maximum of this population used vocal fry that most likely to occur at the end of sentences [13].
Table 1. The overview of the literature in terms of goals, methods, and conclusion
|
Ref. No. |
Goals |
Description of the listed Goals |
|
[1] |
Objective |
Screams occupy a privileged position in the soundscape of communication. |
|
Techniques |
FMRI |
|
|
Conclusion |
The authors provide evidence of a special acoustic regime ("roughness") for screams. Detection of danger is due to the selective activation of the amygdala by acoustic roughness. Being separate from other communication signals, A scream occupies a special acoustic niche, ensuring its biological and ultimately social effectiveness. |
|
|
[2] |
Objective |
Identify the features of a non-linguistic signal that can be used to distinguish a scream of distress from a hoot in joy. |
|
Techniques |
Participation from women artists and analysis by using PRAAT |
|
|
Conclusion |
The results indicate that both perceptually categorized signals have distinct acoustic characteristics. Joyous screams are less intense than distress screams. In addition, the duration of the distress signal is longer than the Joyous screams. |
|
|
[3] |
Objective |
Scream detection for home applications |
|
Techniques |
Log energy, Autocorrelation and SVM |
|
|
Conclusion |
To detect live screams, a Linux algorithm coupled with a microphone array is used. |
|
|
[4] |
Objective |
Classification of non-speech human sounds including laugh, scream, sneeze, and snore. |
|
Techniques |
classification using MARS and SVM |
|
|
Conclusion |
Based on the classification, authors proposed a robust approach to further categorize snoring sound into snores with obstructive sleep apnea (OSA) and simple snore. |
|
|
[5] |
Objective |
investigates the power consumption of different stages of a sound-event classification system, including segmentation, feature extraction, and SVM scoring. |
|
Techniques |
Matrix vector multiplication method |
|
|
Conclusion |
Various acoustic features and SVM kernels are compared for performance and power consumption. The authors found that the intrinsic complexity of polynomial SVMs permitted us to reduce their CPU utilization by 28 times without compromising their classification accuracy. |
|
|
[6] |
Objective |
Analysis of vocal expressions of anger. |
|
Techniques |
Detailed Review |
|
|
Conclusion |
An evaluation of potential limitations of the basic experimental method for investigating anger recognition is presented along with the dominant theories of emotional experience. The empirical studies are based on these theories. |
|
[8] |
Objective |
To determine whether individual differences in pitch were preserved from speech to screams, roars, and pain cries |
|
Techniques |
PRAAT analysis, which utilizes a linear mixed model fitted by restricted maximum-likelihood estimation. |
|
|
Conclusion |
The F0 values for screams were the most extreme overall, resulting in the highest diversity among vocalizers. The frequency range of women's scared speech was substantially narrower, ranging from 307 to 570 Hz. |
|
|
[9] |
Objective |
To determine how beneficial noisy real-world recordings are for emotion research and acoustic modelling. |
|
Techniques |
Supervised random forest models |
|
|
Conclusion |
This work presents a corpus of 260 non-linguistic emotional vocalisations of humans extracted from online movies. Harmonicity, pitch, and measures of temporal structure were important auditory predictors of emotion; recognition accuracy in a rating test was rather low for some emotions (joy, pain, and fury), but quite good for others (amusement, fear, pleasure, and sadness). |
|
|
[15] |
Objective |
This article discusses the measurement and average decibel levels of female screams, as well as two distinct audibility assessments. |
|
Techniques |
A procedure for acoustic testing including loudspeaker playback of a recording of a female human scream at a calibrated sound pressure level from the source site was established by using Gaussian mixture model. |
|
|
Conclusion |
In most settings, a scream is unlikely to be identifiable from other forms of sounds above the threshold at which it may be recognised due to its distinctive nature. In forensic investigations, acoustic measurements and simulations can be useful if calibration is performed correctly and the possibility for result variability is assessed. |
|
|
[16] |
Objective |
This study studies the acoustic characteristics of screams and addresses those known to impede traditional speaker recognition algorithms from identifying screaming speakers. |
|
Techniques |
A process for acoustic testing comprising the loudspeaker playback of a recording of a female human scream at a calibrated sound pressure level from the source location has been established. |
|
|
Conclusion |
It is demonstrated that standard speaker recognition based on the GMM-universal backdrop model is unreliable for scream evaluation. |
|
|
[19] |
Objective |
This study aims to address the difficulty of identifying a speaker based on his or her voice, independently of the substance of the speech (text-independent). |
|
Techniques |
Comparison of MFCC with LPC technique |
|
|
Conclusion |
The results indicate that when the number of speakers increases, it becomes difficult for BPNN and GMM to maintain their accuracy level. The proposed score-based system is more stable, scalable and therefore; suited for large-scale applications. |
|
|
[21] |
Objective |
Effect of N-folds, N-neighbours on Accuracy |
|
Techniques |
KNN method and Python libraries for coding . |
|
|
Conclusion |
KNN' provides a maximum level of accuracy by up to 20folds. Afterward, it starts stalling. In contrast, the number of neighbours did not affect accuracy. |
|
|
[22] |
Objective |
Unsupervised learning is used to detect rare events at the edge of the Internet of Things |
|
Techniques |
Unsupervised learning |
|
|
Conclusion |
Overall, 90% accuracy has achieved. |
|
|
[23] |
Objective |
Contribution towards identifying Major Distinguishing Acoustic Features |
|
Techniques |
PCA and GLM Modelling |
|
|
Conclusion |
To define the auditory composition of screams, 27 acoustic characteristics were measured on the stimulus. PCA and generalised linear mixed modelling revealed that the screams were certainly correlated with high pitch, wide fundamental frequency variability and narrow inter quartile range bandwidth, and peak frequency slope. |
|
|
[25] |
Objective |
This study aims to determine whether a machine learning model trained solely on publicly available audio data sets might be used to recognize screams in audio streams taken in a home environment. |
|
Techniques |
gradient-boosted tree model with convolution neural network |
|
|
Conclusion |
These findings show that a distress scream detection model trained with publicly accessible data could be useful for monitoring clinical recordings and detecting tantrums. |
3. Corpus Development
The former studies on women’s screams have employed sound effects for screams from Internet repositories. Few researchers have recorded women vocals but with specifications required as per their research. For instance, Durand r. Begault has taken recordings in a sound deadened room [15]. From the mouth of the subject to the microphone the distance was 36 in. Whereas, a bank of sounds containing sentences and screams, simulated sounds such as alarm and other instrumental sounds, was constructed for successive auditory classification by Dr. Luc Arnal for their research. They had used such sounds for FMRI to measure the roughness in screams. Similarly, John H. L. Hansen, b) Mahesh Kumar Nandwana, and Navid Shokouhi had developed two corpora [16-17]. Six male speakers were there in corpus-1 and later to extend the research The UT-Non-Speech-II corpus was developed. Apart from human screams, other nonspeech speaker-specific sounds like cough and whistle were also recorded and few researchers maintained the corpus downloaded from the YouTube. Therefore, we also have developed our own set of women screams as per the research requirements. To analyse and compare the acoustic structure of screams from different regions, an analysis of a set of audio recordings has performed for thirty voluntarily participated speakers. All of them are females from 18-21 age groups and belongs to a different region. We have chosen India’s north zone’s two popular states “Punjab and Himachal Pradesh” and one union territory “Chandigarh” for the research. The reason to choose these areas is an easy approachability for sample collection. Although these regions have very close proximity yet the accent is significantly different. (Audio files representing Punjabi, Himachali and Chandigarh based accents produced by naïve speakers have been attached as supplementary files for the reference). The formal setup of corpus development is as follows:
-
3.1 Participation
For the study, consent-based volunteer participation has been chosen as a primary tool to record distress signals. Women students associated with the drama club of the University Institute of Engineering and Technology (Punjab University, Chandigarh), students from the Department of Theatre and television (Panjabi University, Patiala), and artists from Solan (Himachal Pradesh) have been approached for this purpose. While selecting participants some important health parameters have also taken into the consideration. These parameters are:
• Any persistent throat issue/ infection?
• Any nasal infection or sinus problem?
• Any other medical problem that is stopping you to scream loud?
3.2 Recordings
4. Experimental and Statistical Measurements4.1 Fundamental Frequency or F0 Contour
Based on the above, a total of fifty-five participants have been selected for the experiment. Out of fifty-five participants, twenty are from Punjab state, eighteen participants are from Chandigarh, and seventeen are from Himachal Pradesh region. But only thirty samples are found useful to further pursue the study. It has also taken care that there should be an equal number of participants from three regions. Out of twenty samples provided by Punjab state participants, fourteen were appropriate as per the instructions and requirement. Himachal Pradesh participants provided ten good samples out of seventeen and participants from Chandigarh provides only eleven good samples taken from eighteen samples. To maintain integrity and to apply statistical techniques, we have considered ten samples from each category.
Board X-NUCLEO-CCA02M1 has been utilized for all audio recordings. It is equipped with two MP34DT01-M digital mems microphones. The frequency response is flat up to 10 kHz. In addition, it has Omni-directional sensitivity, which allows the signal to be collected from any direction. The screams have been recorded using a sample rate of 44 kHz. The open-air theatre and fields have been used to collect voice samples. To record distress screams, the participants have been instructed to make loud vocalizations as though in distress. In all recordings, the distance between the lips and the microphone is around six feet. The duration of all screams is three seconds.
To analyse the regional impact on the acoustic structure of screams, it’s important to measure the similarities and differences among them. The analysis has been conducted to depict the most favourable linear combination of audio features for evaluating the properties of vocalization categories based on different regions from the non-speech corpus. For all analyses, the sampling frequency was 44 kHz. Measurements were made in terms of the voice characteristics such as pitch and loudness, jitter in sound generated and shimmer in voice. Previously, Nandwana and Hansen (2014) presented a similar probe experiment using six male speakers [17]. Advancing the study here, we consider female scream vocalization characteristics to assess the regional impact on the signals.
Fundamental frequency is the lowest frequency of any sound wave. It is the frequency we hear the sound at. The relationship between frequency and pitch is linear. The frequency of a sound wave determines the pitch of a sound. A sound wave with a high frequency has a high pitch, whereas a sound wave with a low frequency has a low pitch [18]. It reflects sentiment in voice data. It is considered as one of the important features found to differ under a diverse vocalization environment. One important point here is that we have considered fundamental frequency in the research in spite of MFCC coefficients because MFCC coefficients do not hold much pitch information [19]. Actually, the scream is a non-speech signal constituted with the loud, long, and persistent pronunciation of the vowel “i”. It is the combination of “aaa” +” eee”. Scream has only “aaaaaaaaaa” with persistent duration. Thus, we require only pitch information which can easily measure by using fundamental frequency. In this study, we have computed F0 contour for all the signals by using autocorrelation algorithm. The F0 frequency range is 75–3000 Hz.
Table 2. F0 contour in distress scream produced by speakers from different regions
|
Punjab |
Himachal |
Chandigarh |
|||
|
Participant |
Mean F0 (Hz) |
Participant |
Mean F0 (Hz) |
Participant |
Mean F0 (Hz) |
|
P1 |
1064.89 |
H1 |
1166.09 |
C1 |
1002.73 |
|
P2 |
860.107 |
H2 |
887.127 |
C2 |
1260.87 |
|
P3 |
825.189 |
H3 |
995.109 |
C3 |
927.102 |
|
P4 |
1654.63 |
H4 |
1554.93 |
C4 |
1354.79 |
|
P5 |
1334.403 |
H5 |
1294.412 |
C5 |
1642.88 |
|
P6 |
1009.395 |
H6 |
1209.125 |
C6 |
890.378 |
|
P7 |
571.427 |
H7 |
887.407 |
C7 |
873.106 |
|
P8 |
988.667 |
H8 |
1218.777 |
C8 |
1020.34 |
|
P9 |
801.238 |
H9 |
926.338 |
C9 |
1004.21 |
|
P10 |
883.713 |
H10 |
943.51 |
C10 |
983.563 |
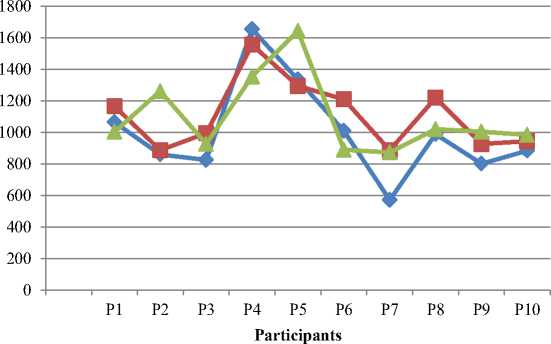
Fig. 3. it has been observed that the mean frequency (F0) of screams from Punjab has in the specific bracket from 825 Hz up to 1600 Hz. Similarly, from the other two regions it has 887 Hz up to 1554 Hz and 873Hz upto 1354 Hz. There is a significant variation with respect to each region if we talk about the specific value but we have also observed that the upper and lower bracket can be fixed.
Mean F0
I Punjab —□=> Himachal * Chandigarh
Fig. 3. Comparison of F0 contour produced by speakers from different regions for scream
-
4.2 Sound Intensity
Intensity of sound is also known as acoustic intensity. It is the energy carried by a sound wave per unit area in a perpendicular direction. It can be computed in energy quantities such as micro joules per second per cm square. It can also be quantified in terms of power, such as microwatts per centimetre squared. Likewise, sound level is measured in decibels. In this study, the experiment is conducted by keeping specific requirements in mind. All the samples have taken in open theatre to measure average energy from a specific range of distance which is within the radius of 6 feet (1.8 meters).
Table 3. Sound intensity in screams produced by speakers from different regions
|
Punjab |
Himachal |
Chandigarh |
|||
|
Participant |
Mean Intensity (dB) |
Participant |
Mean Intensity (dB) |
Participant |
Mean Intensity (dB) |
|
P1 |
91.9 |
H1 |
90.27 |
C1 |
92.62 |
|
P2 |
93.26 |
H2 |
91.33 |
C2 |
92.09 |
|
P3 |
93.05 |
H3 |
89.06 |
C3 |
90.02 |
|
P4 |
92.83 |
H4 |
90.28 |
C4 |
89.98 |
|
P5 |
92.96 |
H5 |
90.28 |
C5 |
92.62 |
|
P6 |
90.45 |
H6 |
88.67 |
C6 |
91.55 |
|
P7 |
89.55 |
H7 |
92.54 |
C7 |
89.9 |
|
P8 |
91.56 |
H8 |
90.71 |
C8 |
92.67 |
|
P9 |
90.44 |
H9 |
89.52 |
C9 |
91.33 |
|
P10 |
88.67 |
H10 |
90.67 |
C10 |
89.56 |
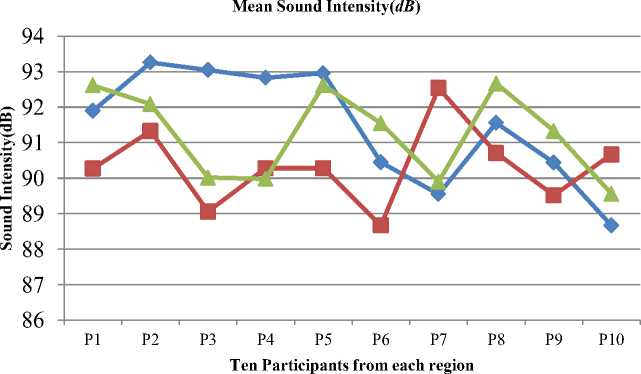
Fig. 4. depicts that all participants from different regions have maximum 93.05 and minimum 88.67 decibels intensity. It also shows that the sound intensity of Punjabi girls is more than the speakers from other two regions (93.26dB). Similarly, girls from the Himachal region have less sound intensity. The maximum value for this region is 91.33dB.
^^—Punjab ■ Himachal * Chandigarh
Fig. 4. Comparison of sound intensity produced by speakers from different regions
-
4.3 Jitter and Shimmer
Jitter and shimmer are the two widespread measures in acoustic analysis. Jitter determines frequency instability in a signal, whereas shimmer determines amplitude volatility. During sustained vowel production, an ordinary voice has some amount of instability due to the influences created by tissue and muscle properties. We have computed these features by using the Praat software [20]. The measurements for both the features are listed below.
Jitter measurements: Absolute jitter is the cyclic variation in fundamental frequency. The relative jitter is the average absolute difference between consecutive periods divided by the average period. The value is expressed as a percentage. We have investigated Jitter (relative) measures in this study.
Table 4. Relative values from vocalization produced by speakers from different regions for Jitter attributes
|
Punjab |
Himachal |
Chandigarh |
|||
|
Participant |
Jitter (%) |
Participant |
Jitter (%) |
Participant |
Jitter (%) |
|
P1 |
4.94 |
H1 |
3.53 |
C1 |
4.75 |
|
P2 |
4.55 |
H2 |
4.84 |
C2 |
3.28 |
|
P3 |
5.22 |
H3 |
2.31 |
C3 |
2.6 |
|
P4 |
4.77 |
H4 |
4.29 |
C4 |
2.36 |
|
P5 |
5.09 |
H5 |
4.72 |
C5 |
3.54 |
|
P6 |
5.34 |
H6 |
4.23 |
C6 |
3.75 |
|
P7 |
4.05 |
H7 |
3.92 |
C7 |
2.28 |
|
P8 |
5.12 |
H8 |
3.37 |
C8 |
4.6 |
|
P9 |
4.23 |
H9 |
4.55 |
C9 |
2.36 |
|
P10 |
5.17 |
H10 |
3.72 |
C10 |
3.98 |
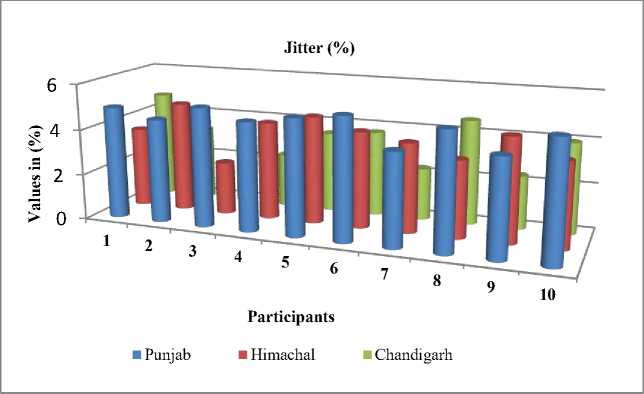
Fig. 5. Comparison of (relative) values from the vocalization produced by speakers from different regions for all the signals Jitter
Shimmer Measurements: Shimmer (dB) is the variation in peak-to-peak amplitude expressed in decibels. In the context of relative shimmer, it is defined as the average absolute difference between amplitudes of consecutive periods, expressed as a percentage, divided by the average amplitude. The study has evaluated relative measurements [24].
Table 5. Relative values from vocalization produced by speakers from different regions for Jitter attributes
|
Punjab |
Himachal |
Chandigarh |
|||
|
Participant |
Shimmer (%) |
Participant |
Shimmer (%) |
Participant |
Shimmer (%) |
|
P1 |
9.76 |
H1 |
8.1 |
C1 |
6.86 |
|
P2 |
7.08 |
H2 |
6.57 |
C2 |
8.71 |
|
P3 |
6.98 |
H3 |
6.49 |
C3 |
5.52 |
|
P4 |
5.87 |
H4 |
7.72 |
C4 |
7.19 |
|
P5 |
6.92 |
H5 |
6.2 |
C5 |
4.68 |
|
P6 |
8.16 |
H6 |
8.98 |
C6 |
5.66 |
|
P7 |
7.78 |
H7 |
7.57 |
C7 |
7.81 |
|
P8 |
5.93 |
H8 |
6.99 |
C8 |
5.5 |
|
P9 |
5.27 |
H9 |
8.12 |
C9 |
7.46 |
|
P10 |
7.22 |
H10 |
7.24 |
C10 |
5.78 |
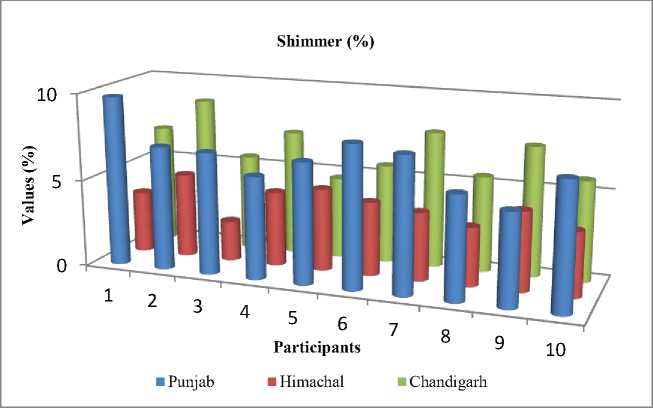
Fig. 6. Comparison of (relative) values from the vocalization produced by speakers from different regions for all the signals Shimmer
From Fig. 5. and Fig. 6., it is apparent that the jitter and shimmer values for scream are quite dissimilar from each candidate irrespective of their region for the scream signal. This shows that the frequency, as well as amplitude, is not stable in the received signal generated by different speakers from the three different regions for screaming.
4.4 Statistical Analyses
5. Results and Discussion
5.1 Bivariate Analysis5.2 Statistical Analysis using Partial correlation
5.3 One-way ANOVA
The study is to analyse the effect of Regional Accent on Distress Non-linguistic Scream of Young Women. The data has extracted from audio recordings particularly artistic screaming. These types of recordings can be recorded only with the help of artists of specific regions. Due to this constraint the data size is quite limited. We have applied bivariate and partial correlation to find out the degree and significant linear relation between region and attributes of Non-linguistic Scream. We have further analysed the impact of the regional accent on F0 contour, intensity, shimmer, and jitter by applying one way ANOVA.
This study uses bivariate analysis to measure the statistical association between regional accent and the distress non-speech attributes in order to assess the impact, measure the strength of the association, and determine whether one variable can be predicted from another [26]. The result signifies that correlation between region and F0 Contour is 0.157 with 0.406 significance value which further states that there is no significant linear relation among these two attributes. Similarly, that correlation value between region and Intensity is -0.069 with 0.720 significance value so there is no significant linear relation among these two attributes also. Whereas, the correlation between region and Jitter is -.656 with significance 0.01 value, hence we can comment that there is strong and significant linear relation between these two [27]. Which further states that regional accent is putting the impact on jitter vocal attribute. The correlation between region and Contour is -0.204 and significance is 0.279 so there is no significant linear relation between these two attributes.
The region has been kept as the controlling variable in the partial correlation analysis. The correlation between intensity and jitter is 0.355 , while the level of significance is .064 , which suggests a significant linear relationship between jitter and intensity of a particular region. Using bivariate analysis, we concluded that the correlation between region and Jitter is -.656 with a significance value of 0.01 indicating that both attributes are closely related [28]. It also illustrates the strong relationship between sound intensity and jitter when using partial correlation with region as constant. This further confirms the importance of regional accent on jitter.
One way ANOVA has been used to test for differences in F0 across all screams from different regions. There are two variables in the study. The independent variable is the region and the dependent variable is the root mean square (RMS) value of a scream. We want to observe if the region’s accent or slang puts an impact on the screaming voice pitch. Here, the mean score of the participants belonged to Punjab is 0.63, 0.62 from Himachal, and 0.61 from Chandigarh along with the standard deviation. Table 6 reflects the ANOVA results having an F score of .371 and probability level .694. The formula for calculating the F-value in an ANOVA is: variation between sample means / variation within the samples [29]. It is computed by dividing the squares of the two means. In an ANOVA, the higher the F-value, the greater the difference between sample averages relative to the variation within the samples is shown in table 7.
Table 6. Descriptive values using ANOVA
|
States |
Number of samples |
RMS |
Std. Deviation |
Std. Error |
95% Confidence Interval for Mean |
|
|
Lower Bound |
Upper Bound |
|||||
|
Punjab |
10 |
.632700 |
.0409527 |
.0129504 |
.603404 |
.661996 |
|
Himachal |
10 |
.623500 |
.448832 |
.0141933 |
.595051 |
.655607 |
|
Chandigarh |
10 |
.617600 |
.0315214 |
.0099679 |
.595051 |
.640149 |
|
Total |
30 |
.624600 |
.0386519 |
.0070568 |
.610167 |
.639033 |
The higher the F level gets the lower will be the significance or probability score. In this case, the significant score is .694. Thus, even though we find a difference between the mean values across the samples, this difference we found would happen 69% of the time. In other words, it may due to sampling error. So, the difference is not statistically significant.
Table 7. F score and probability values using ANOVA
|
Sum of Squares |
df |
Mean Square |
F |
Sig. |
|
|
Between Groups |
.001 |
2 |
.001 |
.371 |
.694 |
|
Within Groups |
.042 |
27 |
.002 |
NA |
NA |
|
Total |
.043 |
29 |
NA |
NA |
6. Conclusion
In this study, we have considered the manually extracted scream characteristics in order to compare non-speech vocalizations among three different regions of INDIA. To achieve this, we have developed non-speech corpora with ten samples in each category. The selection of samples is based on the audio clarity, proper pronunciation (as directed). The study concluded that i) although the range of acoustic values is restricted to define yet there is lot of variations in data values (experimental observation). ii) The statistical results also depicts that there is significant difference in the mean values of all recorded screams. Although it clarifies that only jitter has been impacted from the regional accent out of the four selected parameters that further signifies that there is a scope of speaker verification in case of non-speech samples. iii) Whereas ANOVA says there is no significant impact of regional accent on all the parameters. Although the study neither disagree from the statement that the regional accent put impact on vocal attributes of non-speech signal nor agrees on this concept, yet there is scope to record and analyse large group of samples from all Indian regions to cross validate the experiment. This information may find useful in audio forensic studies.
References An Experimental and Statistical Analysis to Assess impact of Regional Accent on Distress Non-linguistic Scream of Young Women
- Arnal, L. H., Flinker, A., Kleinschmidt, A., Giraud, A. L., & Poeppel, D. (2015). Human screams occupy a privileged niche in the communication soundscape. Current Biology, 25(15), 2051-2056.
- Handa, D., & Vig, R. (2020, February). Distress Screaming vs Joyful Screaming: An Experimental Analysis on Both the High Pitch Acoustic Signals to Trace Differences and Similarities. In 2020 Indo–Taiwan 2nd International Conference on Computing, Analytics and Networks (Indo-Taiwan ICAN) (pp. 190-193). IEEE.
- Huang, W., Chiew, T. K., Li, H., Kok, T. S., & Biswas, J. (2010, June). Scream detection for home applications. In 2010 5th IEEE Conference on Industrial Electronics and Applications (pp. 2115-2120). IEEE.
- Liao, W. H., & Lin, Y. K. (2009, October). Classification of non-speech human sounds: Feature selection and snoring sound analysis. In 2009 IEEE International Conference on Systems, Man and Cybernetics (pp. 2695-2700). IEEE.
- Mak, M. W., & Kung, S. Y. (2012, March). Low-power SVM classifiers for sound event classification on mobile devices. In 2012 IEEE International Conference on Acoustics, Speech and Signal Processing (ICASSP) (pp. 1985-1988). IEEE.
- Green, J. A., Whitney, P. G., & Gustafson, G. E. (2010). Vocal expressions of anger. In International handbook of anger (pp. 139-156). Springer, New York, NY.
- Vlasenko, B., Philippou-Hübner, D., Prylipko, D., Böck, R., Siegert, I., & Wendemuth, A. (2011, July). Vowels formants analysis allows straightforward detection of high arousal emotions. In 2011 IEEE International Conference on Multimedia and Expo (pp. 1-6). IEEE.
- Pisanski, K., Raine, J., & Reby, D. (2020). Individual differences in human voice pitch are preserved from speech to screams, roars and pain cries. Royal Society open science, 7(2), 191642.
- Anikin, A., & Persson, T. (2017). Nonlinguistic vocalizations from online amateur videos for emotion research: A validated corpus. Behavior research methods, 49(2), 758-771.
- D'Antonio, L. L., Scherer, N. J., Miller, L. L., Kalbfleisch, J. H., & Bartley, J. A. (2001). Analysis of speech characteristics in children with velocardiofacial syndrome (VCFS) and children with phenotypic overlap without VCFS. The Cleft palate-craniofacial journal, 38(5), 455-467.
- Coppens-Hofman, M. C., Terband, H., Snik, A. F., & Maassen, B. A. (2016). Speech characteristics and intelligibility in adults with mild and moderate intellectual disabilities. Folia Phoniatrica et Logopaedica, 68(4), 175-182.
- Derakhshandeh, F., Nikmaram, M., Hosseinabad, H. H., Memarzadeh, M., Taheri, M., Omrani, M., ... & Sell, D. (2016). Speech characteristics after articulation therapy in children with cleft palate and velopharyngeal dysfunction–A single case experimental design. International journal of pediatric otorhinolaryngology, 86, 104-113.
- Wolk, L., Abdelli-Beruh, N. B., & Slavin, D. (2012). Habitual use of vocal fry in young adult female speakers. Journal of Voice, 26(3), e111-e116.
- Hansen, J. H., Nandwana, M. K., & Shokouhi, N. (2017). Analysis of human scream and its impact on text-independent speaker verification. The Journal of the Acoustical Society of America, 141(4), 2957-2967.
- Begault, D. R. (2008, June). Forensic analysis of the audibility of female screams. In Audio Engineering Society Conference: 33rd International Conference: Audio Forensics-Theory and Practice. Audio Engineering Society.
- Hansen, J. H., Nandwana, M. K., & Shokouhi, N. (2017). Analysis of human scream and its impact on text-independent speaker verification. The Journal of the Acoustical Society of America, 141(4), 2957-2967.
- Nandwana, M. K., & Hansen, J. H. (2014). Analysis and identification of human scream: Implications for speaker recognition. In Fifteenth Annual Conference of the International Speech Communication Association.
- Cooper, W. E., & Sorensen, J. M. (2012). Fundamental frequency in sentence production. Springer Science & Business Media.
- Almaadeed, N., Aggoun, A., & Amira, A. (2016). Text-independent speaker identification using vowel formants. Journal of Signal Processing Systems, 82(3), 345-356.
- Boersma, P. (2014). The use of Praat in corpus research. The Oxford handbook of corpus phonology, 342-360.
- Janjua, Z. H., Vecchio, M., Antonini, M., & Antonelli, F. (2019). IRESE: An intelligent rare-event detection system using unsupervised learning on the IoT edge. Engineering Applications of Artificial Intelligence, 84, 41-50.
- Schwartz, J. W., Engelberg, J. W., & Gouzoules, H. (2020). Was that a scream? Listener agreement and major distinguishing acoustic features. Journal of Nonverbal Behavior, 44(2), 233-252.
- Ward, L., Shirley, B. G., Tang, Y., & Davies, W. J. (2017, August). The effect of situation-specific non-speech acoustic cues on the intelligibility of speech in noise. In INTERSPEECH 2017, 18th Annual Conference of the International Speech Communication Association.
- Hurring, G., Hay, J., Drager, K., Podlubny, R., Manhire, L., & Ellis, A. (2022). Social Priming in Speech Perception: Revisiting Kangaroo/Kiwi Priming in New Zealand English. Brain Sciences, 12(6), 684.
- O'Donovan, R., Sezgin, E., Bambach, S., Butter, E., & Lin, S. (2020). Detecting Screams From Home Audio Recordings to Identify Tantrums: Exploratory Study Using Transfer Machine Learning. JMIR Formative Research, 4(6), e18279.
- Mukesh Kumar, Nidhi, Bhisham Sharma, Disha Handa, "Building Predictive Model by Using Data Mining and Feature Selection Techniques on Academic Dataset", International Journal of Modern Education and Computer Science(IJMECS), Vol.14, No.4, pp. 16-29, 2022.DOI: 10.5815/ijmecs.2022.04.02
- Mukesh Kumar, Nidhi, Anas Quteishat, Ahmed Qtaishat, "Performance Comparison of the Optimized Ensemble Model with Existing Classifier Models", International Journal of Modern Education and Computer Science(IJMECS), Vol.14, No.3, pp. 76-87, 2022. DOI:10.5815/ijmecs.2022.03.05
- Shriram D. Raut, Vikas T. Humbe,"Statistical Analysis of Resulting Palm vein Image through Enhancement Operations", International Journal of Information Engineering and Electronic Business(IJIEEB), vol.5, no.6, pp.47-54, 2013. DOI: 10.5815/ijieeb.2013.06.06.
- Paschal A. Ochang, Philip J. Irving, Paulinus O. Ofem,"Research on Wireless Network Security Awareness of Average Users", International Journal of Wireless and Microwave Technologies(IJWMT), Vol.6, No.2, pp.21-29, 2016. DOI:10.5815/ijwmt.2016.02.03
