An experimental evaluation of tools for estimating bandwidth-related metrics

Author: Fatih Abut, Martin Leischner
Journal: International Journal of Computer Network and Information Security @ijcnis
Article in issue: 7 vol.10, 2018.
Free access
For many different applications, current information about the bandwidth-related metrics of the utilized connection is very useful as they directly impact the performance of throughput sensitive applications such as streaming servers, IPTV and VoIP applications. In literature, several tools have been proposed to estimate major bandwidth-related metrics such as capacity, available bandwidth and achievable throughput. The vast majority of these tools fall into one of Packet Pair (PP), Variable Packet Size (VPS), Self-Loading of Periodic Streams (SLoPS) or Throughput approaches. In this study, seven popular bandwidth estimation tools including nettimer, pathrate, pathchar, pchar, clink, pathload and iperf belonging to these four well-known estimation techniques are presented and experimentally evaluated in a controlled testbed environment. Differently from the rest of studies in literature, all tools have been uniformly classified and evaluated according to an objective and sophisticated classification and evaluation scheme. The performance comparison of the tools incorporates not only the estimation accuracy but also the probing time and overhead caused.
Capacity, Available Bandwidth, Throughput, Bandwidth Estimation, Measurement, Quality of Service
Short address: https://sciup.org/15015613
IDR: 15015613 | DOI: 10.5815/ijcnis.2018.07.01
Text of the scientific article An experimental evaluation of tools for estimating bandwidth-related metrics
Published Online July 2018 in MECS DOI: 10.5815/ijcnis.2018.07.01
The term bandwidth originally comes from the field of telecommunications and refers to the "width" of a frequency band. A frequency band is defined by its frequency range by the lowest and highest frequency possible on a transmission channel. The wider this frequency band, the more data can be transmitted per second. In telecommunications, the analog bandwidth is used for the transmission of analog information such as radio and conventional telephone information. The basic unit of analog bandwidth is Hertz (Hz), i.e. cycles per second. Mostly, multiples of this basic unit such as Megahertz (MHz) or Gigahertz (GHz) are used.
In the field of digital telecommunications, this term has a slightly different meaning which is referred to as digital bandwidth. All information, i.e. speech, video and text data are converted into bitstreams before being transmitted over digital media. Therefore, in digital transmission technology, bandwidth is defined as the number of bits that can be transmitted per unit time. In contrast to analog bandwidth, the unit of digital bandwidth is given in bits per second (b/s). Similarly, multiples of this basic unit are often used, e.g. Megabits per second (Mb/s) or Gigabits per second (Gb/s). Hereafter, the term bandwidth always refers to the digital variant.
The term bandwidth is often imprecisely applied to a variety of throughput-related concepts. An in-depth literature review shows that there are three major bandwidth-related metrics: capacity, available bandwidth and achievable throughput. The capacity states the maximum number of bits per time unit a network link can theoretically transfer. The available bandwidth of a network link is defined as the average residual (or spare) capacity of that link in a given period of time. Achievable bandwidth is the maximum number of bits per time unit that a link can provide to an application, given the current utilization, the protocol and operating system used, and the end-host performance capability and load. Each of these metrics can be estimated either on the entire path between two end-hosts or hop-by-hop. For a formal definition of these metrics, the interested reader is referred to respective publications [1–3].
The estimation of each metric is associated at least with one estimation technique. PP [4] estimates the capacity of the weakest link on the entire path between two hosts, i.e. the end-to-end capacity. To estimate the end-to-end capacity, PP always sends two packets back-to-back, then measures the time difference between the two packets caused by the bottleneck and correlates it with the packet size. The tools nettimer [5] and pathrate [6] implement the PP approach. VPS uses the round-trip times (RTTs) of several packets of different sizes. The capacity of each individual hop (i.e. per-hop capacities)
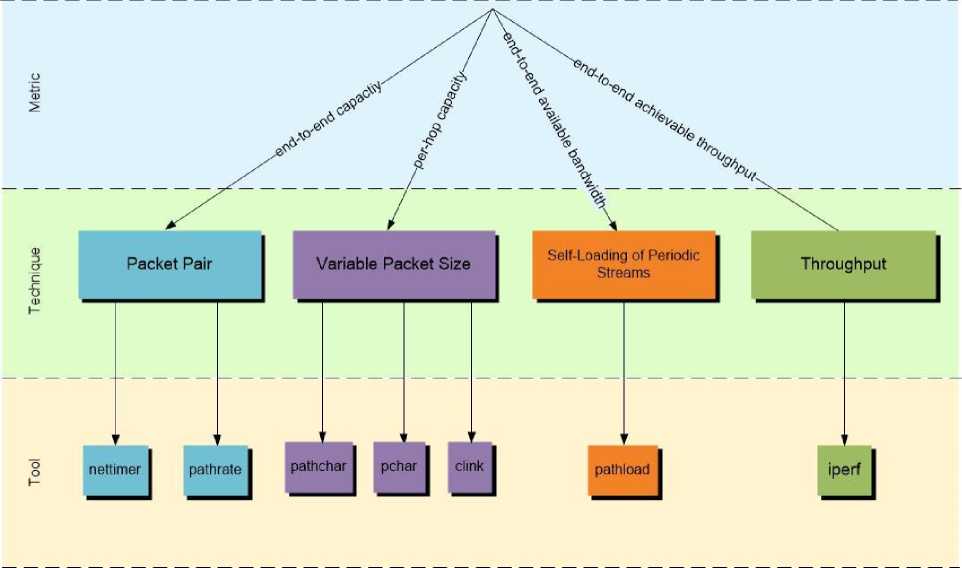
Fig.1. An Overview: Metrics, Techniques and Tools
in the path to the receiver is estimated. The tools pathchar [7], pchar [8] and clink [9] implement the VPS approach. The SLoPS approach can be used to estimate the end-to-end available bandwidth between two hosts. The sender sends to the receiver a packet sequence at a certain transmission rate that is iteratively increased until the end-to-end available bandwidth between sender and receiver is exceeded. If the transmission rate of the packet sequence is higher than the end-to-end available bandwidth, the one-way delays of the transmitted packet sequence tend to increase, which is the idea on which this technique builds. The pathload tool [10] implements the SLoPS approach. Finally, Throughput correlates the amount of data sent with the required time to measure the achievable TCP throughput between two hosts. This approach is implemented by the iperf tool [11]. Fig. 1 gives an overview of bandwidth-related metrics, techniques and tools that are addressed in this study.
The motivation in estimating bandwidth-related metrics is manifold and vary for each metric. For example, end-to-end capacity estimation tools can be used to identify the bottleneck along a path between sender and receiver. If a bottleneck is located in the path, it may be possible replace or bypass the path to improve the overall performance of the network [12]. The knowledge of per-hop capacities is useful for network tomography where the topology of a network can be inferred through end-to-end measurements without needing access to intermediate network elements.
Today's mobile devices typically have multiple network interfaces, e.g. LAN, WLAN, 3G/UMTS and 4G/LTE interfaces. Using an end-to-end available estimation tool, one could automatically select the network interface with the highest available bandwidth to achieve a better overall performance of Internet applications. Another application finds the accurate available bandwidth estimation in the dynamic server selection on the Internet. A requested file may be available on several servers. The decision as to which server is currently the best for the file could be made based on the highest available bandwidth [13].
Information about the achievable throughput along a network path is also important for many different applications. If an application transmits its data faster than the achievable throughput on the network, it causes overload and packet losses, so there is no efficient data exchange. If the application does not use the achievable throughput optimally, the performance of this application is adversely affected. Therefore, knowledge of achievable throughput is very important for applications consuming high bandwidth such as streaming servers, IPTV and VoIP applications [14].
Finally, estimating and monitoring the capacity, available bandwidth and achievable throughput metrics allow the verification of service level agreements (SLAs). In a SLA, certain performance parameters such as RTT, jitter, packet loss and the bandwidth-related metrics can be agreed between service provider and service user. In such a case, both parties must have an opportunity to check whether the bandwidth-related metrics agreed upon in the contract is also complied with [15].
The objective of the study is to experimentally evaluate and compare the capacity, available bandwidth and achievable throughput estimation tools shown in Fig. 1 in terms of their estimation accuracy and performance. Through experiments in the laboratory environment, the estimation accuracy and performance (i.e. how long a measurement procedure lasts and how much probe traffic is generated) of each tool are experimentally evaluated. Differently from the rest of studies in literature, all estimation tools are uniformly classified and evaluated according to an objective and sophisticated classification and evaluation scheme.
The rest of the study is divided into five main sections. Section II gives an overview of previous studies on estimating bandwidth-related metrics. Section III presents the testbed and methodology used to evaluate the tools. Section IV presents the results and discussion. Finally, section V concludes the paper with an outlook.
-
II. Related Works
Estimating bandwidth-related metrics is not a new topic in this research area. There are many tools and related scientific papers that deal with this challenge.
The tools nettimer [5], pathrate [6], SProbe [16], CapProbe [17], AsymProbe [18], PPrate [19] and MultiQ [20] estimate the end-to-end capacity of a path. Particularly, nettimer is a passive tool to measure the end-to-end capacity along a path in real time and in both directions, i.e. in upstream and downstream directions. Pathrate uses many packet pairs to uncover the multimodal bandwidth distribution whereby the challenge is to identify the local modes, and to then select the mode that corresponds to the path capacity. SProbe is a fast, scalable and accurate measurement tool that works in uncooperative environments by using the properties of TCP. CapProbe combines delay as well as dispersion measurements of packet pairs to filter out samples distorted by cross-traffic. AsymProbe is a “sender only”, round trip procedure to estimate asymmetric link capacities. PPrate passively extracts capacity information of a path from the packet trace of a TCP connection. Finally, MultiQ is another passive tool that extracts the capacity of multiple congested links along a path from a single flow trace by using equally-spaced mode gaps in TCP flows’ packet interarrival time distributions.
In contrast, the tools pathchar [7], pchar [8] and clink [9] estimate the per-hop capacities along the path between the sender and receiver. All of these tools infer per-hop capacities from the relationship between packet size and delay. However, delay measurements mostly rely on ICMP time-exceeded messages from routers, which limits both the applicability and the accuracy of these tools.
The tools pathload [10], IGI-PTR [21], spruce [22], yaz [23], ASSOLO [24], pathChirp [25] and DietTopp [26] estimate the end-to-end available bandwidth. More specifically, the methodology used by pathload is based on the rationale that the one-way delays of a periodic packet stream show an increasing trend when the stream’s rate is higher than the available bandwidth. IGI/PTR uses active packet-train probing whereas both IGI and PTR algorithms share the probing procedure. The main difference between them is that IGI focuses on calculating background traffic load, while PTR directly calculates packet transmission rate. Spruce samples the arrival rate at the bottleneck by sending pairs of packets spaced so that the second probe packet arrives at a bottleneck queue before the first packet departs the queue. Spruce then calculates the available bandwidth as the difference between the path capacity and the arrival rate at the bottleneck. Yaz is another tool that builds on the insights of pathload, specifically designed to improve pathload’s intrusiveness grade. ASSOLO is based on the concept of self-induced congestion and incorporates a probe traffic profile, referred to as reflected exponential chirp, which tests a wide range of rates with a single stream being more accurate in the center of the probing interval. Another tool based on the concept of selfinduced congestion is pathchirp, which features an exponential flight pattern of probes, referred to as a chirp. By rapidly increasing the probing rate within each chirp, pathchirp obtains a rich set of information from which to dynamically estimate the available bandwidth. Finally, DietTOPP dynamically changes the bit-rate of probing traffic. The available bandwidth is obtained when the probing traffic throughput experiences the turning point.
Finally, the tools iperf [11], TTCP [27] and NetPerf [28] measure the end-to-end throughput between two hosts. These tools determine the throughput by measuring the amount of data sent for a fixed period of time. They use TCP or UDP streams and can make use of parallel TCP connections. In contrast to capacity and available bandwidth estimation tools, throughput measurement tools generate significant traffic load on the network, causing high and persistent queue delays or packet losses, and thus affecting the throughput of other connections.
Most of these studies have a similar structure. They primarily describe the bandwidth-related metric addressed by the tool along with the estimation technique. Subsequently, implementation-specific details of the proposed tool are presented. Finally, in the last part, the tool is experimentally evaluated on a testbed. However, the tools evaluated in these individual studies have their own measurement setup, configuration and methodology, and are not assessed according to the same classification and evaluation criteria, making them difficult to objectively compare. In addition, most authors only evaluate the tools for their estimation accuracy whereas other important performance parameters such as the required measurement time and the amount of actively generated measurement traffic are disregarded.
There are also studies conducted with the intention of exclusively comparing these tools. For example, the study in [23] compares yaz with pathload and spruce. In [29], the tools DietTopp, pathload and pathChirp are compared in simulation. The study in [30] evaluates the tools pathload, pathChirp, IGI-PTR and iperf. However, these studies are limited only to available bandwidth estimation. The study in [19] compares the end-to-end capacity estimation tools PPrate, nettimer and MultiQ. This work is exclusively limited to passive tools. The study in [31] only covers two metrics including per-hop capacity and end-to-end available bandwidth and evaluates the tools pathchar, pchar and clink for former and the tools abing, spruce, IGI and pipechar for the latter, respectively.

Nettimer - PC dpcap_client
- pathrate-sender
-
- nettimer (active) .
-
- pathchar
-
- clink
-
- pchar
-
- pathload-sender
-
- iperf-sender
192.168.3.0 / 24
Measurement traffic
DLINK Gigabit Switch 1
- pathrate-receiver
- pathload-receiver
- iperf-receiver
192 1682 0 / 24
Router 1
Router 2
DLINK Gigabit Switch 2
Transit network: C 2
Cross-traffic
D-ITG-Sender
Receiver dpcap_server
Destination network: C 3
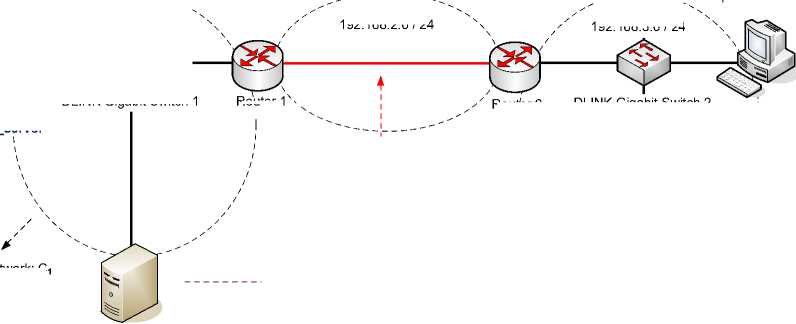
Fig.2. Overview of Testbed Setup and Configuration for Evaluating the Estimation Tools

Sender dpcap_server
192.168.1.0 / 24

Source network: C 1
D-ITG-Receiver
In contrast to all previous studies, this study (a) considers all four bandwidth-related metrics including end-to-end and per-hop capacities, end-to-end available bandwidth and end-to-end achievable throughput; (b) focuses on the most popular tools belonging to estimation methodologies including PP, SLoPS, VPS and Throughput that have gained acceptance in literature; and finally (c) classifies and experimentally evaluates all tools by using objective and sophisticated classification and evaluation schemes that have been worked out and presented in [32].
-
III. Testbed And Evaluation Methodology
This section presents details about the testbed setup and methodology used to evaluate the accuracy of estimation tools as well as their performance in terms of measurement time needed and overhead caused.
-
A. Testbed
Fig. 2 shows the common test setup used to evaluate the estimation tools. It consists of three subnetworks: source network, transit network and destination network. The sender and the receiver were connected to the source and destination networks, respectively, via a DLINK switch to make the measurement setup more realistic. Two other stations (i.e. D-ITG sender and D-ITG receiver), also connected to the DLINK switches in the source and destination networks, are used to simulate the cross-traffic during the measurements. The source and destination networks, in turn, are connected to each other via a transit network which is separated from the source and destination networks by router 1 and router 2, respectively. Table 1 gives an overview of network equipment forming the testbed along with their properties.
In order to simulate the required cross-traffic during the measurements, the Distributed Internet Traffic Generator (D-ITG) [33] was used that can generate TCP segments up to a maximum data rate of 600 Mb/s. Furthermore, tcpdump is used for monitoring and recording the network traffic to precisely determine the amount of probe traffic generated by each tool. Finally, the ethtool Unix utility was needed to set the capacity of a link to a lower value according to a measurement scenario.
Table 1. Overview of Testbed Equipment and Their Properties
|
Device |
Properties |
|
Sender and Receiver |
GHz
Ethernet Controller |
|
Switch 1 and Switch 2 |
- Manufacturer: DLINK - Model: DGS-3224TGR
|
|
Router 1 and Router 2 |
o AMD Athlon(tm) 64 X2 2.60 GHz o AMD Athlon(tm) 64 X2 2.60 GHz
Ethernet Controller |
|
D-ITG-Sender and D-ITG-Receiver |
o Intel(R) Core(TM) 2 CPU 1.83 GHz o Intel(R) Core(TM) 2 CPU 1.83 GHz
|
For pathrate and nettimer experiments, the capacities C 1 and C 3 of the source and destination networks, respectively, was set to 1 Gb/s. In contrast, the capacity C2 of the transit network, which represents the bottleneck of the path, has been reduced to 10 Mb/s. The pathrate tool, used in version 2.4.1, was installed on both the sender and receiver sides. The nettimer tool can estimate the end-to-end capacity both actively and passively. The active version of the tool runs only on the sender side. The passive version of nettimer, in contrast, consists of two types of components: packet capture servers and packet capture client. The task of packet capture servers is to record specific header fields of the incoming and outgoing packets needed to estimate the end-to-end capacity. This information includes, among other things, the source or destination IP addresses of the packets to identify matched packet pairs. In addition, the packet capture servers measure the transmission and arrival timestamps of the packet pairs when they are sent or received. These measured timestamps, along with the recorded header fields, are transmitted to the packet capture client which then uses this information to estimate the end-to-end capacity. As illustrated in Fig. 2, the packet capture servers (i.e. dpcap_servers) have been placed at the sender and receiver to measure the time differences of the packet pairs when sending or receiving. In contrast, the packet capture client was installed on a separate station, referred to as Nettimer-PC, which can be reached from source and destination networks. The nettimer tool was used in version 2.3.8.
For pathchar, pchar and clink experiments, the capacities C 1 and C 3 of the source and destination networks, respectively, have been set to 100 Mb/s. The capacity C 2 of the transit network, in contrast, was reduced to 10 Mb/s. All three tools measure the per-hop capacities using the ICMP Time Exceeded mechanism [7] so the tools need to be executed only on the sender side. The tools pathchar, pchar and clink are used in version 3.0, 1.5 and 1.0, respectively.
Finally, for pathload and iperf experiments, the capacities C1 and C3 of the source and destination networks, respectively, have been adjusted to 1 Gb/s. The capacity C 2 of the transit network, in contrast, has been reduced to 100 Mb/s. The pathload and iperf tools were installed on both the sender and receiver sides, and are used in version 1.3.2 and 2.0.4, respectively.
-
B. Methodology
A slightly revised version of classification and evaluation schemes proposed in [32] was used to evaluate the estimation tools. The classification scheme includes various aspects including basic classification criteria such as the metric to be estimated, estimation technique used, whether the measurement is carried out actively or passively, or whether the estimation methodology can work in uncooperative environments or on asymmetric links. These basic classification criteria are accompanied by tool-specific criteria such as the protocol used, deployment requirements, privileges needed to run the tool and the layer at which the metric is estimated.
The evaluation scheme includes the assessment of the estimation accuracy with and without cross-traffic scenarios, the total measurement time required, and the amount of actively generated measurement traffic. Particularly, the estimation accuracy specifies the percentage by which the tool's estimate deviates from the reference value of the metric being estimated. In this case, no cross-traffic is generated during the measurement, so that only the measurement traffic is present on the path between the sender and the receiver. Measurement accuracy with cross-traffic, in contrast, allows investigating how much the estimation accuracy of that tool is affected if there is cross-traffic on the path during the measurement. The rate of the cross-traffic to be generated is varied to determine from which rate a tool starts to provide unreliable measurement results. The required measurement time indicates how much time a tool takes in total to produce an estimate and is specified in seconds or minutes depending on the tool being evaluated. Finally, amount of actively generated measurement traffic specifies the amount of traffic that an active tool generates to produce an estimate and is measured in KB or MB depending on the tool being evaluated. A detailed description of the classification and evaluation scheme criteria can be found in [32].
For pathrate and nettimer experiments, initially no cross-traffic was generated during measurements, so that only the measurement traffic was present on the path between sender and receiver. The measurements were repeated 10 times. Thereafter, the influence of crosstraffic on the measurements was observed. To generate the required cross-traffic, two separate stations (i.e. D-ITG sender and D-ITG receiver) were used, as illustrated in Fig. 2. The cross-traffic generated by the D-ITG sender was sent to the D-ITG receiver over the same path on which the measurement process was taken place.
For pathchar, pchar and clink experiments, two variants of the testbed scenario were considered. Particularly, it has already been mentioned in [34] that a measurement by VPS can lead to a considerable underestimation of the capacity if the measured path contains store-and-forward switches. To further analyze the effect of the store-and-forward switches, use cases with and without the two DLINK switches in the source and destination networks were evaluated.
Finally, for the pathload and iperf experiments, the same measurement methodology was applied. Particularly, by using the D-ITG tool, cross-traffic with different constant rates was generated on the path between sender and receiver. Changing the cross-traffic rate from 100 to 0 Mb/s on a 100 Mb/s path causes the available bandwidth of this path to vary accordingly from 0 to 100 Mb/s. During the measurements with the pathload tool, the interrupt coalescence function of all used NICs was switched off. If this feature is not disabled, the tool yields inconsistent measurement results or even crashes during the measurements.
An important question when evaluating the accuracy of estimation tools is on which layer a metric is estimated by a tool. A link on layer 2 normally transports the data at a
Table 2. Assessing PP-based and VPS-based Tools According to the Classification Scheme
|
pathrate |
nettimer (active) |
nettimer (passive) |
pathchar, pchar and clink |
|
|
Metric |
capacity |
|||
|
End-to-end vs. Per-hop |
End-to-end |
Per-hop |
||
|
Methodology |
PP |
VPS |
||
|
Active / Passive |
Active |
Passive |
Active |
|
|
Protocol |
UDP & TCP |
TCP |
UDP |
|
|
Works on asymmetrical links |
No |
Yes |
No |
|
|
Deployment |
Sender & Receiver |
Sender |
RBPP: Sender & Receiver SBPP: Sender ROPP: Receiver |
Sender |
|
Layer |
3 |
2 |
3 |
|
|
Root-Privileges |
Yes |
Yes |
Yes |
|
constant rate. For example, with 10Base-T Ethernet, this constant transmission rate is 10 Mb/s. This is the raw capacity of this link on layer 2, also referred to as nominal bandwidth. However, as compared to its nominal bandwidth this link provides less capacity to the overlying IP layer because the overhead caused by layer 2 has a reducing effect on the capacity of layer 3. Analogously, the IP layer provides the overlying transport layer even less capacity as the overhead caused by the IP leads to a further reduction in usable capacity for the transport layer. Thus, it is significant to first determine the theoretical capacity on the IP and transport layers. These theoretically maximum capacities become the reference values against which the produced estimations of the seven tools are compared.
Pathrate, the active version of nettimer, pathchar, pchar and clink estimate the capacity on the IP layer. Consequently, the maximum capacity usable for these tools on the IP layer is 9.75 Mb/s for 10Base-T Ethernet.
The passive version of nettimer, in contrast, measures the end-to-end capacity on layer 2 which provides a maximum capacity of 10 Mb/s. The pathload tool estimates the end-to-end available bandwidth on the IP layer. The theoretically highest available bandwidth on the IP layer has been calculated as 97.52 Mb/s for Fast Ethernet. Similarly, the iperf tool measures the achievable throughput at the transport layer. The theoretical maximum TCP throughput on the transport layer is 96.22 Mb/s for Fast Ethernet.
-
IV. Results And Discussion
This section is divided into two subsections. The first one briefly introduces the estimation tools and categorizes them by using several objective classification criteria. Subsequently, the second subsection presents the evaluation results and discussion.
-
A. Tool Classification
For the PP approach, the tools pathrate and nettimer were evaluated. The regular PP principle measures the time difference between the packet pair, which is actively sent by the sender, on arrival at the receiver. This measurement method is referred to as Receiver Based PP (RBPP). Consequently, RBPP assumes that the measurement software is used at the sender and receiver sides. However, this ideal condition is not always given in practice. Often one is only the sender or only the receiver, so that the PP software can only be used on one side or measurement is only possible through the passive analysis of existing traffic. In order to be able to use the PP technique even in such circumstances, two further measurement methods, i.e. Sender Based PP (SBPP) and Receiver Only PP (ROPP) were presented [35].
Pathrate is an active tool that estimates the end-to-end capacity using the RBPP method. Consequently, this tool must be executed on both the sender and the receiver side. Pathrate estimates the end-to-end capacity in the downstream direction, i.e. for the path from the sender to the receiver. Pathrate performs the measurement using the UDP protocol. In addition, a TCP connection serves as a control channel. The active version of the nettimer tool estimates the end-to-end capacity using the SBPP method, so the tool runs only on the sender side. The passive version of the nettimer tool can estimate this metric with all possible estimation methods (i.e. using RBPP, SBPP and ROPP). The measurement can be conducted in both the downstream and upstream directions by simply monitoring and analyzing TCP traffic.
For the VPS technique, three different implementations including pathchar, pchar and clink were evaluated. All three tools are executed only on the sender side and actively estimate the per-hop capacities of a path in the downstream direction. The measurements are performed by default with the UDP protocol. All tools need root privileges when running. Table 2 shows the assessment of each tool according to the classification scheme.
Pathload actively estimates the end-to-end available bandwidth in the downstream direction and performs the measurement using the UDP protocol. As in the case with pathrate, an additional TCP connection serves as a control channel. This tool does not need root privileges when running. Similarly, the iperf tool must be executed on both sender and receiver sides. Iperf can measure the achievable throughput in both the downstream and
Table 3. Assessing Pathload and Iperf Tools According to the Classification Scheme
|
Pathload |
Iperf |
|
|
Metric |
Available bandwidth |
Achievable throughput |
|
End-to-end vs. Per-hop |
End-to-end |
End-to-end |
|
Methodology |
SLoPS |
Throughput |
|
Active / Passive |
Active |
Active |
|
Protocol |
UDP & TCP |
TCP |
|
Works on asymmetrical links |
No |
yes |
|
Deployment |
Sender & Receiver |
Sender & Receiver |
|
Layer |
3 |
4 |
|
Root-Privileges |
No |
No |
upstream directions. During execution, no root privileges are required. Table 3 shows the assessment of the pathload and iperf tools according to the classification scheme.
-
B. Experimental Evaluation
The average estimates of pathrate and nettimer tools are shown in Table 4. These average values were obtained by repeating the measurements 10 times for each generated cross-traffic rate. The constant crosstraffic was generated at rates of 1, 3, 5 and 7 Mb/s. The measurement error indicates the percentage by which the estimation of the tool deviates from the reference value (= 9.75 Mb/s).
As is seen in Table 4, the pathrate tool provides accurate estimation results regardless of the rate of crosstraffic generated by the D-ITG tool. In contrast, the results of nettimer's estimations were consistently underestimated. This observation indicates that the packet pairs sent by nettimer were separated by cross-traffic packets. Consequently, the time differences between these transmitted packet pairs are increased by the size of these additional packets which ultimately leads to an underestimation of the end-to-end-capacity. However, despite the slight underestimation of the end-to-end capacity, it can be concluded that the active version of nettimer can produce estimates within limits of acceptable errors.
The duration of the measurement with pathrate tool can vary in length. This tool initially performs a certain number of pre-measurements. If, after these premeasurements, the detected noise remains below a certain limit, the measurement is completed immediately and an estimate of the end-to-end capacity is delivered. This case occurs if there is no or little cross-traffic on the measurement path. In such a case, pathload took an average of 47 seconds to produce an estimate. However, if the detected noise in the measurement results is too high, pathrate will carry out 1000 more measurements. This significantly increases the measurement time required by this tool. In this case, a measurement on the average took about 18 minutes.
Unlike the pathrate tool, the active version of the nettimer always performs only 8 packet pair measurements regardless of the noise detected in the measurement results. For this reason, conducting a measurement with this tool only takes approximately one second. This tool generated about 10 KB of measurement traffic and 32 packets (8 packet pairs + 8 confirmation pairs). Table 5 summarizes the results of pathload and nettimer (active version) in terms of measurement times required and probing overhead caused.
Finally, the passive version of the nettimer tool was evaluated. To simulate the normal network traffic from which the nettimer tool passively measured the end-to-end capacity, the sender sent a 5 GB ISO image to the receiver with the help of scp command. The transfer was terminated after exactly 5 minutes, even if the ISO image was not completely transferred.
Table 6 shows that the estimation accuracies of RBPP and ROPP are comparable. In contrast to RBPP and ROPP, the estimate of SBPP is slightly inaccurate, since cross-traffic affects the measurement not only in the forward path but also in the reverse path.
The results of the per-hop capacity estimations with pathchar, pchar and clink are summarized in Table 7. It is seen that the capacities of the first and third hops were strongly underestimated by all three tools. This is caused by the fact that these two hops contain store-and-forward switches. These switches cause extra transmission delay which is not considered in VPS's model, as also reported in [36]. Consequently, due to this extra transmission delay, the RTT's for the two hops are overestimated which leads to an underestimation of the hop capacity. In contrast, the direct link between router 1 and router 2 does not contain a store-and-forward switch and comparatively has a lower capacity of 10 Mb/s. In this case, the estimation of the pathchar tool deviates from the reference value by only 1.5%. The pchar tool underestimates this reference value by 4.6% and the clink tool by 24.1%.
The same measurements were repeated after the D-LINK switches were removed from the source and destination networks. Table 8 shows the measurement results.
In this case, the first and third hop measurements obtained by all three tools are comparatively much more accurate. For example, the estimation of the pathchar tool for the first link is 79 Mb/s. However, in the previous experiment for the same hop with DLINK switch usage, this tool delivered a capacity estimate of only 43.3 Mb/s. The measurements with the other two tools gave similar results. The estimation results presented in Table 7 show that the effects of such store-and-forward switches can lead to significantly underestimated per-hop capacities of up to 37% in the worst-case scenario. Nonetheless, it should be noted that these tools do not measure the 100 Mb/s capacity accurately even if the path does not contain store-and-forward switches.
The influence of cross-traffic on the measurements was also observed. During the measurements, cross-traffic with constant rates of 1, 3, 5 and 7 Mb/s was generated on the path. However, it was observed that these crosstraffic rates did not significantly affect the estimation accuracies. This observation indicates that at least one RTT measurement, which is repeated several times per packet size, reaches the receiver without queuing delay despite the prevalent cross-traffic on the measurement path.
The total duration of a measurement with the VPS method depends mainly on three factors including (a) number of hops to be measured; (b) number of different packet sizes; and finally (c) number of measurements repeated per packet size. The pathchar tool sends 45 different packet sizes, while this number for pchar is 46. Both tools repeat the measurement per packet size 32 times. Unlike the two tools, the clink tool sends 96 different packet sizes, but repeats the measurement 8 times per packet size only. Accordingly, it can be deduced that the pathchar tool performs 45 * 32 = 1440 RTT measurements, the pchar tool conducts 46 * 32 = 1472 RTT measurements and finally the clink tool carries out 96 * 8 = 768 RTT measurements per hop. This large number of RTT measurements implies that the total duration of a measurement using the VPS method is very high, as presented in Table 9.
Table 10 and Table 11 show the results of pathload and iperf tools for estimating the end-to-end available bandwidth and achievable throughput, respectively. The cross-traffic required for the measurements was generated at 8 different constant rates so that a total of 8 different end-to-end available bandwidths and achievable throughputs were to be estimated. As in the previous experiments, the measurements per available bandwidth and achievable throughput were repeated 10 times, the average of which was used to calculate the final results.
According to the results presented in Table 10, it can be concluded that pathload provides accurate measurement results when there is little or no crosstraffic on the measurement path. The higher the crosstraffic rate, the more the estimates deviate from the corresponding reference values. The iperf tool even provides more accurate estimates. In the worst case, the estimates deviate from the reference value by no more than 2%.
For the measurement scenario shown in Fig. 2, the pathload tool needed 32 seconds to provide an estimate for the end-to-end available bandwidth, generating approximately 7.2 MB of measurement traffic and 8984 packets. In contrast, the iperf tool required 10 seconds of measurement time to estimate the end-to-end achievable
TCP throughput, producing approximately 121 MB of measurement traffic and 118469 packets.
Table 4. Evaluating the Estimation Accuracy of Pathrate and Nettimer (Active Version)
|
Tool |
Cross-Traffic Rate (Mb/s) |
Estimated End-to-End Capacity (Mb/s) |
Measurement Error (%) |
|
pathrate |
- |
9,77 |
0,10 |
|
1 |
9.74 |
0.10 |
|
|
3 |
9.76 |
0.10 |
|
|
5 |
9.74 |
0.10 |
|
|
7 |
9.76 |
0.10 |
|
|
nettimer (active) |
- |
9,63 |
1,23 |
|
1 |
9.34 |
4.2 |
|
|
3 |
9.42 |
3.3 |
|
|
5 |
9.47 |
2.8 |
|
|
7 |
9.52 |
2.3 |
Table 5. Measurement Times and Amount of Active Traffic Generated by Pathrate and Nettimer
|
Tool |
Measurement time |
Number of packets |
Volume |
|
pathrate (case 1) |
47 s |
1295 |
1.2 MB |
|
pathrate (case 2) |
18 m |
37351 |
43 MB |
|
nettimer (active version) |
≈1s |
32 |
10 KB |
Table 6. Evaluating the Estimation Accuracy of Nettimer (Passive Version)
|
Methodology |
Estimated End-to-end capacity (Mb/s) |
Measurement Error (%) |
|
RBPP |
9.75 |
2.5 |
|
SBPP |
9.57 |
4.3 |
|
ROPP |
9.74 |
2.6 |
Table 7. Evaluating the Estimation Accuracy of Pathchar, Pchar and Clink (Without Cross-Traffic and with Store-and-Forward Switches on the Path)
|
Tool |
Hop |
Estimated per-Hop Capacity (Mb/s) (without D-LINK-Switches) |
Measurement Error (%) |
|
pathchar |
1 |
43.3 |
55.5 |
|
2 |
9.6 |
1.5 |
|
|
3 |
41.6 |
57.3 |
|
|
clink |
1 |
33.3 |
65.8 |
|
2 |
7.4 |
24.1 |
|
|
3 |
31.7 |
67.4 |
|
|
pchar |
1 |
44.8 |
54.0 |
|
2 |
9.3 |
4.6 |
|
|
3 |
37.4 |
61.6 |
Table 8. Evaluating the Estimation Accuracies of Pathchar, Clink und Pchar (Without Cross-Traffic and Store-and-Forward Switches)
|
Tool |
Hop |
Estimated per-Hop Capacity (Mb/s) (with D-LINK-Switches) |
Measurement Error (%) |
|
pathchar |
1 |
79 |
18.9 |
|
2 |
9.6 |
1.5 |
|
|
3 |
70 |
28.2 |
|
|
clink |
1 |
61.5 |
36.9 |
|
2 |
7.4 |
24.1 |
|
|
3 |
55.2 |
43.3 |
|
|
pchar |
1 |
77 |
21 |
|
2 |
9.3 |
4.6 |
|
|
3 |
70.3 |
27.8 |
Table 9. Measurement Times and Amount of Active Traffic Generated by Pathchar, Clink and Pchar
|
Tool |
Measurement time (min) |
Number of packets |
Volume (MB) |
|
pathchar |
63 |
8415 |
5.14 |
|
clink |
37 |
5823 |
3.63 |
|
pchar |
59 |
8387 |
5.04 |
Table 10. Evaluating the Estimation Accuracy of Pathload
|
CrossTraffic Rate (Mb/s) |
Theoretical Maximum End-to-End Available Bandwidth (Mb/s) |
Estimated End-to-End Available Bandwidth (Mb/s) |
Measure ment Error (%) |
|
- |
97.52 |
96.59 |
0.9 |
|
10 |
87.52 |
87.40 |
0.1 |
|
20 |
77.52 |
75.44 |
2.6 |
|
30 |
67.52 |
65.05 |
3.6 |
|
40 |
57.52 |
54.43 |
5.3 |
|
50 |
47.52 |
44.03 |
7.3 |
|
60 |
37.52 |
32.69 |
12.8 |
|
70 |
27.52 |
22.86 |
16.9 |
Table 11. Evaluating the Estimation Accuracy of Iperf
|
CrossTraffic Rate (Mb/s) |
Theoretical Maximum End-to-End Achievable Throughput (Mb/s) |
Estimated End-to-End Achievable Throughput (Mb/s) |
Measure ment Error (%) |
|
- |
96.22 |
94.82 |
1.4 |
|
10 |
86.22 |
84.81 |
1.6 |
|
20 |
76.22 |
74.95 |
1.6 |
|
30 |
66.22 |
64.87 |
2.0 |
|
40 |
56.22 |
55.12 |
1.9 |
|
50 |
46.22 |
45.96 |
0.5 |
|
60 |
36.22 |
35.74 |
1.3 |
|
70 |
26.22 |
25.70 |
1.9 |
-
V. Conclusion And Future Work
In this study, seven popular tools belonging to four well-known estimation techniques including PP, VPS, SLoPS and Throughput were experimentally evaluated. For the PP approach the pathrate and nettimer tools were evaluated in a controlled testbed environment. The results of the evaluation showed that the pathrate tool provides very consistent and accurate measurement results, even if there is a lot of cross-traffic on the measurement path. However, the tool must be executed on both the sender and the receiver side. For this reason, the use of pathrate is very limited. In contrast, the active version of the nettimer tool must be run only on the sender side because it performs the measurement with the SBPP method. The tool determines the end-to-end capacity for the measurement path from the sender to any receiver. Thus, communication paths that are of interest to the user become measurable. However, the results showed that the tool slightly underestimates end-to-end capacity if there is cross-traffic on the measurement path. The passive version of nettimer provides the highest level of deployment flexibility, enabling to run the methodology only on sender or receiver side without perturbing the network traffic from other users. However, because of its passive nature, nettimer has no control over the traffic pattern and duration. Consequently, existing traffic might not be suitable for the tool to produce an accurate estimate. For VPS approach the tools pathchar, pchar and clink were evaluated. It turned out that all three tools provide very inaccurate estimates when the path to be measured contains store-and-forward switches and/or the per-hop capacities to be estimated are too high. The SLoPS technique determines the end-to-end available bandwidth between two hosts. For this approach the pathload tool was evaluated. This tool provides consistent and accurate estimation results if there is little or no cross-traffic on the measurement path. As the crosstraffic rate increases, so does the inaccuracy of the produced estimations. It has also been observed that pathload is unable to estimate the available bandwidth correctly if the interrupt coalescence feature of the used NICs is not deactivated. In such cases, the tool often crashed or yielded very inaccurate estimates, as the oneway delays for the transmitted packet sequences could no longer be measured properly. Finally, the Throughput technique actively overloads a TCP connection to calculate the achievable throughput between two hosts. This approach is implemented by the iperf tool. Although iperf provides very accurate throughput estimates, its measurement methodology has the disadvantage that the normal network traffic is significantly disturbed by the active overloading of the TCP connection.
This study evaluated and compared seven different estimation tools on wired Ethernet network environment. As an outlook, it is also possible to evaluate these tools with respect to wireless transmission techniques (e.g. 3G/UMTS and 4G/LTE). Some tools can also estimate bandwidth-related metrics of asymmetric links, i.e. the measurement is conducted not only for the path from the sender to the receiver, but also in the opposite direction to estimate the upload rate. In this respect, it would also be interesting to evaluate and compare such tools on asymmetric paths (such as via ADSL links). The estimation accuracy of the seven tools was only evaluated with respect to 10 Mb/s or 100 Mb/s link capacities. It should be checked whether these tools can also provide accurate estimation results if the capacity to be estimated provide significantly higher transmission speeds (e.g. 10 Gigabit Ethernet). As another future work, commercial bandwidth estimation tools can also be included in the experiments.
References An experimental evaluation of tools for estimating bandwidth-related metrics
- R. Prosad et al., “Bandwidth estimation: metrics, measurement techniques, and tools,” IEEE Netw., vol. 17, no. 6, pp. 27–35, 2003.
- A. S. Sairam, “Survey of Bandwidth Estimation Techniques,” Wirel. Pers. Commun., pp. 1425–1476, 2015.
- M. Jain and C. Dovrolis, “End-to-end available bandwidth: Measurement methodology, dynamics, and relation with TCP throughput,” IEEE/ACM Trans. Netw., vol. 11, no. 4, pp. 537–549, 2003.
- C. Dovrolis, P. Ramanathan, and D. Moore, “Packet-dispersion techniques and a capacity-estimation methodology,” IEEE/ACM Trans. Netw., vol. 12, no. 6, pp. 963–977, 2004.
- K. Lai and M. Baker, “Nettimer: A tool for measuring bottleneck link bandwidth,” in Proceedings of the USENIX Symposium on Internet Technologies and Systems, 2001, vol. 134, pp. 1–12.
- C. Dovrolis, P. Ramanathan, and D. Moore, “What do packet dispersion techniques measure?,” Proc. - IEEE INFOCOM, vol. 2, pp. 905–914, 2001.
- A. B. Downey, “Using pathchar to estimate Internet link characteristics,” ACM SIGCOMM Comput. Commun. Rev., vol. 29, no. 4, pp. 241–250, 1999.
- B. A. Mah, “pchar: A Tool for Measuring Internet Path Characteristics,” 2001. [Online]. Available: http://www.employees.org/?bmah/software/pchar.
- A. B. Downey, “Clink,” 1999. [Online]. Available: http://rocky.xn--wellesley-3ma.edu/ ~downey/clink.
- M. Jain and C. Dovrolis, “Pathload: a measurement tool for end-to-end available bandwidth,” in Proceedings of the Passive and Active Measurements (PAM) Workshop, 2002, pp. 1–12.
- A. Tirumala, L. Cottrell, and T. Dunigan, “Measuring end-to-end bandwidth with Iperf using Web100,” Proc. Passiv. Act. Meas. Work., pp. 1–8, 2003.
- M. Koubàa, N. Amdouni, and T. Aguili, “Efficient Traffic Engineering Strategies for Optimizing Network Throughput in WDM All-Optical Networks,” Int. J. Comput. Netw. Inf. Secur., vol. 7, no. 6, pp. 39–49, May 2015.
- K. Ahuja, B. Singh, and R. Khanna, “Available Link Bandwidth Based Network Selection in Multi-access Networks,” Int. J. Intell. Syst. Appl., vol. 6, no. 3, pp. 76–83, Feb. 2014.
- E. Yildirim and T. Kosar, “End-to-End Data-Flow Parallelism for Throughput Optimization in High-Speed Networks,” J. Grid Comput., vol. 10, no. 3, pp. 395–418, Sep. 2012.
- V. Gaur, P. Dhyani, and O. P. Rishi, “A Multi-Objective Optimization of Cloud Based SLA-Violation Prediction and Adaptation,” Int. J. Inf. Technol. Comput. Sci., vol. 8, no. 6, pp. 60–65, Jun. 2016.
- S. Saroiu, P. Gummadi, and S. Gribble, “Sprobe: A fast technique for measuring bottleneck bandwidth in uncooperative environments,” IEEE INFOCOM, pp. 1–11, 2002.
- R. Kapoor, L. Chen, and M. Gerla, “CapProbe?: A Simple and Accurate Capacity Estimation Technique,” in Proceedings of Applications, technologies, architectures, and protocols for computer communications, 2004, pp. 67–68.
- L. Chen, T. Sun, G. Yang, M. Y. Sanadidi, and M. Gerla, “End-to-End Asymmetric Link Capacity Estimation,” in IFIP Networking, 2005, pp. 780–791.
- T. En-Najjary and G. Urvoy-Keller, “Passive capacity estimation: Comparison of existing tools,” in International Symposium on Performance Evaluation of Computer and Telecommunication Systems, 2008.
- S. Katti, D. Katabi, C. Blake, E. Kohler, and J. Strauss, “MultiQ: automated detection of multiple bottleneck capacities along a path,” IMC ’04 Proc. 4th ACM SIGCOMM Conf. Internet Meas., pp. 245–250, 2004.
- N. Hu and P. Steenkiste, “Estimating Available Bandwidth Using Packet Pair Probing,” Security, p. 28, 2002.
- J. Strauss, D. Katabi, and F. Kaashoek, “A measurement study of available bandwidth estimation tools,” in Proceedings of the ACM SIGCOMM Internet Measurement Conference, IMC, 2003, pp. 39–44.
- J. Sommers, P. Barford, and W. Willinger, “A proposed framework for calibration of available bandwidth estimation tools,” in Proceedings - International Symposium on Computers and Communications, 2006, pp. 709–718.
- E. Goldoni, G. Rossi, and A. Torelli, “Assolo, a New Method for Available Bandwidth Estimation,” Fourth Int. Conf. Internet Monit. Prot., pp. 130–136, 2009.
- M. ?adyga, R. H. Riedi, R. G. Baraniuk, J. Navratil, and L. Cottrell, “pathChirp: Efficient Available Bandwidth Estimation for Network Paths,” in Passive and Active Measurement Workshop, 2003.
- A. Johnsson, B. Melander, M. Bj?rkman, and M. Bjorkman, “DietTopp?: A first implementation and evaluation of a simplified bandwidth measurement method,” Proc. 2nd Swedish Natl. Comput. Netw. Work., pp. 1–5, 2004.
- “Test TCP (TTCP) Benchmarking Tool for Measuring TCP and UDP Performance,” 2005. [Online]. Available: http://www.pcausa.com/-Utilities/pcattcp.htm.
- R. Jones, “The netperf website,” 2005. [Online]. Available: http://www.netperf.org/.
- C. U. Castellanos, D. L. Villa, O. M. Tyeb, J. Elling, and J. Wigard, “Comparison of Available Bandwidth Estimation Techniques in Packet-Switched Mobile Networks,” 17th Annu. IEEE Int. Symp. Pers. Indoor andMobile Radio Commun., pp. 1–5, 2006.
- H. Young-Tae, L. Eun-Mi, P. Hong-Shik, R. Ji-Yun, K. Chin-Chol, and S. Myung-Won, “Test and Performance Comparison of End-to-End Available Bandwidth Measurement Tools,” Adv. Commun. Technol. 2009. ICACT 2009. 11th Int. Conf., pp. 370–372, 2009.
- Y. Labit, P. Owezarski, and N. Larrieu, “Evaluation of active measurement tools for bandwidth estimation in real environment,” in 3rd IEEE/IFIP Workshop on End-to-End Monitoring Techniques and Services, E2EMON, 2005, vol. 2005, pp. 71–85.
- F. Abut, “Towards a Generic Classification and Evaluation Scheme for Bandwidth Measurement Tools,” Signals Telecommun. J., vol. 1, no. 2, pp. 78–88, 2012.
- A. Botta, A. Dainotti, and A. Pescapé, “A tool for the generation of realistic network workload for emerging networking scenarios,” Comput. Networks, vol. 56, no. 15, pp. 3531–3547, Oct. 2012.
- R. S. Prasad, G. Tech, and B. A. Mah, “The effect of layer-2 store-and-forward devices on per-hop capacity estimation,” in INFOCOM, 2003, pp. 2090–2100.
- K. Lai and M. Baker, “Measuring bandwidth,” Proc. - IEEE INFOCOM, vol. 1, pp. 235–245, 1999.
- R. S. Prasad, C. Dovrolis, and B. A. Mah, “The effect of layer-2 switches on pathchar-like tools,” Proc. Second ACM SIGCOMM Work. Internet Meas. - IMW ’02, no. 5, p. 321, 2002.
