An Experimental Study on College Teacher's Adoption of Instructional Technology

Author: Du Chuntao
Journal: International Journal of Modern Education and Computer Science (IJMECS) @ijmecs
Article in issue: 3 vol.3, 2011.
Free access
Instructional technology can make teachers do their jobs easier, better, faster and more effectively. Students can also benefit from its application. However, some college teachers do not adopt instructional technologies in their teaching as we expected. They like to teach the way they were taught as students before. Why and what factors really influence their adoption of instructional technology? This study offered a model suggestiong instructional technology adoption by college teachers depends on: the student, the teacher, the technology and the surroundings. An experiment was designed to verify the model. Samples were selected from teachers at a mid-sized university. Experimental data was collected by interviewing fifteen teachers (samples). Those interviewed represented five high-level users, five medium-level users, and five low-level users of instructional technology. Quantitative methods such as frequency counting were used to analyze and sort the data. Finally, conclusions can be drawn that different components in the model had different influential degree to the different levels of users of instructional technology.
Experimental study, college teache, adoption, instructional technology.
Short address: https://sciup.org/15010210
IDR: 15010210
Text of the scientific article An Experimental Study on College Teacher's Adoption of Instructional Technology
Published Online June 2011 in MECS
Institutions appear to be responding to the calls for reform in teaching practices, to a greater or lesser degree; by investing in what research indicates may be technological solutions. A rationale frequently cited in the literature for the development and propagation of instructional technology is that it can be used to engage students in the learning process to a much greater extent than traditional teaching methods, such as lecturing [1][2][3]. Technology can be used to help faculty better manage their teaching duties by effectively augmenting the lectures they give [4]. Or, since students remember so little of what is taught via conventional methods [5], the professorial role in the classroom could perhaps even evolve from that of a “sage on the stage” to a “guide on the side” [6]. Faculty could use technology to foster resource-based learning [7] and information literacy [8][9], allowing students to become more independent, self-directed [10][11] and self-regulated learners [12].
Instructions are making tremendous investments of limited resources in technologies many faculties are apparently not using. Moore [13] suggests that one of our biggest modern-day dilemmas is getting the majority of mainstream, non-adopters to “cross the chasm” that separates them from the few early adopters of an innovation such as instructional technology. Apparently, the simple acquisition of technology does not promote learning; an institution’s faculty is the key to the realization of instructional technology’s potential [14].
All in all, despite significant investments, the vast majority of professors does not use technology inside the classroom or assign it for use in the pursuit of course assignments. How and why is it, then, that some faculties decide to adopt technology for instructional purpose while others do not? The focus of this study was on the faculty’s adoption of instructional technologies by capitalizing on an experiment.
This paper offered a model suggesting instructional technology adoption by higher education faculty members depends on: the student, the teacher, the technology, and the surroundings. Data was collected for this study by interviewing fifteen teachers at mid-sized North China University of Technology. Teachers interviewed represented five high-level users, five medium-level users, and five low-level users of instructional technology. The study used quantitative methods such as frequency counting in the analysis to sort the data and identify patterns or differences.
The primary purpose of this research is to provide information about factors that influence college teacher’s adoption of instructional technology. By studying these factors, administrators and educators may better promote or encourage the adoption of instructional technologies among college teachers.
-
II. literature review
-
A. Definition of instructional technology
The 1994 definition by Seels and Richey [15] is as follows: “Instructional Technology is the theory and practice of design, development, utilization, management, and evaluation of processes and resources for learning”. The definition emphasized on process and resources for learning and they purposely excluded the word systematic in order to reflect constructivist rather than linear step-by-step or systematic approaches.
In this study, instructional technologies are referred to as synonymous with innovation. Though not entirely new, they are typically perceived as current E-Learning and M-Learning etc. This is compared with traditional technologies of instruction such as chalkboards, overhead projection units, and textbooks. It will include medium of technology such as audio, video, multimedia, distance learning, computer-based learning (CBL), computerbased training (CBT), computer-supported collaborative learning (CSCL), technology-enhanced learning (TEL), blended learning, virtual learning environment (VLE), learning management system (LMS), learning content management system (LCMS), computer-aided assessment, electronic performance support systems (EPSS), mobile phones, PDAs, digital audio players, digital cameras, voice recorders, pen scanner and so on.
-
B. Adoption of instructional technology
Decisions to use instructional technology, whether for instructional delivery or organizing and planning lessons, should be an integral part of the design of instruction or the planning phases of teaching. One of the most challenging decisions facing the instructional designer or teacher is what medium to use. Technologies and materials must be examined, considering factors like specific objectives of the lessons and the needs of the learners [16]. From a systematic instructional design perspective, the decision is dependent on knowledge of what is being taught, how it is taught, knowledge of the learners, the learning situation, and many related factors. Unfortunately, the decision is often taken lightly, done either before or early in the design process, without consideration of all the factors involved [17]. For example, rationale for a media selection decision may be “we have a video, let's show it” or “we are getting some computers, let's use them in this class” instead of careful planning and consideration of the factors involved.
Instructional design literature provides some recommendations and guidelines for adoption of instructional media and incorporating it into classroom instruction. The literature also emphasizes planning and addressing factors in the learning process that are directly affected by using instructional technologies. Though it does not necessarily address theoretical explanations of instructional technology use, the literature offers many taxonomic classifications, conceptual frameworks, and theoretical systems that offer some insight to faculty members deciding to use instructional technology. Some examples follow.
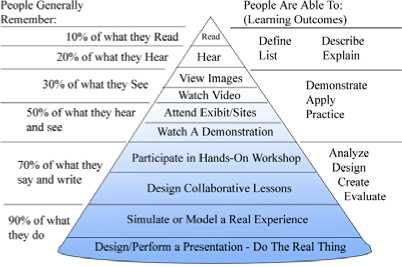
Figure 1. Dale’s Cone of Experience
Dale's Cone of Experience (shown as picture 1) [18] is a model that incorporates several theories related to instructional design and learning processes. During the
Reigeluth’s Elaboration Theory [19] includes four major aspects of instruction that are of importance in instructional design theory ways of organizing instruction, ways of delivering instruction which can be broden down further into micro strategies and macro strategies. Micro strategies concentrate on organizing instruction on a single topic and include strategy components such as definitions, examples, and practice. Macro strategies organize instruction to show interrelationships among the aspects of the subject-matter content. On a practical level, micro strategies give guidelines for how to teach specific subject-matter content, whereas macro strategies show how to organize and sequence subject-matter content. One might consider micro strategies internally oriented, since they concentrate on a single concept or principle, and macro strategies as externally oriented, since they take a more global approach that considers the relatedness of all aspects of a body of knowledge.
Keller’s motivational-design model [20] addresses the motivational aspects of the student that the instructional designer or teacher must consider in planning instruction. According to John Keller’s ARCS Model of Motivational Design, there are four steps for promoting and sustaining motivation in the learning process: Attention, Relevance, Confidence, and Satisfaction (ARCS).
This literature assumes that, if faculty members and teachers have these options, they will use instructional technology. It assumes that if it is available and appropriate, faculty members or teachers will adopt it. Yet do they? Are people going to adopt the recommendations or guidelines to integrate instructional technology into their teaching? What if faculty members or teachers think their time can be better spent? Are the faculty members or teachers convinced the technology is effective and efficient? The literature does not ask why some people do or do not adopt instructional technology. Though guidelines and recommendations may be available, if the guidelines do not take into consideration the immediate situation or make sense, then these guidelines are not going to be used.
-
III. Conceptual Model
The model for this investigation of instructional technology is derived from experience, survey results, diffusion theory, social learning theory, and expectancyvalue theory. The model for this study proposes that four primary areas influence the process by which a college teacher becomes aware of, evaluates, and decides to adopt or not to adopt a newer instructional technology. These are Student , Teacher , Technology , and Surroundings . The relationship between them is shown as picture 2.
Student - a recipient of the instructional material and the focus of the instructional process. Examples of things considered in Student are listed in table I.
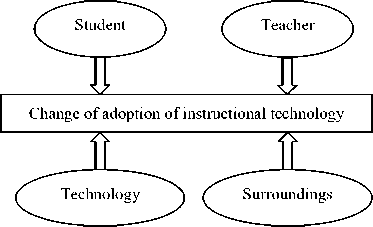
Figure 2. Conceptual model of influencing college teacher’s adoption of instructional technology
TABLE I. Examples of things considered in student
|
Examples |
Explanation |
|
Student knowledge |
How the teacher perceives the student's knowledge and expertise with technology such as computers; for example if the student is computer literate as defined by the teacher. |
|
Student motivation |
How the teacher perceives the student's drive or actions toward the learning goals. |
|
Student experience |
The experience in using a variety of technologies that may be used in the classroom. |
|
Type of student |
Whether students are considered traditional students (18-21 year old, full-time student being fully or partially supported by parents) or non-traditional (older student, working full time with outside job and family responsibilities). |
|
Student outside responsibilities |
Variety of non-school responsibilities that compete for time with the student's school demands. |
Teacher - a part of the social system and the individual using the technology. Examples of things considered in Teacher are listed in table II.
TABLE II. Examples of things considered in teacher
|
Examples |
Explanation |
|
Personal beliefs and attitudes about teaching and learning |
Whether the member holds to behavioral or cognitive theories, what the teacher thinks are the responsibilities for participants in the process. |
|
Teaching style |
Closely related to the beliefs/attitudes, for example lecture only, mix lecture and discussion, and cooperative. |
|
Class preparation |
How the teacher prepares for class, including developing materials and information gathering. |
|
Class management or organization |
What a teacher does to keep evaluation scores, student information, and similar functions: for example, the use of spreadsheets or other software. |
|
Course information gathering |
How a teacher researches the material for class; for example, whether or not he/she uses on-line resources. |
Technology - the actual instructional technology considered or applied. Examples of things considered in Technology are listed in table III.
Surroundings - the physical surroundings and the context into which the use must be incorporated. Examples of things considered in Surroundings are listed in table VI.
TABLE III. Examples of things considered inTechnology
|
Examples |
Explanation |
|
Technology anxiety |
Teacher feeling insecure in or not competent with technologies; uneasy about using to the point of fear in extreme cases. |
|
Technology knowledge |
How much the teacher knows about the technologies. |
|
Technology experience |
Actual experience using technologies in teaching. |
|
Attitude toward technology |
Teacher's internal disposition toward technology. |
|
Beliefs about technology in teaching |
Dependent on attitude toward technology, but a teacher's thoughts about the place of technology in teaching; for example, it is effective in increasing earning or more efficient. |
|
Technology interactivity |
How much does the technology allow the user to interact or participate. |
|
Technology ease of use |
Is the technology quick and simple to use; sometimes referred to as user friendly. |
|
Technology flexibility |
How responsive to change in use is the technology; can it be used in a variety of ways and settings. |
|
Technology adaptability |
How easy can it adjust to current teaching situations; depends on flexibility. |
TABLE IV. Examples of things considered in
SURROUNDINGS
-
IV. survey
In order to testify the model and decide the degree of every factor’s influence to the faculty’s decision of adoption of instructional technology, this paper conducted an experiment. To select the participants of the experiment, a survey was necessary.
-
A. Designing survey form
To identify the different use levels and select participants for the experiment, this study designed a survey form, shown as Table V. This data provided basic information about the population and a way to identify technology use levels. Technologies surveyed included audio, video, multimedia, distance learning, Computerbased Learning (CBL), Computer-Based Training (CBT), Computer-supported Collaborative Learning (CSCL), Technology-enhanced Learning (TEL), Blended learning, Virtual Learning Environment (VLE), Learning Management System (LMS), Learning Content Management System (LCMS), Computer-aided assessment, Electronic Performance Support Systems (EPSS), Mobile Phones, PDAs, Digital audio players, Digital cameras, Voice recorders and Pen scanner.
TABLE V. Survey Form
|
Section A. Knowledge and Use of Technologies Please indicate your degree of knowledge about/experience with the following technologies (DK) |
||||||||
|
No. |
Technology |
None |
A little |
Mod. |
Goo d |
Expert |
||
|
1 |
Audio |
1 |
2 |
3 |
4 |
5 |
||
|
2 |
Video |
1 |
2 |
3 |
4 |
5 |
||
|
1 |
2 |
3 |
4 |
5 |
||||
|
20 |
Pen scanner |
1 |
2 |
3 |
4 |
5 |
||
|
Please indicate how frequently you use the following technologies in your teaching (F) |
||||||||
|
No. |
Technology |
Never |
Sometimes |
Frequently |
||||
|
1 |
Audio |
1 |
2 |
3 |
||||
|
2 |
Video |
1 |
2 |
3 |
||||
|
1 |
2 |
3 |
||||||
|
20 |
Pen scanner |
1 |
2 |
3 |
||||
|
Section B. Background Information This information is requested to gain a better understanding of the population being studied. Please supply whatever background information you feel comfortable providing. |
||||||||
|
No. |
Question and choices |
|||||||
|
1 |
Discipline: (1) Business (2) Education (3) Engineering (4) Health (5) Humanities (6) Physical sci. (7) Other |
|||||||
|
2 |
Academic rand: (1) Assistant lecturer (2) Lecturer (3) Associate professor (4) Professor |
|||||||
|
3 |
Age: (1) 25-35 (2) 36-45 (3) 46-55 (4) 56- |
|||||||
|
4 |
Gender: (1) Female (2) Male |
|||||||
|
5 |
Years of teaching: (1) 1-5 (2) 6-10 (3) 11-15 (4) 16-20 (5) 20- |
|||||||
|
6 |
Do you have home computer? (1) Yes (2) No |
|||||||
|
7 |
Can you access Internet from your home? (1) Yes (2) No |
|||||||
The survey asked respondents to rate their knowledge and experience with these technologies, with one being none and five being expert. A question on the survey also asked the respondent to rate their frequency of use of the technologies, one being never and three being frequently. These were to assess the faculty member's familiarity with and use of instructional technologies.
-
B. Identifying different level of users
To decide level of use for a teacher, the response to the knowledge and experience question was multiplied by the frequency of use response for each technology questioned, shown as (1). Summing the products across all the technology questions then produced an index representing level of use for the respondent. Values ranged from 20 to 300. The lower 25% of the values represented the low level users; values in the middle 50% represented middle level users; while the upper 25% were high level users of instructional technology.
Value= 2 ( DK^ F ) (1) i = 1
DK i : Degree of knowledge about/experience with every technology. F i : Frequency of use to every technology.
-
C. Selecting participants (samples) of the experiment
After the level of the users was determined, those consenting to be interviewed were identified and their forms were separated from the total population. The selection of participants to interview was a stratified selection process, which is random selection within the three groups of participants consenting to be interviewed. Five were randomly selected from each category - high, medium, and low-for a total of fifteen in the sample. These became the participants interviewed for the study.
In selecting the sample randomly from the different use levels, demographic differences are evident that potentially influence instructional technology adoption. For example, some disciplines are technically oriented and others are not. Some instructors are tenured while others are not. But random selection was made to try to prevent generalizations about older faculty or faculty from a non-technical discipline.
V. experiment
The experiment adopted interview format. While the survey information helped show whom on the faculty used instructional technology and when they used it, it did not answer why. The interview format could look deeper into what teachers were saying about why they did or did not adopt technology in their teaching. This was important.
-
A. Pilot study
In order to test the interview format and revise it before conducting the project interviews, this study conducted pilot interview to see if the factors we focused on were considered important to a college teacher when deciding to use instructional technology.
The pilot consisted of two in-depth interviews with two college teachers that consented to be interviewed, one a high user and one a low user. The idea of the format used was to get information about what influenced faculty decisions on the use of technology without directing them to say what we thought were the reasons. If the questions were too direct, we might unconsciously lead the respondent and interpret the responses to fit what we thought were the reasons. The idea of open-ended format was to allow respondents to talk about changes occurring that they perceived important to them. If the respondent continued to talk about certain factors more than others do, these may be more significant to them. The challenge was to see how these perceptions influenced their technology use.
The pilot study helped us look at how we might analyze the information. For example, we looked for phrases or recurring themes in the interviews. We counted the number of times that the topics occurred in the interviews to see any similarity or dissimilarity between the two levels of users. After comparing the frequency of the topics, we assigned values to topic statements based on whether the topic was mentioned positively or negatively. We then tallied the values and compared.
-
B. Interviews
TABLE VI. Some questions asked in the interviews
|
No. |
Questions |
Related to |
|
1 |
What did you do just prior to becoming a teacher at this university? |
General |
|
2 |
How long have you been teaching here? |
General |
|
3 |
What department do you teach in? |
General |
|
4 |
What is your subject area or discipline? |
General |
|
5 |
What is your current rank and how long have you been at this rank? |
General |
|
6 |
Tell me about your most satisfying experience in the classroom? |
General |
|
7 |
What motivate you to start using instructional technology? |
General |
|
8 |
In what ways do you think your students have changed in the last five years? |
Student |
|
9 |
Why do you think these changes are occurring? |
STTS |
|
10 |
How do you feel about these changes? Is this positive? Negative? |
STTS |
|
11 |
Have these perceptions of use of change influenced your use of instructional technology in any way? |
STTS |
|
12 |
How does this relate to what you do? |
STTS |
|
13 |
In what ways has your teaching changed in the last five years |
Teacher |
|
14 |
Why do you think these changes are occurring? |
Teacher |
|
15 |
Has your role in instruction changed over the last five years? Elaborate on how and why. |
Teacher |
|
16 |
How do you think technology has changed in the last five years |
Tec. |
|
17 |
How have you changed in regards to technology in the past five years? |
Tec. |
|
18 |
In what ways have your working conditions at the university changed over the past five years? |
Sur. |
|
19 |
Describe the most significant positive change to your working environment in the last five years that has affected your teaching. Also describe the most negative change. |
Sur. |
|
20 |
In what ways do you communicate or socialize with your colleagues at the department, college and university level? |
Sur. |
|
21 |
How have the component areas discussed influenced you in use of technology? |
Summary |
|
22 |
Which of the element areas is the most influential? |
Summary |
|
23 |
What really influenced you, encouraged you, or made you actively use or not use instructional technology? |
Summary |
LFTE: Student, Teacher, Technology, and Surroundings.
Sur.: Surroundings, Tec.: Technology.
In-depth interviews were then used to collect data. Detailed information about the faculty, their perceptions about changes in factors related to the use of instructional technology, and confirmation of their technology use level. The whole process of interviews were recorded by a video camera and saved as an important data to be studied later.
Interviews are the core of the study, the primary source of data. Interview data provides insight on faculty perceptions of change in the factors related to technology adoption. The interviewing process focused on: (1) what and how much is changing? (2) How teachers perceive this, why they think this is occurring? (3) Is this related to using instructional technology in teaching?
Interview questions addressed the components of the model previously described, and the teachers' perceived change in these components over time. Categories of inquiry were the student, the teacher, the technology, and the surroundings. Some questions asked in the interviews listed in table VI.
Interview data helps show why college teachers decided to use the instructional technologies. Accounts of what the teachers said show what they think is important and what they think prevents or encourages them. The interview data may suggest: 1) The way teachers are using or not using instructional technology and 2) Why or why not certain teachers use it and others do not. We used the interview format to measure if in fact the model components are suitable. It helps to probe deeper into the motivations of the teacher and their reasons for responding as they did to the survey questions on instructional technology use. From the information, inferences that have explanatory value can be drawn to answer questions about why some teachers are more frequent users of newer technology in teaching. This provides material for a description of the status of technology use in higher education instruction.
-
C. Data coding
Data collected was so huge that we had to find a way to reduce it for closer comparison between the levels of users. This involved coding data to categorize and eventually reduce the data to a more manageable form.
Coding the data is one way to search for patterns, themes, or meaningful data. It involves differentiating and combining data and researcher reflections on the material. In dividing the interview questions into different categories, student, teacher, technology, and surroundings, we made our first categories. These four question categories became the initial data codes. We made a spreadsheet and set up the codes as headings. As we played the videos again, we noted frequently mentioned topics and references to change, as the subject responded to questions. The frequently mentioned topics, ideas, or themes related to the category were noted and these became sub codes of sorts. The sub codes were then put below the category headings in the spreadsheet and became variables.
The indicators or references to change were allied in categories for frequency counts. This technique of quantifying the data was to order and structure the data to ease further interpretation of the data. This provided information on what perceived changes motivated or inhibited faculty use of technology in the teaching process.
A dichotomous coding technique was used with the matrix to help reveal patterns. The data statements or frequently mentioned topics were coded positive and negative in each of the different categories. We would assign a value of +1, 0, or -1 each time it was mentioned, depending on whether this was mentioned in a positive (+1), noncommittal (0), or negative (-1) context.
-
D. Data reduction
This case by variable matrix format allowed a display of relevant responses by different level users for comparison. Though initially it was quite large, looking for only the most frequently mentioned items from each category reduced it. Totals were tallied for individuals and then these totals were summed for all the high, medium and low level users. New tables with just the sums were made to allow easier comparisons between the levels of use. Then, topics with a frequency count of 12 or greater were separated and tables of these factors were formed.
Topics that were similar in nature were also combined to reduce the number of topics. If faculty members discussed equipment, software, supplies, resources, and funding together, these might be combined to one summary topic like support. This permitted an easier visual assessment of the tables.
-
E. Data analysis
The data analysis was almost totally visual and not a statistical treatment. Tables were visually examined to see if patterns existed that could differentiate the levels of users. From the matrix, the topic frequency and value numbers show areas important at the different use levels. High frequency count shows that a particular topic was of interest to that level of user. A particular topic mentioned more by one level of user might be more important to respondents in that category.
Value sums for the topics show the number of positive or negative statements. This value can show attitude toward a topic for a particular use level. The attitude may be the influential factor in the decision to use or not use instructional technologies. The positive or negative values also help show if that level of users perceives benefit in technologies under discussion. If users are negative toward support in their surroundings, yet still use a technology, their perception of benefit from using the technology must exceed the inhibiting factor.
The frequency and value numbers in data reduction tables were used instead of the comments when analyzing the results. Numbers, though quantitative, offered an alternative representation of the qualitative data. It was a method of reducing the data so that it did not take up a huge amount of space and be unmanageable. It represents the qualitative data in a tabular form. The analysis is a mixed qualitative/quantitative approach. Quantitative aspects are primarily to simplify the reduction of the data. The reduction of data is to put it into a form that patterns can be visually recognized.
To look for differences in high, medium, and low users, we looked at the most frequently mentioned topics in each question category and compared the frequencies and value sums for each level. We also made tables to compare the initial value when the topic was mentioned with the overall topic value. This suggested if a high or low user might be positive initially on a topic, but later become negative.
The data was reviewed for statements from users that would help show why they decided to use or not use newer instructional technology. Tables were used to support the statements and this information was used to write accounts of the faculty members and what they said in the interviews. These accounts focused on what they perceived as important barriers or incentives to the use of instructional technology. Accounts were supported with quotations from the interviews.
-
VI. Results
In analyzing the interviews, different topics mentioned by the interviewees were identified and counted. We identified 65 different topics. Of these topics, 63% or 41 of them were mentioned 12 times or more in the discussion. Some topics were mentioned in more than one category.
Table VII shows the total topic frequency count for the different sections of the interview and the values assigned. This is the sum of the frequency for all the different topics mentioned and the sum of all the values is assigned. The values assigned suggest the context of the statement. We would assign a value of +1, 0, or -1 to the topics, reflecting the tone of the statement, depending on whether this was mentioned in a positive (+1), noncommittal (0), or negative (-1) context. Table VII also separates the different levels of instructional technology users – high, medium, and low, so comparison can be made between the use levels.
TABLE VII. topic frequency count and value mentioned by
DIFFERENT LEVEL OF USERS
|
All topics count (value) |
Topics mentioned more than 12 times count (value) |
|
|
High |
481(66) |
402(51) |
|
Medium |
541(35) |
463(24) |
|
Low |
608(-22) |
481(-7) |
|
Total |
1630(79) |
1346(69) |
Table VII provides information that allows a comparison between the different levels of instructional technology users. The focus of the analysis is to see if differences between use levels would help explain why some faculty members adopt instructional technology while others do not. It shows that the high-level users total frequency count was less than the low level and that the total value was positive while the low level was negative. This could imply low level users have more to say and are typically negative about their situation regarding technology use in instruction.
Table VIII separates the total frequency and value numbers for the topics into the different interview sections. In the general question category, the different topics were mentioned 87 times and the overall value was 43. For the student category, total mentioned factor count was 200 with an overall value of 63. Questions in the teacher category yielded a total mentioned factor count of 379 with an overall value of 123. In the technology category, the total mentioned factor count was 328 with an overall value of -32. Questions in the surroundings category had a total mentioned factor count of 379 with an overall value of -123. As for the summary questions, the total mentioned factor count was 257 and the overall value was 5. Categories with the most frequent mentioned factors were the environment, faculty, and technology with summary section next. Of the categories, technology and surroundings yielded the negative context. It must be noted that this does not consider the number of questions asked in each category.
TABLE VIII. Total counts and values in each category for
THE DIFFERENT LEVELS OF USERS
|
users |
Gen. |
Stu. |
Tea. |
Tec. |
Sur. |
Sum |
Tot. |
|
|
High |
C |
26 |
61 |
101 |
112 |
103 |
78 |
481 |
|
V |
15 |
19 |
41 |
-27 |
-13 |
31 |
66 |
|
|
Med. |
C |
34 |
75 |
122 |
113 |
131 |
66 |
541 |
|
V |
16 |
16 |
52 |
21 |
-52 |
-18 |
35 |
|
|
Low |
C |
27 |
64 |
156 |
103 |
145 |
113 |
608 |
|
V |
12 |
28 |
30 |
-26 |
-58 |
-8 |
-22 |
|
|
Total |
C |
87 |
200 |
379 |
328 |
379 |
257 |
1630 |
|
V |
43 |
63 |
123 |
-32 |
-123 |
5 |
79 |
|
Gen.: General, Stu.: Student, Tea.: Teacher, Tec.: Technology, Sur.: Surroundings.
Sum.: Summary, Tot.: Total, Med.: Medium, C: Count, V: Value.
Table VIII summarizes the total topic counts and values in each category of the interviews. Total topic counts for the surroundings, teacher, and technology model components were the highest, which implies that faculty members spoke most about these areas and suggests these may be important factors regarding their instructional technology adoption. Surroundings and technology have negative overall values that imply teachers were more negative about these areas than others. The negative context can suggest problems in these areas that possibly inhibit instructional technology adoption.
Although the numbers may suggest some potential differences, it must be recognized that these figures do not show how many teachers in each level of use were participating. Multiple mentions of a topic may be from one teacher, or many. This will be examined more as we look at the categories in more detail.
An overall look at the tables reviewed to this point does suggest that some differences may exist between the different levels of instructional technology use. The total number of times topics were mentioned, as shown by the Table VII, shows that the low level users like to talk more and were overall negative in their comments. High level users spoke less, but were more positive. This can imply that the low-level users may be more negative than high level users. High level users may just be more optimistic about technology use.
A closer look with Table VIII reveals some differences within the categories between high and low level users, based on frequency count and value. The summary category shows that the low-level users talked more and were negative in context, compared with the high level users. This means that the low-level users talked more about influences on their technology use and these statements were negative in overall context. Based on the small negative value it shows they had positive things to say also. They were more negative in context in the surroundings category, but since the high level users were also negative, it means that they may share many concerns. The low-level users just talked more and were more negative about it. Other similar small differences exist, but overall, no great differences were evident that would suggest any conclusions. Typically low level users said more than high level users, and the technology and environment areas showed more negative statements than the other categories.
-
VII. Conclusion
In observing the result from table VIII, we can draw that some differences are noticeable between the high and low level users, shown as table IX. When asked which was the most influential to their adoption of instructional technology-the student, the teacher, the technology, or the surroundings, high users noted the technology but also mentioned surroundings, teacher and student as parts of their motivation. They would mention how they loved computers, Internet, E-earning, and M-Learning, or have technology helped them do something important or wanting to interest students more, topics that illustrated the benefit they perceived from using technology in instruction. For the medium users, they thought that the surroundings were the most influencial factors to their decision of adoption of instructional technology. They emphasized that if their college provided good conditions and supports to their use of instructional technology, or most colleagues of them used technology in their delivery, they would also like to use instructional technology, otherwise, they do not like to. At the same time, they also mentioned themselves and technology as the parts of influencing factors to their decision of use of instructional technology. As for low-level users, they thought themselves as the most important influential component of their adoption of instructional technology. Their attitudes, personal/teaching style, and how they prepare or organize classes were the most topics mentioned by them. On the other hands, they also mentioned surroundings, technology and student as parts of influencing their decision of adoption of instructional technology. In general, the teacher, the surroundings, the technology and the student were all important influencing factors to college teachers’ adoption of instructional technology. Of course, these factors have different influencing degree to different levels of users.
TABLE IX. the most influencing factors to different
LEVELS OF USERS
|
User ID |
High |
Medium |
Low |
Overall |
|
1 |
Tec. |
Sur. |
Teacher |
Teacher |
|
2 |
Sur. |
Teacher |
Sur. |
Sur. |
|
3 |
Teacher |
Tec. |
Tec. |
Tec. |
|
4 |
Student |
Student |
Student |
Student |
Tec.: Technology, Sur.: Surroundings.
Acknowledgment
The author is very grateful to the financial support from the 2010 Important Projects of Beijing Municipal Education Science "Eleventh Five-Year Plan" (AJA10238).
References An Experimental Study on College Teacher's Adoption of Instructional Technology
- Boettcher, J., 101 success stories of information technology in higher education, New York: McGraw-Hill, 1993.
- Knapper, C., “Technology and College teaching,” New directions for teaching and learning, 1988, pp. 31-46. San Francisco: Tossey-Bass.
- Kozma, R. B., Johnston, J., “The technological revolution comes to the classroom,” Change, 23 (1), 1991, pp. 10-23.
- Guskin, A. E., “Reconstructuring the role of faculty,” Change, 26 (5), 1994, pp. 16-25.
- Cross, K. P., “A proposal to improve teaching or what taking teaching seriously should mean,” AAHE Bulletin, 39 (9), 1986, pp. 10-11.
- King, A., “Making a transition from “sage on the stage” to “guide on the side.”, ” College teaching, 41, 1993, pp. 30-35.
- Pence, J. L., “Transforming campus culture through resource-based learning,” in D. W. Farmer and T. F. Mech (Eds.), Information literacy: Developing students as independent learners. New Directions for High Education, No. 78, 1992, pp. 113-122. San Francisco: Jossey-Bass.
- American Library Association, presidential committee on information literacy: final report. Chicago, IL, American Library Association, 1992.
- Farmer, D. W., “Information literacy: Overcoming barriers to implementation,” in D. W. Farmer and T. F. Mech (Eds.), “Information literacy: Developing students as independent learners,” New Directions for Higher Education, No. 78, 1992, pp. 103-112. San Francisco: Jossey-Bass.
- Boyer, E. “Prologue and major recommendations of Carnegie Foundation’s report on colleges,” Chronicle of Higher Education, Nov. 5, 1986, pp. 16-22.
- Farmer, D. W., and Mech, T. F., “Information literacy: Developing students as independent learners,” New Directions for Higher Education, No. 78, 1992, pp. 103-112, San Francisco: Jossey-Bass.
- Zimmerman, B. J., Bandura, A., Martinez-Pons, M., “Self-motivation for academic attainment: The role of self-efficacy beliefs and personal goal setting,” American Educational Research Journal, 29(3), 1992, pp. 663-676.
- Moore, G., Crossing the chasm: Marketing and selling technology products to mainstream customers, New York: Harperbusiness, 1991.
- Kozma, R. B., and Johnston, J., “The technological revolution comes to the classroom,” Change, 23 (1), 1991, pp. 10-23.
- Seels, B., “Taxonomic Issues and the development of theory in instructional technology,” Educational Technology, 37 (1), 1997, pp. 12-21.
- Heinich, R., Molenda, M., and Russel, J. D., Instructional media and the new technologies of instruction (4th ed.), New York: Macmillan Publishing Company.
- Dick, W., and Carey, L., The Systematic Design of Instruction (2nd ed.). Glenview, IL: Scott, Foresman and Company.
- http://teacherworld.com/potdale.html
- http://www.nwlink.com/~donclark/hrd/learning/id/elaboration_theory.html
- http://www.learning-theories.com/kellers-arcs-model-of-motivational-design.html
