An optimized model for breast cancer prediction using frequent itemsets mining

Author: Ankita Sinha, Bhaswati Sahoo, Siddharth Swarup Rautaray, Manjusha Pandey
Journal: International Journal of Information Engineering and Electronic Business @ijieeb
Article in issue: 5 vol.11, 2019.
Free access
This presented research paper mainly studies the frequent itemsets mining approach for finding the most important attribute to overcome the existing problems in the extraction of relevant information by using data mining approaches from a huge amount of dataset. Firstly a state of art diagram for prediction is designed and data mining classifier like naive bayes, support vector machine, decision tree, k- nearest neighbour are compared and then proposed methodology with new techniques are proposed. Moreover, a new attribute filtering association frequent itemsets mining algorithm is presented. Then, by analyzing the feasibility of the proposed algorithm, the data mining classification classifier is compared. As a result, SVM produces the best result among all the classifier with attribute filtrating and without attribute filtrating. With attribute filtrating algorithm enhances the accuracy of all the other classifier.
Association rule mining, Frequent itemsets mining, Decision tree, Naive bayes, Support vector machine, k-nearest neighbour, Prediction
Short address: https://sciup.org/15016187
IDR: 15016187 | DOI: 10.5815/ijieeb.2019.05.02
Text of the scientific article An optimized model for breast cancer prediction using frequent itemsets mining
Published Online September 2019 in MECS DOI: 10.5815/ijieeb.2019.05.02
Data mining techniques is the process of analyzing the datasets for withdrawing the relevant information from the huge dataset. Data mining concept is also used for finding the correlation among the attributes or the relation between the datasets and also used for prediction based on the current dataset[1]. There are many types of methodology in data mining like classification, clustering, association rule mining, regression and many more.
Healthcare data management plays a very challenging role in data mining techniques. Data of healthcare originate from different sources like the patient, nurse, doctor, administration, employee details and many more[2].
This paper is organized into section as follows. Section 2 is related research work from 2013 to 2018 on breast cancer. Breast cancer diagnosis, prognosis, recurrence, comparison of classifiers to increase the statistical measures. Darkly lighted only those research work which helps in my research work. The proposed architecture and its steps like data collection, data pre-processing, attribute filtering, data mining classification algorithm also frequent itemsets mining proposed algorithm is used for attribute filtering are discussed, in section 3 with the brief introduction of the classification algorithms like naive bayes, decision tree, SVM, k-NN. Implementation on Wisconsin dataset comparative analysis by using attribute filtering is discussed in section 4. Section 5 is the conclusion, summarizes a brief overview of the proposed work followed by and future work.
-
II. Related Work
After a study, the number of papers on breast cancer related to prediction analysis, risk analysis, recurrence, diagnosis, and comparison of the classification algorithm with the aim to increase the accuracy level of a classifier which helps the doctors in decision making or prediction analysis. Some research paper which helps in the proposed model of this thesis work, discussed in the next section are-
Sakri et al. [5] proposed particle swarm optimization technique for feature selection which reduces the features from BC dataset into classifier like Naive Bayes, K-Nearest Neighbor, and fast decision tree learner to increase the accuracy level of recurrence prediction analysis and naive bayes with and without feature selection produces the best output.
Alwidian et al. [6], innovate new techniques for pruning and prediction depend on statistical measures for produces more specific association rule which increases the accuracy level of Association classifier and the problem related to estimated measures and prioritization techniques to be solved as it plays an important role in rule generation of WCBA. For screening the result in different fields, the different methodology is used for weighting, pruning, and prediction.
Asri et al. [9], Comparison of performance in terms of accuracy, precision, sensitivity, and specificity into classifiers like SVM, C4.5, NB, k-NN on Wisconsin BC datasets and SVM gives high accuracy and its efficiency.
Shah et al. [10], the comparison between classification algorithm such as Random Forest, Naive Bayes, ibk on WEKA tool in terms of correctly classified instances, incorrectly classified instances, time is taken, kappa statistic, relative absolute error, and root relative squared error and naive bayes generates the best accuracy among all classifiers in lowest time.
Bhardwaj et.al [12], presented new algorithm i.e genetically optimized neural network which classifies diagnosis class either benign or malignant with an aim to deal with classification issues and compares the statistical measures performances like accuracy, sensitivity, specificity, confusion matrix, ROC curve, area under curve.
Gupta et al. [13], given a synopsis of all the current research on breast cancer by applying data mining algorithms to enhance research work on breast cancer detection and prediction.
-
III. Proposed Model
Breast cancer is also famous as female cancer. Early diagnosis of breast cancer and its related therapy has been well-marked transformation as it increases the number of breast cancer survivor. Breast cancer affecting women living in a bad manner due to change the lifestyle of women like alcohol misuse, pregnancy preventive pills, stress, emotionally break down, over-weighting, having babies after the age of 30 and many more. Breast Cancer affects the quality of life of women by growing uncontrollably. Accurate screening has lots of chances to be cured and the diagnosis of BC in screening helps a doctor for prediction analysis with the help of data mining. After studies, the number of papers based on BC research, this paper is going to be proposed the algorithm for attribute filtration method and the implementation by different classifier like naive bayes, decision tree, svm, k-nn with the aim to get the best output with less number of an attribute[5, 6, 7, 10, 11, 12].
Prediction
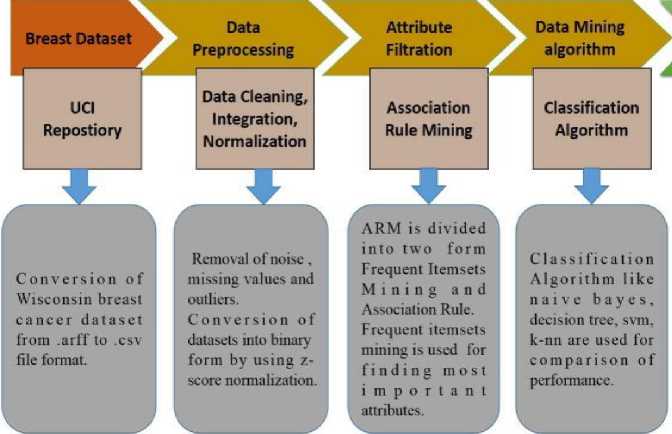
Fig.1. Proposed Model
Result Analysis

Comparison of classifiers by using statistical measures with and without attribute filtration and then finally prediction is taken as consideration.

The Proposed model as shown in Fig.1 is consists of several steps and each step is discussed below-
-
A. Data Acquisition
Data acquisition would be collected from UCI. The data available here is been collected from Wisconsin hospital. It is available in .arff format and is converted to .csv file format for further processing.
-
B. Pre-processing
Wisconsin BC dataset consists of 17 missing values, remove the missing value by calculating the mean of that particular attribute. Then data normalization is done for converting the datasets in the binary form 0-1. z-score normalization techniques are used for the conversion. The z-score strategy also known as standard score is normal distribution of data where the standard deviations below or above the mean. For z-score, mean and standard deviation are calculated for comparing the results from a test a normal population to thousands of possible results. And after the z-score scaling calculated the mean and applied the condition if the mean(attribute)>= value(attribute) then '1' else '0' because of z-score range i.e -2 to +2.
value-mean
Z Score = (1)
where, value = value is locate in the distribution
SD = Standard deviation.
Equation 1 is standard formula for calculating Z Score with with an average mean of 0 and standard deviation of 1.
-
C. Attribute Filtration
It is a very important step in this research work. For attribute filtration, proposed the frequent itemset mining algorithm that considers only the most important attribute[14]. For example, in the datasets of breast cancer, there is no requirement of a patient’s ID. Frequent itemset mining is a very crucial part of association rule mining, which finds out the correlation among attributes and frequent patterns.
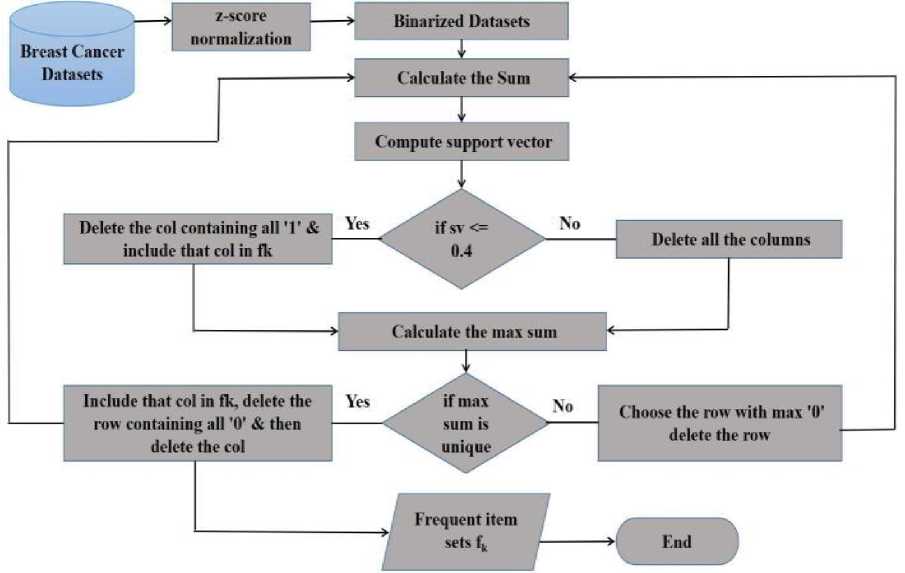
Fig.2. Frequent itemset mining proposed flow chart
In this research, FIM is used to find out important attributes from the dataset which consists of 32 attributes. Algorithm 1 illustrated all the necessary steps.
Algorithm 1: Algorithm for Attribute Filtration
Input: Wisconsin Breast Cancer dataset (BC) in Binarization form.
Step1: Calculate the sum of attributes of BC dataset.
Step2: For each attribute of BC dataset, consider support threshold value=0.4.
Step3: For each attribute which is less than threshold=0.4, delete that attribute column.
Step4: For each attribute which is consists of all ‘1’ delete that attribute column and include that column into frequent itemsets i.e f k .
Step5: Calculated the maximum sum and check whether the maximum is unique or not. If the maximum sum is unique then first delete that row having ‘0’ and finally delete that attribute column and include in f k else find the row having maximum‘0’ and delete that row.
Step6: Repeat step 1 to 5 until the BC dataset is null
Step8: Output fk, containing most important attributes.
Output: frequent itemsets fk= a2, a3, a4, a6, a7, a8, a9, a11, a13, a14, a17 a20, a21, a22, a23, a25, a27, a28, a31. The Most important attribute of Breast cancer dataset (BC) is radius_mean, texture_mean, perimeter_mean, smoothness_mean, compactness_mean, concavity_mean, texture_se, concave_points_mean, fractal_dimension_mean, perimeter_se, compactness_se, symmetry_se, fractal_dimension se, radius_worst, texture_worst, area_worst, concave_point_worst, symmetry_worst, diagnosis(class).
-
D. Data Mining learning Algorithm
Data mining is extremely used in HealthCare Domain to increase diagnostic accuracy. Data mining tool is used to explore diseases, operations, etc in order to improve treatment quality at an affordable cost. For discovering useful and hidden trends or patterns that are used in the diagnosis and in recurrence. Classification data mining algorithm technique categorized the breast cancer datasets into a number of classes[15]. The main classification technique is to accurately predict the new data class and also give an effective result for the analysis of huge datasets[16]. Table 1. describe the classification algorithm advantages and disadvantages.
Table 1. Advantages and disadvantages of Classification Algorithm
|
Classification |
Decision Tree |
Naive Bayes |
|
Advantages |
Fast and Simple to understand, interpret. Can handle categorical as well as continuous variable |
Fast to train and classify for single scan and relevant space also. Not sensitive for irrelevant features. |
|
Disadvantages |
Training cost is high, over fitting. Document connected to one branch. |
Assume independence of features. Outcome is very biased results. |
|
Advantages |
Scale well for high dimensional data. Less over-fitting. |
Non-parametric & best performing text classifier. Handle large amount of predictors. |
|
Disadvantages |
Training time is high for large data. Less effective for noisy data. |
Difficult for similarity measure. Computationally expensive. |
E. Analytical Tool
Datasets is huge in number and for the analysis of a large number of datasets we need an analytical tool. R programming tool is a free software environment for statistical computing and graphics. R consists of complete packages. It is one of the best analytical tools for data pre-processing. Most of the data scientist and researcher uses R tool for data prediction analysis as R is bit faster for both statistical and programming. R is also less expensive data analytical tool with graphical capabilities or better data visualization facilities.
F. Prediction
Predictive model uses statistics to predict the trends and unknown event of model.
-
IV. Implementation
-
A. Data Description
To classify all the classification algorithm, we have used UCI Wisconsin Breast Cancer datasets. The datasets consists of 31 attributes and one class attribute i.e diagnosis with 699 instances. Fig.3 presents the attribute specification of datasets of breast cancer.
|
Attr Attribute Name No. |
Description se= standard error lmv= largest mean value |
|
mean of distances from center to points on the perimeter standard deviation of gray scale values mean size of the core tumor mean area inside the boundary of core tumor mean of local variation in radius lengths mean of perimeter л2 / area -1.0 mean of severity of concave portions of the contour mean for number of concave portions of the contour mean of similar area of tumor parts that matches mean for "coastline approximation*1 -1 se for the mean of distances from center to points on the perimeter standard error for standard deviation of gray scale values standard error for mean size of the core tumor standard error for mean area inside the boundary of core tumor standard error for local variation in radius lengths standard error for perimeterA2 / area -1.0 standard error for severity of concave portions of the contour standard error for number of concave portions of the contour se for mean of similar area of tumor parts that matches standard error for "coastline approximation1’ -1 worst or Imv for mean of distances from center to perimeter points worst or Imv for standard deviation of gray scale values worst or largest mean value for mean size of the core tumor worst or Imv for mean area inside the boundary of core tumor worst or Imv for local variation in radius lengths worst or Imv for perimeterA2 / area -1.0 worst or Imv for severity of concave portions of the contour worst or Imv for number of concave portions of the contour worst or Imv for similar area of tumor parts that matches worst or Imvfor "coastline approximation" -1 M = malignant. В = benign |
Fig.3. Attribute Description[17]
-
B. Comparative Analysis
It is a visualization tool which is commonly used to represent accuracy, sensitivity, specificity of classifier. It is used to show the relationships between outcomes of actual and predicted classes. A Confusion Matrix helps in finding the comparison between classifier by computing Accuracy, Sensitivity, Specificity, Area under curve and ROC curve [10]. Confusion Matrix table for breast cancer diagnosis is shown in table 2.
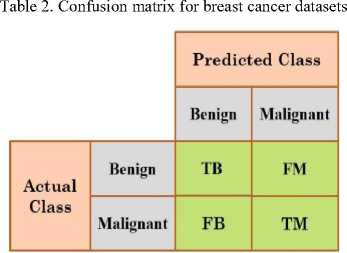
True Benign: Probability of (+) given the individual has the Benign stage.
False Benign: Probability of a Benign stage tests negative (-).
True Malignant: Possibility of (-) given the individual does not have the benign stage, have Malignant stage;
False Malignant: Probability of a Malignant stage tests positive (+).
Accuracy: Actually classified classes divided by the total number of classes in the dataset.
Accuracy =
TB+TM
TB+TM+FB+FM
Sensitivity = TPT+BFM (3)
Specificity = TMT+MFB (4)
Positive Predictive Value: Possibility of a patients who attempt has Benign stage.
Negative Predictive Value: Possibility of a patients who attempt has Malignant stage.
-
C. Performance Analysis
Table 3 gives the performance result of classifier algorithms. According to performance table the SVM gives the highest accuracy i.e 97% as compared to other classification algorithms.
Table 3. Performance Table of classifier algorithms without attribute filtration
|
Classifier |
Acc (%) |
Sen (%) |
Spec (%) |
Ppv (%) |
Npv (%) |
auc |
|
Decision Tree |
91.15 |
93.85 |
87.50 |
91.04 |
91.30 |
0.9516 |
|
Naive Bayes |
95.33 |
97.49 |
66.51 |
83.06 |
94.00 |
0.9649 |
|
SVM |
97.35 |
61.07 |
41.99 |
63.93 |
39.04 |
0.9888 |
|
k-NN |
74.99 |
81.23 |
22.16 |
63.73 |
41.22 |
0.8147 |
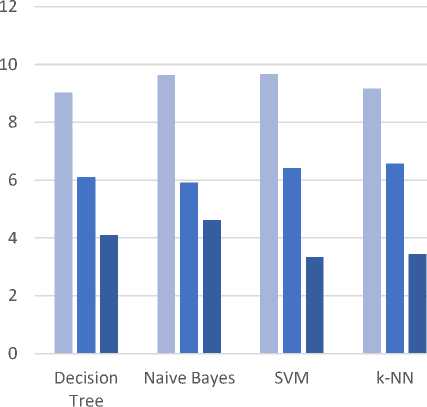
Fig.4 represents Performance graph between the statistical measures like accuracy, sensitivity, and specificity.
Performance Graph without Attribute Filtration
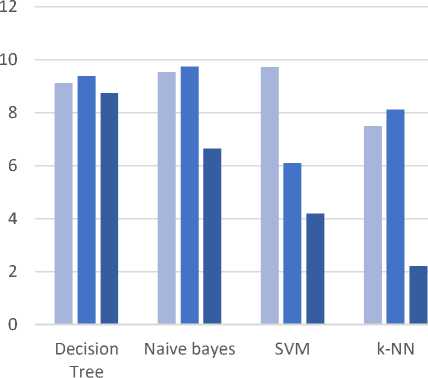
■ Accuracy ■ Sensitivity ■ Specificity
Fig.4. Performance Graph without attribute filtrating
Fig.5 represents the ROC curve for the different classification classifiers and SVM classification techniques is the superior algorithm as compared to other classifier. SVM gives higher accuracy and higher area under curve.
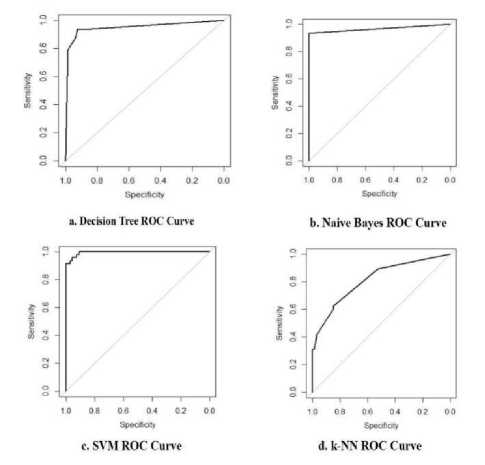
Fig.5. ROC curve of classification algorithm without attribute filtrating
Table 4 shows the comparison of classification classifier algorithm with attribute filtration, fig.6 shows the performance graph of classification classifier among statistical measures like accuracy, sensitivity, specificity.
Table 4. Performance Table of classifier algorithms with attribute filtration
|
Classifie rs |
Acc( %) |
Sen( %) |
Spec( %) |
Ppv( %) |
Npv( %) |
auc |
|
Decision Tree |
90.27 |
61.06 |
41.98 |
63.92 |
39.03 |
0.9497 |
|
Naive Bayes |
96.46 |
59.10 |
46.22 |
64.92 |
40.16 |
0.9949 |
|
SVM |
96.61 |
64.14 |
33.49 |
61.89 |
35.67 |
0.9553 |
|
k-NN |
91.74 |
65.82 |
34.43 |
62.83 |
37.43 |
0.9571 |
Performance Graph with Attribute Filtration
■ Accuracy ■ Sensitivity ■ Specificity
Fig.6. Performance Graph with attribute filtrating
Fig.7 shows the ROC curve. SVM produces best result among all classifiers and also enhances the accuracy level of all the other classifier as compared to without attribute filtration.
Out of 31 attribute (expect patient’s ID) only 19 attribute are most important. Enhances the accuracy level of each classifier. Roc curve i.e receiver operating characteristic describe the usefulness of diagnosis class I.e benign and malignant. SVM produces best result with low negative predictive value.
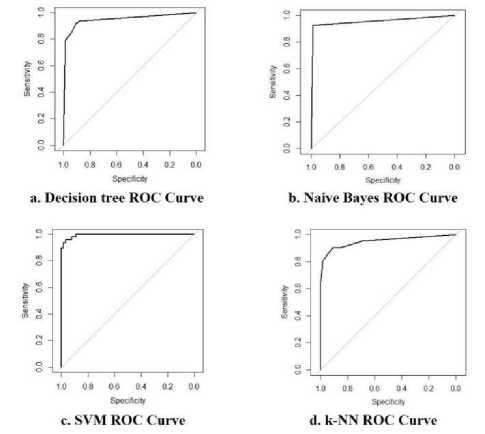
Fig.7. ROC curve of classification algorithm with attribute filtrating
-
V. Conclusion and Future Work
Frequent itemsets mining proposed algorithm for attribute filtration which enhances the work of predictive analysis by finding only the most important attributes from the datasets and the comparative study of statistical measures like accuracy, sensitivity, specificity, positive predictive value, negative predictive value, area under curve and roc curve for the popular classifying algorithms, NB, DT, SVM and k-NN also performance graph and performance table with and without attribute filtration is clearly shown and final output of our implementation is also shown as ROC curve. SVM generates better output with attribute filtration as compared to without attribute filtration as it produces highest area under curve as compared to other classification techniques and also enhances the accuracy level of all the other classifier. In future work we will try to enhance the attribute filtration techniques on real time databases. Also try to implement model by using ensemble algorithm and the comparison will be done.
Acknowledgement
I would like to explicit my deepest gratitude and warmest affection to my professors and I dedicated this research work to Mrs. Bhaswati Sahoo and Mr. Siddharth Swarup Rautaray and Mrs. Manjusha Pandey who has been a constant source of inspiration, knowledge, support and valuable contribution to this research paper. I equally thank my parents and friends who provoked me to remain focused and helped me to complete this research paper.
References An optimized model for breast cancer prediction using frequent itemsets mining
- Umadevi, S. and Marseline, K.J., 2017, July. A survey on data mining classification algorithms. In 2017 International Conference on Signal Processing and Communication (ICSPC) (pp. 264-268). IEEE.
- Wani, N.U.H., Taneja, K. and Adlakha, N., 2013. Health System in India: Opportunities and Challenges for Enhancements. IOSR Journal of Business and Management (IOSR-JBM), 9(2), pp.74-82.
- https://www.medicinenet.com/breast_cancer_facts_stages/article.htm#are_there_any_other_ questions_i_should_ask_my_doctor_about_breast_cancer--> Breast Cancer.
- Breast Cancer -- https://www.medicalnewstoday.com/articles/37136.php.
- Sakri, S.B., Rashid, N.B.A. and Zain, Z.M., 2018. Particle swarm optimization feature selection for breast cancer recurrence prediction. IEEE Access, 6, pp.29
- Alwidian, J., Hammo, B.H. and Obeid, N., 2018. WCBA: Weighted classification based on association rules algorithm for breast cancer disease. Applied Soft Computing, 62, pp.536-549.
- Shukla, N., Hagenbuchner, M., Win, K.T. and Yang, J., 2018. Breast cancer data analysis for survivability studies and prediction. Computer methods and programs in biomedicine, 155, pp.199-208.
- Park, K., Ali, A., Kim, D., An, Y., Kim, M. and Shin, H., 2013. Robust predictive model for evaluating breast cancer survivability. Engineering Applications of Artificial Intelligence, 26(9), pp.2194-2205.
- Asri, H., Mousannif, H., Al Moatassime, H. and Noel, T., 2016. Using machine learning algorithms for breast cancer risk prediction and diagnosis. Procedia Computer Science, 83, pp.1064-1069.
- Shah, C. and Jivani, A.G., 2013, July. Comparison of data mining classification algorithms for breast cancer prediction. In 2013 Fourth International Conference on Computing, Communications and Networking Technologies (ICCCNT) (pp. 1-4). IEEE.
- Tripathy, P., Rautaray, S.S. and Pandey, M., 2017, February. Parallel support vector machine used in map-reduce for risk analysis. In 2017 Second International Conference on Electrical, Computer and Communication Technologies (ICECCT) (pp. 1-4). IEEE.
- Bhardwaj, A. and Tiwari, A., 2015. Breast cancer diagnosis using genetically optimized neural network model. Expert Systems with Applications, 42(10), pp.4611-4620.
- Gupta, S., Kumar, D. and Sharma, A., 2011. Data mining classification techniques applied for breast cancer diagnosis and prognosis. Indian Journal of Computer Science and Engineering (IJCSE), 2(2), pp.188-195.
- Agarwal, S., 2013, December. Data mining: data mining concepts and techniques. In 2013 International Conference on Machine Intelligence and Research Advancement (pp. 203-207). IEEE.
- Han, J., Pei, J. and Kamber, M., 2011. Data mining: concepts and techniques. Elsevier.
- Umadevi, S. and Marseline, K.J., 2017, July. A survey on data mining classification algorithms. In 2017 International Conference on Signal Processing and Communication (ICSPC) (pp. 264-268). IEEE.
- Database;http://archive.ics.uci.edu/ml/datasets/breast+cancer+wisconsin+(diagnostic).
