Analysis and prediction of individual stock prices of financial sector companies in NIFTY50

Author: Vikalp Ravi Jain, Manisha Gupta, Raj Mohan Singh
Journal: International Journal of Information Engineering and Electronic Business @ijieeb
Article in issue: 2 vol.10, 2018.
Free access
Prediction of the stock market is currently a big business opportunity for the data analytic solution providers. As the vast range of factors influencing the stock market index are available, it is essential to find the relation between those macroeconomic variables with company share prices and predict the accurate results. Our research is analyzing different relation between the prediction and individual stock prices of financial sector companies in National Stock Exchange 50(NIFTY 50). To make a strong portfolio the selection of different companies is one of the vital decisions we should attempt for a good investment. Trending researches regarding financial forecast are based on the accuracy of the models that how well National Stock Exchange (NSE) index values can be predicted. There is significant literature survey available on the prediction of the stock market as well as its pricing. NIFTY 50 is one of the well-known indexes in India for the investors seeking a good investment. In our research, we attempt, to forecast the stock values of different organizations of Banking and Financial sectors in NIFTY 50. Before including the factors to forecast share market index we are trying to find the relation between different factors and indices of those companies. The study empirically proves that the proposed model is precise to be used in real time stock prediction which can benefit the sellers, investors and stakeholders in their real time savings, investment, and speculation.
Neural network, Stock Forecasting, Backpropagation, NIFTY50
Short address: https://sciup.org/15016127
IDR: 15016127 | DOI: 10.5815/ijieeb.2018.02.05
Text of the scientific article Analysis and prediction of individual stock prices of financial sector companies in NIFTY50
Published Online March 2018 in MECS
Prediction of the stock market index is the key to gain profit in the market. Traditionally while predicting the stock index, a random estimation is taken where the stock market leads to. An investor should have complete awareness of daily news for the market. The stock market depends on several microeconomic and macroeconomic variables i.e. rate of inflation, the price of different metals, crude oil price, Gross Domestic product rate, employment rate, consumer price index, interest rates, and rate of liquidity etc. Other than these, stock market counts on the variable such as government policies, budget policy, seasons, natural and man-made disasters. It is very difficult to decide how much NSE index is affected by these factors. An assessment when one should invest his money and gets most benefitted (in terms of investment) is decided by n-Day (n = 10, 11, 12…) moving price average.
Current research attempts to predict the share market based on macroeconomic variables. The researchers are considering a limited number of macroeconomic variables and based on those variables they estimate the prediction price and try to improve the model on which they are working on. The developers are also forecasting the movement direction of stock index values using support vector machine [1].
There is a limited research work that aims to investigate the stock market by considering the significant input factors. Instructors and stakeholders are finding it hard to examine the stock market
-
[12] .Currently researches are lagging behind with the difficulty of preciseness of predicting the accurate share price. A small difference with actual values may make a capital loss in billions of money, the precise in their outputs and relying on those results, the investors pay a huge loss [15][16]. This scenario demands a framework which can accurately analyze the share prices of organizations in Banking and Financial sectors and produce the beneficial results.
This work is based on Artificial Neural Network by considering the relevant factors which influence the Banking and Financial Sectors. We propose an approach which empirically analyzes the important factors affecting this sector and predicts the next day share price of each organization based on historical prices and values of different macroeconomic variables.
-
II. Related Work
Bollen et.al[3] included the specific public mood dimensions to improve the accuracy of Dow Jones Industrial Average(DJIA). Baba et.al[4] developed an intuitive forecast system of stock price which internally uses Artificial neural networks(ANN). Helbert predicted economy using ANN [5]. Jung-Hua developed a system from which they can easily predict the stock index on weekly basis [6]. Prediction of share market index can be done using both quantitative and qualitative factors. Kyoung-jae et.al[7] discusses how genetic algorithm helps to discretize the connection weights in artificial neural network to predict share market and its values[8]
-
[13] .Yang H. et.al[9] used Support Vector Regression technique to solve regression and prediction problem and found that the system’s prediction volatility is affected by the changes in the margins of Support Vector Regression(SVR). Robert et.al[10] in his research from news and stock market quotes they are able to forecast the stock market but with limited accuracy of 57.1%.
-
[14] uses classifiers and clusters to improve the accuracy of prediction up to 65%.Though the effect of variables on our prediction system depends on how we choose those variables a thorough study shows that how these variables also are co-related with each other and their effects on financial forecasting [11].
-
[17] Peter at al uses artificial neural network to predict the stock prices of four selected Nigerian banks with 2003 to 2006 data. Authors in their research use backpropagation algorithm. They avoid memorization because the model didn't have too many processing elements-neurons. The model introduced by them had an accuracy of 95%.
-
[18] Ayman et al performs sentiment analysis on financial news them and historical stock market prices. Their research work included two steps in which for the first step they produce the text polarity using Bayes algorithm which achieves up to 86% accuracy from that text polarity. New polarities and historical stock prices
are combined together to predict the future stock prices with an achievement of the prediction accuracy up to 89.80%.
-
III. Relation and Analysis of Stock Companies
To select the parameters between the financial sectors and different macroeconomic variables we must have the relation between them. We can commence the relation between them using different statistical values. The statistical values will enhance the accuracy of the model further. The statistical values give us the estimate that whether these companies’ data is useful enough for our prediction model or not. To use the data for prediction the data must be less prone to errors and more related with each other.
The financial sector of NIFTY50 contains the following companies:
-
1. Axis Bank Ltd. (AXISBANK).
-
2. Bank of Baroda (BANKBARODA).
-
3. Yes, Bank Ltd. (YESBANK).
-
4. State Bank of India (SBIN).
-
5. ICICI Bank Ltd. (ICICIBANK).
-
6. Housing Development Finance Corporation Ltd (HDFC).
-
7. HDFC Bank Ltd. (HDFCBANK).
-
8. Indiabulls Housing Finance (IBULHSGFIN).
-
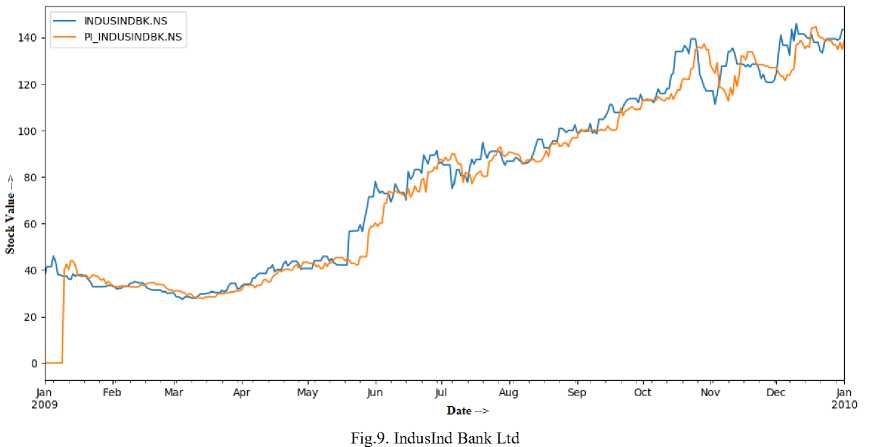
9. IndusInd Bank Ltd. (INDUSINDBK).
-
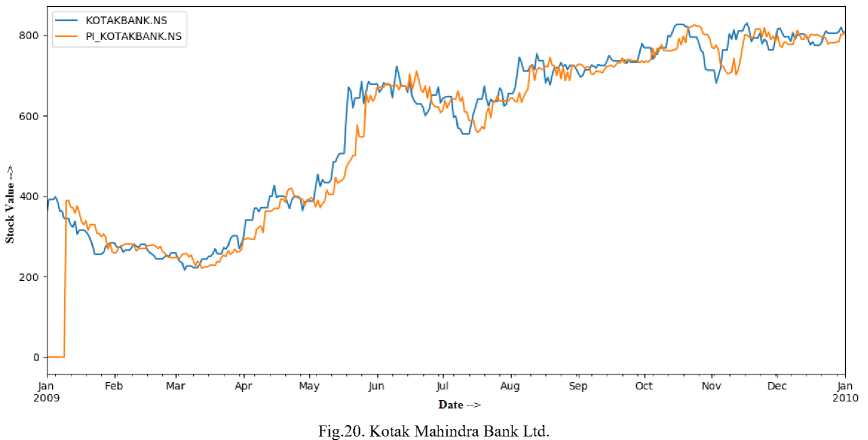
10. Kotak Mahindra Bank Ltd. (KOTAKBANK).
-
A. Basic Statistic Values
-
1. Mean: It is one single value used to represent our dataset in which we will divide the total number of values with the number values.
-
2. Standard Deviation: It is the quantity by which we can indicate that how much the member of the group is differ from the value of mean.
-
3. Expectation of squared deviation of stock values from its mean value.
-
4. Kurtosis: It is the probability shape descriptor.
-
5. Skewness: It indicates the normal distribution of the curve.
-
6. Jarque-Bera Test: This test is to check whether the kurtosis and skewness match the normal distribution.
The basic statistic values of different stock prices in the financial sector are shown in Table 1.
-
B. Pearson Relation
It is the indication of the linear relationship between the variables. We investigated the Pearson relation between the company stock prices and macroeconomic variable to find how strongly they are connected with each other. Table 2 indicates the Pearson relation between macroeconomic variables and stock prices. We truncated the table to show only useful information.
Table I. Basic statistic values
|
Mean |
Standard Deviation |
Sample Variance |
Kurtosis |
Skewness |
Jarque–Bera Test |
|
|
AXISBANK |
2028.157 |
2337.092 |
5462000 |
0.836923 |
1.501807 |
1819.659 |
|
BANKBARODA |
493.042 |
236.315 |
55844.6 |
-1.4872 |
0.054 |
416.157 |
|
YESBANK |
378.061 |
284.992 |
81220.2 |
1.54878 |
1.44478 |
2011.72 |
|
SBIN |
1611.525 |
782.46693 |
612254.5 |
-0.621768 |
-0.48138 |
245.84528 |
|
ICICIBANK |
827.3 |
348.1 |
1.00E+05 |
-0.59 |
-0.21 |
97.03 |
|
HDFC |
1565.6242 |
775.37685 |
601209.3 |
-1.2775524 |
0.418952 |
436.8889 |
|
ICICIBANK |
827.3 |
348.1 |
1.00E+05 |
-0.59 |
-0.21 |
97.03 |
|
IBULHSGFIN |
335.778 |
140.466 |
19730.6 |
4.24678 |
2.34118 |
7479.13 |
|
INDUSINDBK |
315.07556 |
308.52109 |
95185.26 |
1.0223722 |
1.357623 |
1575.533 |
|
KOTAKBANK |
713.62787 |
250.79241 |
62896.83 |
0.7541053 |
0.906903 |
722.19531 |
Table II. Pearson relation
|
GDP |
IIP |
CPI |
Dollar Exchange Rate |
Interest Rate |
Gold |
Silver |
|
|
AXISBANK |
-0.68965 |
0.525394 |
0.283622 |
0.246903 |
-0.55178 |
0.522995 |
0.56769 |
|
BANKBARODA |
0.53264 |
0.586943 |
0.270896 |
0.152725 |
-0.540446 |
0.644111 |
0.658477 |
|
HDFCBANK |
0.604512 |
-0.21563 |
0.169101 |
-0.45742 |
-0.7520158 |
-0.62248 |
-0.7634 |
|
HDFC |
-0.00777 |
-0.60743 |
0.035154 |
-0.48776 |
0.562471 |
-0.67317 |
-0.42843 |
|
IBULHSGFIN |
0.175997 |
0.19619 |
-0.57442 |
0.642579 |
0.574913 |
-0.48829 |
-0.60563 |
|
ICICIBANK |
-0.6998 |
0.57406 |
0.318587 |
-0.35956 |
-0.55681 |
0.5896 |
0.555436 |
|
INDUSINDBK |
0.155316 |
0.501907 |
-0.51446 |
0.923129 |
0.59216 |
0.502441 |
0.003897 |
|
KOTAKBANK |
0.695912 |
0.55281 |
-0.41069 |
0.530892 |
0.680683 |
-0.51005 |
-0.54547 |
|
SBIN |
-0.05679 |
0.115063 |
0.640334 |
-0.57677 |
-0.60392 |
0.65314 |
0.695051 |
|
YESBANK |
0.19434 |
0.495173 |
-0.55525 |
0.849717 |
0.503945 |
-0.72297 |
0.012577 |
-
IV. Proposed Approach
-
A. Backpropagation
Gradient descent algorithm intends to find minima/maxima of a function which is situated in the general category of gradient descent algorithm. The function by iteratively moving in the negative slope’s direction to find minima/ maxima. The main motive is to minimize the error function. The minimized average function is proposed as,
€ =
N
;X'
n=1
This above function will evaluate the error from a window of 15 days every time we forecast the NSE index.
-
B. Data Processing
The data of Nifty Sensex we considered for our research contains the date, Open Values on that day, highest value on that day, lowest value on that day, closing value on that day, the volume of shares which were being sold on that day, Adjacent Close values. But in our data, we considered the Date values and a closing value for in the consideration. For every single value of prediction, we use last 9 days of indexes of listed companies’ data available with us.
Different combinations of input samples is being fed to ANN as an single vector. Because of more than one sample there is a delay in the system. To combine the data a moving window is used for the points which are as follows:
O n = (O n-k+1 , O n-k+2 … O n-1 )
Here On is the nth observation for particular moving window and k represents the frequency or treated as previous values used to forecast the very next stock value. Target observations are formally the data vector stock values of next time step:
T n = O n
Here the target represents the nth observation
_ (4 ^On- (min(On) + max(On))) n (min(On) + max(On))
Before being treated as input, the input is being processed for the normalization which is being equated with an equation. After getting the predicted value the values are again DE normalized to original scale by the equation.
(max(On) - min(On)) , _ , „
On = (------------+ (min(On) + max(On))
-
C. Activation Function
We can use different activation function for the neurons, few of them are mentioned below:
-
1. Unipolar Sigmoid:
-
2. Bipolar Sigmoid
-
3. Tan Hyperbolic
-
4. Radial Basis Function
X
fto = l+,_,...
2 f^ = ,.,.■.'
^ Л. ^ -Л.
f(x) = 1 + ^л^-л.
е -(.- Ю2 /2о" 2
^2ка
The activation function used is common to all neurons in ANN.
-
D. Network Configuration
Variables which are used for the prediction:
Input Values: Date, Close (Samples of different companies)
Outputs: Close Value (Stock price value, factors)
Training Data percentage: 60%
Testing data percentage: 40%
Points considered for training: 5 Days
Nodes in Input Layer: 3
Rate of learning (7): 0.001
Hidden Layers: 1
Nodes present in Hidden Layer: 3
Activation function: Tan Hyperbolic.
Above mentioned values are considered as default values for above variables used in for Artificial Neural Network.
-
E. Hidden Layers and Neurons
The ANN we used in our research is for the prediction of stock values which have arbitrary number nodes in hidden layer. The decision of nodes is decided by the user before the execution.
-
F. Stopping Criteria
The learning rate ) will control the rate of convergence in the backpropagation algorithm. A bigger estimation of ) would guarantee speedier merging; be that as it may it might make the calculation sway throughout the minima, to make the convergence very slow directly affected by littler estimation of ).
We required few ceasing paradigm for the calculation too, to guarantee that it doesn't run endlessly. For our investigations we utilized a three-overlap ceasing model. The back propagation calculation met the stopping criteria if any of the conditions are met:
-
• The adjustment in error from a step of iteration to the next should not exceed the threshold value that the user can set
-
• For increase in error value, a relaxation factor here allows a minimal increase in the error values. It is also being observed that the error tends to increase by a small amount and then decrease again, in case, if iteration’s number reaches beyond a certain limit. In our case, we set the limit as 200.
-
V. Results and simulation
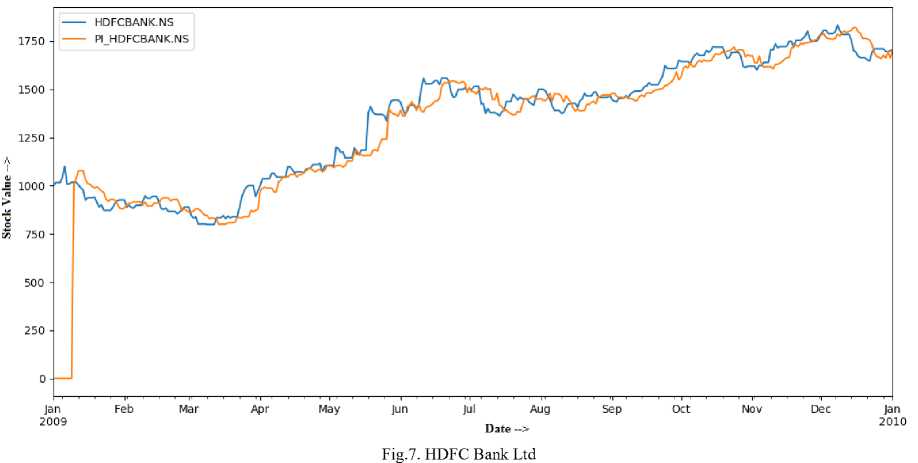
Prefix “PI_” is used for the stock prices of Predicted companies in the figure from the financial sector.
The Graphs which we used in this section is produced by Python graph tool generator ‘matplotlib’ libraries. The result output we generated is separated for each bank stock prices.
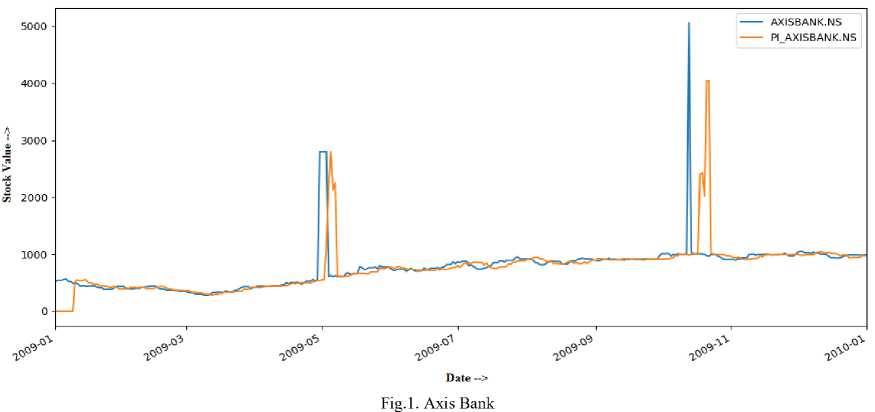
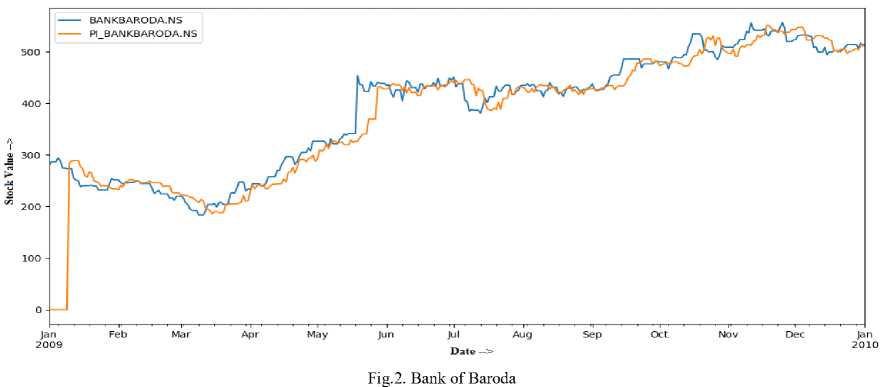
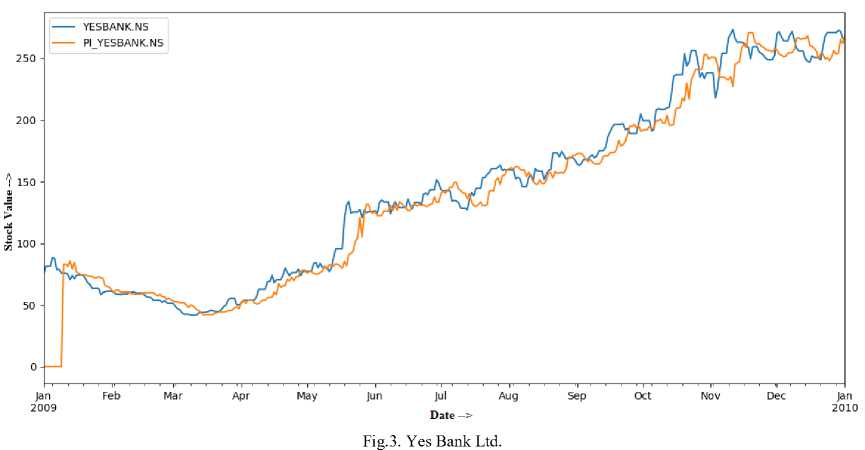
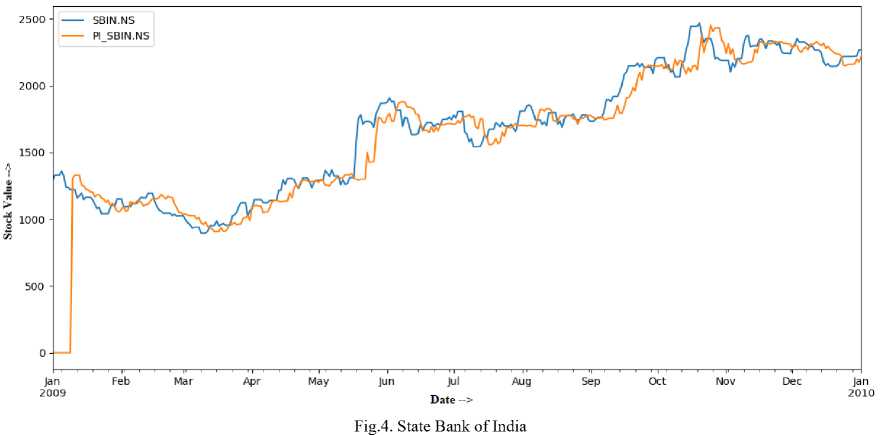
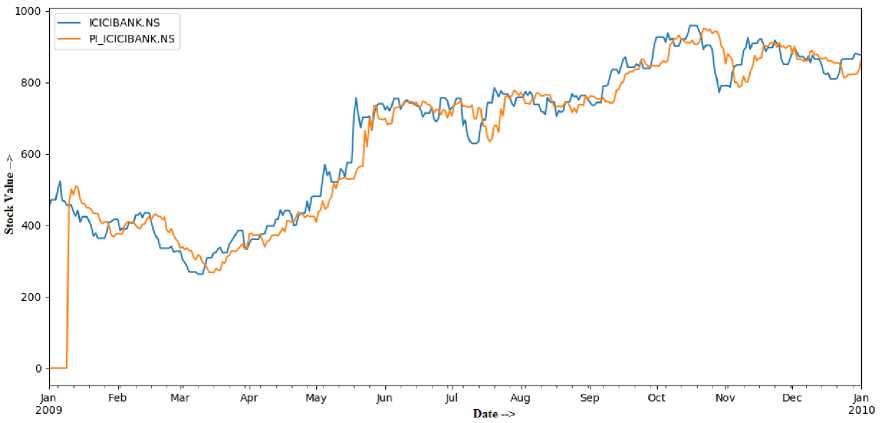
Fig.5. ICICI Bank Ltd.
Stock Value
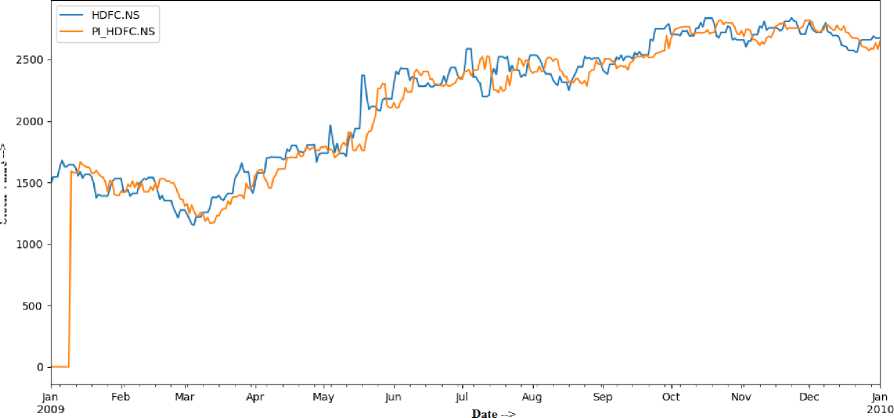
Fig.6. Housing Development Finance Corporation Ltd.
Stock Value
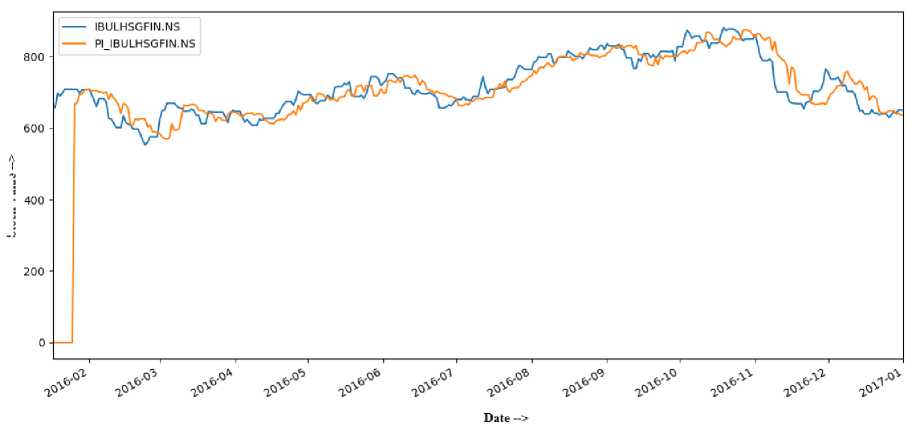
Fig.8. Indiabulls Housing Finance
-
VI. Performance analysis
In this section, we indicate that how much accuracy we are able to achieve from the prediction algorithm.
A. Error Calculation
T he convergence error is calculated as the percentage of the modulus of difference between the predicted value and the original values.
N
-
1 oi- pieavg = N∑ | oi |
i=1
From the above formula, we obtained the following Error percentage.
As shown in Table 3. The accuracy of the above model is moderate and we can use this model for stock prediction.
Table III. Errors
|
Company Stocks |
Error Percentage |
|
AXISBANK |
16.13% |
|
BANKBARODA |
6.99% |
|
HDFCBANK |
6.13% |
|
HDFC |
7.04% |
|
IBULHSGFIN |
6.39% |
|
ICICIBANK |
8.84% |
|
INDUSINDBK |
8.56% |
|
KOTAKBANK |
8.33% |
|
SBIN |
7.40% |
|
YESBANK |
9.09% |
-
VII. Conclusions and Future Work
-
A. Conclusion
Different macroeconomic variables and physical factors will affect the share prices of the different stock we took from financial sectors from NIFTY 50. Because of the compelling relation between the macroeconomic variables and different stock values it plays a vital role. Prediction of share prices will lead to various data analytic solution providers to recommend on which company one should invest for his capital.
-
B. Future work
We recommend the following future work a researcher can do for the stock prediction. Researchers can find the relation by more number of macroeconomic variables as well.
Finding the relation between other sectors as well will lead to a better scope for prediction. Predicting the stock prices of different companies will lead to the prediction of the main NIFTY50 index which is the open research platform for other indices as well.
Researchers can use other prediction algorithm and compare them to find which one results in the best for the stock prediction.
Acknowledgment
The authors wish to thank Mr. Rahul Ravi Jain a leading investor in the stock market for sharing his experience with us and providing us better insight into our work.
References Analysis and prediction of individual stock prices of financial sector companies in NIFTY50
- Huang, Wei, Yoshiteru Nakamori, and Shou-Yang Wang. "Forecasting stock market movement direction with support vector machine." Computers & Operations Research 32.10 (2005): 2513-2522.
- Bollen, Johan, Huina Mao, and Xiaojun Zeng. "Twitter mood predicts the stock market." Journal of computational science 2.1 (2011): 1-8.
- Baba, Norio, and Motokazu Kozaki. "An intelligent forecasting system of the stock price using neural networks." Neural Networks, 1992. IJCNN., International Joint Conference on. Vol. 1. IEEE, 1992.
- White, Halbert. "Economic prediction using neural networks: The case of IBM daily stock returns." (1988): 451-458.
- White, Halbert. "Economic prediction using neural networks: The case of IBM daily stock returns." (1988): 451-458.
- Wang, Jung-Hua, and Jia-Yann Leu. "Stock market trend prediction using ARIMA-based neural networks." Neural Networks, 1996., IEEE International Conference on. Vol. 4. IEEE, 1996.
- Kim, Kyoung-jae, and Ingoo Han. "Genetic algorithms approach to feature discretization in artificial neural networks for the prediction of stock price index." Expert systems with Applications 19.2 (2000): 125-132.
- Kuo, Ren Jie, C. H. Chen, and Y. C. Hwang. "An intelligent stock trading decision support system through integration of genetic algorithm based fuzzy neural network and artificial neural network." Fuzzy sets and systems 118.1 (2001): 21-45.
- Yang, Haiqin, Laiwan Chan, and Irwin King. "Support vector machine regression for volatile stock market prediction." International Conference on Intelligent Data Engineering and Automated Learning. Springer Berlin Heidelberg, 2002.
- Schumaker, Robert P., and Hsinchun Chen. "Textual analysis of stock market prediction using breaking financial news: The AZFin text system." ACM Transactions on Information Systems (TOIS) 27.2 (2009):12.
- Enke, David, and Suraphan Thawornwong. "The use of data mining and neural networks for forecasting stock market returns." Expert Systems with applications 29.4 (2005): 927-940.
- Bondt, Werner FM, and Richard Thaler. "Does the stock market overreact?." The Journal of finance 40.3 (1985): 793-805.
- Fama, Eugene F. "The behavior of stock-market prices.The journal of Business 38.1 (1965): 34-105.
- Chen, Nai-Fu, Richard Roll, and Stephen A. Ross. "Economic forces and the stock market." Journal of business (1986): 383-403.
- Schwert, G. William. "Why does stock market volatility change over time?." The journal of finance 44.5 (1989): 1115-1153.
- Lee, Wayne Y., Christine X. Jiang, and Daniel C. Indro. "Stock market volatility, excess returns, and the role of investor sentiment." Journal of banking & Finance 26.12 (2002): 2277-2299.
- Idowu, Peter Adebayo, et al. "Prediction of stock market in nigeria using artificial neural network." International Journal of Intelligent Systems and Applications 4.11 (2012): 68.
- Hedr, Ayman E., S. E. Salama, and Nagwa Yaseen. "Predicting Stock Market Behavior using Data Mining Technique and News Sentiment Analysis." International Journal of Intelligent Systems and Applications (IJISA) 9.7 (2017): 22-30.
