Analysis of amazon product reviews using big data- apache pig tool

Author: Amrit Pal Singh, Gurvinder Singh
Journal: International Journal of Information Engineering and Electronic Business @ijieeb
Article in issue: 1 vol.11, 2019.
Free access
We live in the era of digital technologies where data is increasing day by day at a very high rate. The data is further popularly classified as ‘Big Data’ because of its velocity, veracity, variety and its huge volume. This data could be unstructured, semi-structured or structured as it is divergent in nature. In this work, we would assess various categories of Amazon Product Reviews, the large datasets that contain around 144 million reviews in total. The datasets consists of Product reviews collected from Amazon, each having various numbers of attributes of 11 different categories. The motive of this work is to find and compare the ratings of the products during the lifespan of the product reviews. Another goal of this work is to help Amazon regarding the listing of the products in their database. This work aims to relate user’s ratings and reviews to discover how beneficial and good a product is [6]. User ratings are collected and are analyzed based on different categories (datasets) which gives an insight as to which product performs good and what are the problems associated to a certain non-performing product.
Section I focusses on the framework of Hadoop, its nodes and its functioning structural architecture.. Further Section II explains the work carried out by McAuley and how Big data is used to solve the industry’s problems. A step by step working model of the work is explained in section III, briefly describing the datasets. Section IV depicts the results and outcomes of the work. The conclusion of the work is can be examined in Section V
Short address: https://sciup.org/15016159
IDR: 15016159 | DOI: 10.5815/ijieeb.2019.01.02
Text of the scientific article Analysis of amazon product reviews using big data- apache pig tool
Published Online January 2019 in MECS
Extremely huge datasets that cannot be analyzed by a normal database software to find useful patterns, meaningful insights, behavior or decisions usually related to human activities is termed as Big Data[1].Data is proliferating day by day in terms of its size, complexity, variety and veracity. A set of new technologies and techniques is needed to uncover and integrate meaningful insights from a large, complex and diversified dataset. The data gathered from web, industries, research works, medicines or any other source participates in the creation of a large structured or unstructured datasets. Big Data is a mixture of both unstructured data (e-mails, manuals, documents, records etc.) and structured data (CSV’s and XLS’s files).
The Apache Hadoop is a framework that can scale up thousands of machines to process and store large Datasets [4] [9]. Apache Hadoop does not depend upon hardware to deliver high computation and performance, it’s built in library can handle the problems [5]. HDFS, Hadoop Distributed File System is a java-based architecture that is responsible for storing large volumes of data [8] [13]. HDFS can store upto 198PB of data and each cluster capable of processing around 4000 servers that can further support millions of files [9].
MapReduce is a fast processing fault-tolerant paradigm that can process huge amounts of data. MapReduce splits the data into two procedures, Map() and Reduce() [8]. The Map() procedure is responsible for taking the initial values and and producing intermediate key values while Reduce() procedure is responsible for processing the intermediate key values to the final results [10]. MapReduce works on the basis of Master-Slave architecture. Hbase is database management systems that runs above HDFS and provides read and write access [1]. It is similar to Google’s big table that is used to provide random access to huge structured data. Hbase does not support structured query language like SQL. Hbase is a column oriented database i.e. it stores data as columns of data rather than rows of data, coloumn oriented database is used for online Analytical Processing (OLAP) [7]. Apache Hive, initially developed by Facebook, used by many other companies like Netflix and Financial Industry [11]. It helps in data summarization, query and analysis of structured data by working on top of Apache Hadoop. Apache Hive allows the SQL developers to Hive Query Language that are similar to SQL commands [14]. Apache Hive further breaks these HQL statements into Hive Jobs for further execution through the Hadoop cluster. We can run Hive statements in various ways [7].
We could either run them in Hive shell (command line interface) and Java Database Connectivity. Hive is not appropriate for the applications that require very fast write operations [14]. It is a read based tool that cannot be used for transaction and other purposes that require very high rate of write operations [11].
Apache Pig is a platform developed at Yahoo Research for analyzing large data sets [11]. The SQL-like scripting language used by Apache Pig is called Pig Latin. Pig’s jobs can be executed in MapReduce or Apache Spark. It allows users to perform desired data manipulations and build complex applications in Hadoop with the help of User Defined Functions (UDF) [1] [5]. Sequence of steps can be assigned to define collective result. SQL can be used for analysis of small data sets but the manipulation of large data sets usually requires the involvement of experienced programmers with Pig Latin Approach [2]. Pig Latin ease programmers from writing MapReduce functions for low level operations. The attributes are in the form of int, double, float, long and char array. Pig programs can be executed in Script, Grunt and Embedded which works on both MapReduce and Local mode [8]. Pig Latin helps us to accomplish highly complex processing tasks due to its Extensive nature [10]. Depending upon the requirements our execution can be automatically optimized by the system. Due to its parallel processing it can simultaneously process multiple computations [4].
Amazon, an American e-commerce and cloud computing company was founded in July, 1994. It is known for Earth’s biggest store of CDs, books, a utomobile spare parts, Kids toys, electronics, Hardware etc. It is also known for manufacturing consumer electronics – Amazon Kindle, Amazon Alexa, Echo and many more. Amazon also let authors and publishers to publish and make their books available at the Kindle Store, with “Amazon Publishing” publishing arm on it [3].
The aim of our work is to compare the ratings of the products during the two lifespan i.e. between 1996-2011 and 2012-2014 and let the user make decision about a product by comparing the ratings. In this project, different categories of datasets are analyzed. Another aspect of this project can also be, to observe how ‘Amazon’ analyses the reviews on various products. Using the review generated information; Amazon can decide whether to continue listing a product or to remove it from its store. The work is carried out as stated below:
-
i. The attributes are filtered to omit unnecessary attributes.
-
ii. The dataset are divided into two time spans
-
iii. Average ratings and total number of reviews are counted for each time span for each dataset.
-
iv. The average ratings of both the time span are compared and analyzed for further results.
This analysis helps us to analyze how a specific product has performed in the past and how it is performing in the recent times.
-
II. Related Work
Dean & Ghemawat (2010) talks about Mapreduce, a model that comprises of Map and Reduce function for generating and processing of large data sets. The Map function processes key/value pair and generate a set of intermediate key/value pairs which are further merged by Reduce function.The paper talks about the system that was used to process more than 10,000 distinct programs using Mapreduce. Hadoop, an open source implementation of Mapreduce has been used by a lot of independent organisations outside Google.
Jopson (2011) highlighted the political fight between Amazon and other bricks-and-mortar rivals’ stores after calling a referendum on the state’s controversial move to tax online shopping. Most of the US online shoppers do not pay sales tax, because US did not had a a federal tax law on e-commerce.
The paper by McAuley, Pandey and Leskovec (2015) indicates the importance to understand how products are related to each other. These recommendation systems are referred to as substitutes and complements in economics. Such relationships help the user to identify items that are useful according to user’s search. The goal is to understand the relationship of substitutes and compliments from the context of online shopping reviews pattern. The system is evaluated on the Amazon product catalog, a large dataset comprising of around 9 million products, 144 million reviews and a huge amount of metadata.
According to McAuley, Targett, Shi and Van Den Hengel (2015) Humans develop a relationship between objects, on the base of their appearance, specifications and features. These recommendations might seen as being alternatives to each other while many seem as being complementary products. This information brief the choice people make. Human senses of relationships between objects are modelled based upon their appearances, design and specifications.
The study by McAuley and Yang (2016) says that Online reviews are always the first call for most of the users when considering a product online. We all have a lot of queries running in our mind before making a potential choice. These questions are answered with the help of large volume of consumer reviews of a product. We try to learn whether a review of a product is relevant to our query or not. Each review is considered as an expert that gets to vote on the response of a particular query of the user. The scenario also helps us to find relevance reviews are those that vote correctly.
The goal of the study by Mohanty, NathRout, Barik and Das is to study data analytics, big data and its various applications. The volume of data is increasing day by day significantly. The enterprises do not know how to process this data and find out useful information out of this meaningless data. Analytics is used to collect, organise and analyze this huge amount of data called as big data. The traditional procession techniques are not able to process this huge amount of data as various performance problems arise. It is now possible. Hadoop comes into the picture and allows this huge data to get processed, stored and analyzed.
A brief study on Big data by Rathi best explains the advanced techniques and process of capturing, storing, managing and analyzing petabytes or terabytes of unstructured, semi structured or structured data. Hadoop is the only solution for analyzing this huge data. Data is generated from multiple sources and can be processed parallely using Hadoop and a set of tools. HDFS (Hadoop Distributed file System) plays a key role in storing the data in distributed environment.
Mapreduce Library in a sumed up way. Further the paper focuses on Pig and Hive’s execution correlation.
Online reviews have become a reliable source of information for a particular product, organizations and business. Around 90% people trust online reviews rather than trusting personal recommendations while buying a product or investing in an organization a person may have set of queries in his/her mind, e.g. ‘is this earphones provide heavy base ?’, ‘Does windows 7 support this software ?’, ‘How many USB ports are there in this Smart TV ?’ [6]. A large number of online reviews are there to help answer all these queries. A person could find his/her relevant query in the list of reviews or could post his/her own review directly to the community via Q/A system. The system helps out a person by answering all the queries along with their ratings for that desired product, that could lead to average ratings of a product. This could help a person compare multiple same category products. Each review is considered as ‘helpful’ by getting a vote after responding to queries. A survey has found that around 72% consumers trust a product after reading positive reviews. An increase in one-star ratings leads to around 5-9% growth in business, at the same time negative reviews also lose the business. Around 60% people trust a product by its star ratings.
-
III. Methodology Used
This section focuses on framework of Hadoop, its nodes, MasterSlave architecture and how big problems that are faced in industries can be solved with the help of hadoop. Hadoop is nw adopted by almost all sectors like healthcare, aviation, government surveys, media etc. Apache Pig, a Big Data tool is yet another powerful tool that help us to overcome big problems following Apache Tez and Apache Spark. Datasets were categorized by McAuley, Assistant Professor, and Computer Science Dept,@UCSD. Around 17 categories of datasets are analyzed that sum up around 1.4 million reviews in total.
-
A. Implementation Environment
The Apache Hadoop is an open source software library that can compute large amounts of data. The framework allows distributed data processing using simple programming that can scale up from single server to several thousands of machines [4] [13]. The library can itself detect and handle faults rather than relying on the hardware to deliver high end results. The components of Hadoop, Hadoop Distributed file system (HDFS) can store huge data across thousands of machines to achieve high bandwidth, Hadoop Yet Another Resource Negotiator (YARN), manages resources and provides security. YARN allows multiple data processing engines to access the same data set simultaneously. Another component of Hadoop is MapReduce that uses masterslave architecture [1]. Master node processes initial data values and divides them into slave nodes that processes the intermediate values and passes them back to the
Master node [10]. Hadoop has moved far and is now adopted by almost each and every business sector i.e. finance, hospitality, aviation, government surveys, automobile, pharmaceuticals, healthcare, media and entertainment and other industries. Hadoop includes variety of tools each possess different features and techniques [4].
Apache pig is a platform that allows us to create and run programs that can be run on Apache Hadoop [8]. The language in which programs are written in Pig is called Pig Latin [2]. Pig jobs can be executed in Apache Spark, MapReduce and Apache Tez. It is a tool that is used to analyze large datasets. Pig eliminates programmers from writing length and complex Java codes that too saves a lot of their time [2] [12]. As pig uses multi-query approach, it replaces 200 lines of java code with nearly 10 lines of code in Apache Pig. So it reduces the development time by around 16 times [12].
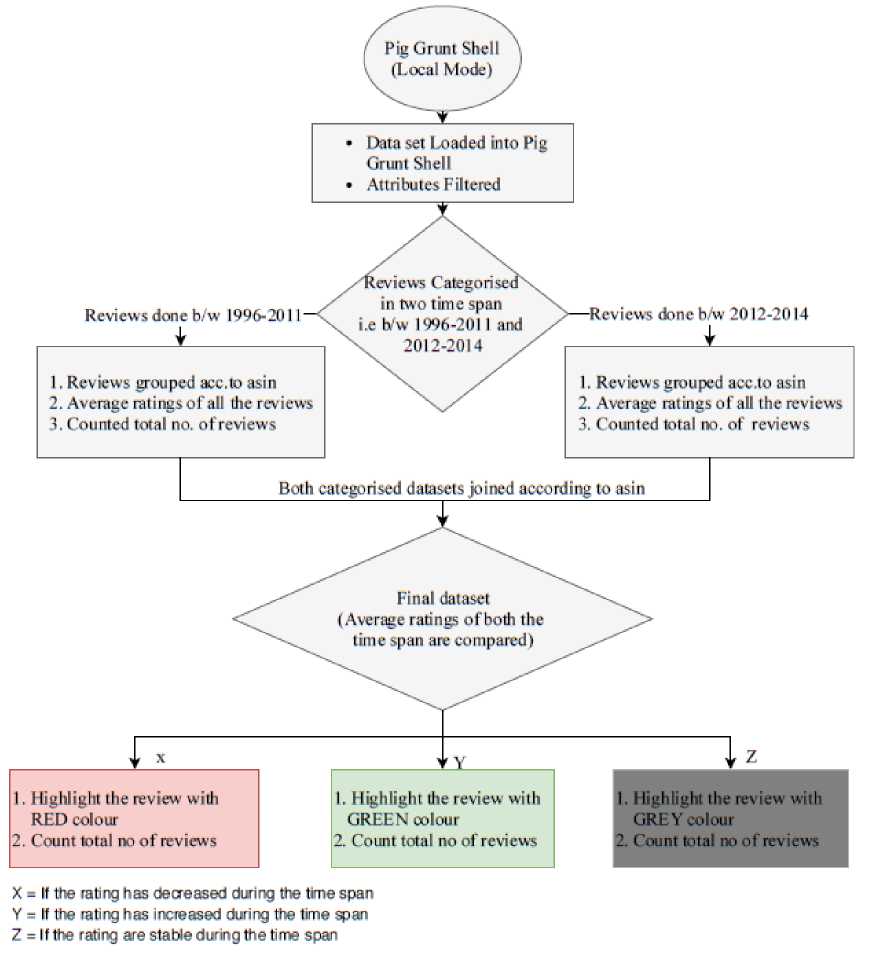
Fig.1. Flow graph of the work
The work is carried out in the listed sequential manner:
-
i. The datasets were loaded into Pig Grunt Shell (Local Mode).
-
ii. Unnecessary attributes were filtered to give out asin(Product I’d), overall(Ratings) and ReviewTime in terms of year in which the review was done.
-
iii. A new comma (,) separated structured dataset was created containing all the filtered attributes using PigStorage and further loaded again into Pig grunt shell.
-
iv. The reviews were categorized into two time span i.e. reviews done between 1996 and 2011 and reviews done between 2012 and 2014.
-
v. Each categorized dataset was further grouped according to asin that helped us to gather all the reviews of a particular product in each dataset.
-
vi. Average rating of each product was calculated in both the datasets, total number of reviews was counted and a new dataset was created.
-
vii. Both categorized datasets were joined according to mutual asin.
-
viii. Each review’s ratings are compared i.e. between 1996-2011 and 2012-2014. This helped us to analyze whether the ratings has been increased, decreased or are stable during the two time span.
-
B. Dataset Description
The datasets used for implementation were provided by Julian McAuley, Assistant Professor, Computer Science Dept,@UCSD. Datasets were categorized on the basis of product categories, each dataset comprising of no. of reviews of all the products of a particular category listed by Julian McAuley. Around 17
categories(Automotive[20,473 reviews], Baby[160,762 reviews], Beauty[198,502 reviews], Cell Phones and Accessories[194,439 reviews], Clothe Shoe and Jewellery [278,677 reviews], Digital Music[64,706 reviews], Grocery and Gourmet Food[151,254 reviews], Health and Personal Care[346,355 reviews], Home and Kitchen[551,682 reviews], Kindle Store[982,619
reviews], Musical Instruments[10,261 reviews], Office Products[53,258 reviews], Pet Supplies[157,836
reviews], Sports and Outdoors[296,337 reviews], Tools and Home Improvement[134,476 reviews], Toys and Games[167,597 reviews], Video Games[231,780 reviews]) of datasets are analyzed. Each dataset comprises of product reviews along with its metadata spanning between May 1996 - July 2014. Each and every review subsume the following attributes:
-
■ ReviewerlD - reviewer’s ID, e.g. ABCUAM16494
-
■ asin - Product’s ID, e.g. 00000015487
-
■ reviewerName - Reviewer’s Name, e.g. John
-
■ reviewText - review made of the person
-
■ overall - the product’s rating
-
■ summary - review summary
-
■ unixReviewTime - review’s unix time
-
■ reviewTime - review’s raw time
The datasets (.json format) were categories in two categories i.e. between 1996-2011 and between 20122014 that were analyzed to let the reviewer know whether a product has been degraded, in constant demand or has become more popular during the span of data depending upon the ratings of the product. It can further also help Amazon decide which product should be removed from their database by comparing the ratings of the product.
-
C. Performance Measures
In this project, dataset of Amazon Product Reviews is taken, a dataset contains reviwer ID, asin, reviewer
Name, helpful, reviewText, overall ratings, summary, unix review time, review time. In this p roject the data is analyzed by overall average ratings of the product. Then these average ratings of the product between year 19962011 and between year 2012-2014 are compared and concluded that which products are outdated, stable and in demand.
-
IV. Experimental Result and Analysis
-
A. Explanation of results (Table 1 & Table 2)
As shown in Table 2 the Automotive dataset contains a total of 37988 products out of which 17357(45.69%) products are outdated, 9602(25.28%) are stable and 11029(29.03%) are still in demand. Baby dataset contains 5206(42.95%) outdated products, 2679(22.10%) stable products and 4235(34.94%) demanding products that make a total of 12120 products. The Beauty Dataset contains 44383 products in total out of which 21547(48.55%) are outdated products, 10323(23.26%) are stable products and 12513(28.19%) products are in demand. Cell Phones and Accessories datasets have 10926(46.89%) outdated products, 3820(16.39%) stable products and 8554(36.71%) of demanding products, summing up a total of 23300 products. Clothe Shoe and Jewellery Dataset comprises of 81827 products in total out of which there are 38336(46.85%) of outdated products, 18312(22.38%) of stable products and 25179 (30.77%) products are still in demand. Digital Music dataset has a total of 16828 products in which 4777(28.39%) are outdated products, 7099(42.19%) stable products and 4952(29.43%) demanding products. Further refer to Table 1 and Table 2 for the study and analysis of remaining category datasets. In table 1, automotive category dataset, it can be observed that there are large numbers of products that have been outdated. There are fewer products that are stable. The products whose demands have increased over the span of time have a larger figure than those of stable products. The same pattern can be observed in most of the categories of datasets.
-
B. Analysis of Results
As per the analysis in Table1 and Table 2 it is clear that Automotive, Baby, Beauty, Cell Phones and Accessories, Grocery and Gourmet Food, Health and Personal Care, Home and Kitchen, Kindle Store, Musical Instruments, Office Products, Pet Supplies, Sports and Outdoors, Tools and Home Improvements and Toys and Games have a majority of outdated products, Digital Music Category dataset has a majority of stable products while only Video Games is only the only category that has majority of demanding products in it. So, the above analysis can be used by Amazon to update their database according to the user’s rating study and analyis.
Table 1. Analysis of Products in each Dataset
|
S.No |
Dataset |
Total no. of Products |
Comparison of Products b/w 1996-2011 and 2012-2014 |
||
|
Outdated |
Stable |
Products In Demand |
|||
|
1 |
Automotive |
37988 |
17357 |
9602 |
11029 |
|
2 |
Baby |
12120 |
5206 |
2679 |
4235 |
|
3 |
Beauty |
44383 |
21547 |
10323 |
12513 |
|
4 |
Cell Phones and Accessories |
23300 |
10926 |
3820 |
8554 |
|
5 |
Clothe shoe and Jewellery |
81827 |
38336 |
18312 |
25179 |
|
6 |
Digital Music |
16828 |
4777 |
7099 |
4952 |
|
7 |
Grocery and Gourmat Food |
31717 |
14513 |
8240 |
8961 |
|
8 |
Health and Personal Care |
49246 |
24430 |
10266 |
14550 |
|
9 |
Home and Kitchen |
68002 |
29583 |
15270 |
22579 |
|
10 |
Kindle Store |
25062 |
12241 |
6022 |
6799 |
|
11 |
Musical Instruments |
17182 |
7166 |
4868 |
5148 |
|
12 |
Office Poducts |
22841 |
10912 |
4604 |
7325 |
|
13 |
Pet Supplies |
20438 |
10057 |
4399 |
5982 |
|
14 |
Sports and Outdoors |
67443 |
31275 |
15552 |
20616 |
|
15 |
Tools and Home Improvements |
46208 |
21206 |
10411 |
14591 |
|
16 |
Toys and Games |
55503 |
21736 |
14243 |
19524 |
|
17 |
Video Games |
19971 |
7519 |
3603 |
8849 |
Table 2. Percentage of Products
|
S.No |
Dataset |
Outdated (%) |
Stable (%) |
Products In Demand (%) |
|
1 |
Automotive |
45.69 |
25.28 |
29.03 |
|
2 |
Baby |
42.95 |
22.1 |
34.94 |
|
3 |
Beauty |
48.55 |
23.26 |
28.19 |
|
4 |
Cell Phones and Accessories |
46.89 |
16.39 |
36.71 |
|
5 |
Clothe shoe and Jewellery |
46.85 |
22.38 |
30.77 |
|
6 |
Digital Music |
28.39 |
42.19 |
29.43 |
|
7 |
Grocery and Gourmet Food |
45.76 |
25.98 |
28.26 |
|
8 |
Health and Personal Care |
49.61 |
20.85 |
29.55 |
|
9 |
Home and Kitchen |
43.87 |
22.65 |
33.48 |
|
10 |
Kindle Store |
48.84 |
24.03 |
27.13 |
|
11 |
Musical Instruments |
41.71 |
28.33 |
29.96 |
|
12 |
Office Products |
47.77 |
20.16 |
32.07 |
|
13 |
Pet Supplies |
49.21 |
21.52 |
29.27 |
|
14 |
Sports and Outdoors |
46.37 |
23.06 |
30.57 |
|
15 |
Tools and Home Improvements |
45.89 |
22.53 |
31.58 |
|
16 |
Toys and Games |
39.16 |
25.66 |
35.18 |
|
17 |
Video Games |
37.65 |
18.04 |
44.31 |
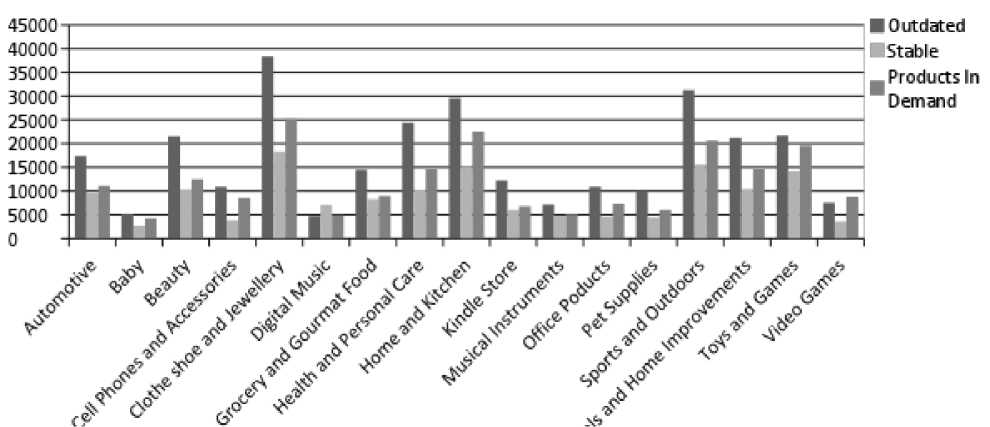
Table 2 clearly depicts that almost 45% to 49% of products gets outdated over time. Various studies can be carried out on the basis of this results that will further help out Amazon to make their database full of highest selling products. In order to grow and dominate the market of E-commerce business Amazon should add all the latest products more often in order to increase the ratio of latest products. This will further increase the sales and will help out Amazon to dominate the market.
-
This project aims to relate user’s ratings and reviews to discover how beneficial and good a product is. User ratings are collected and are analyzed based on different categories (datasets) which gives an insight as to which product performs good and what are the problems associated to a certain non-performing product. In this project overall average rating of the product of different categories is generated. Average ratings of product of different categories are compared by the years between 1996-2011 and 2012-2014. And presently can conclude that how many products are outdated, stable and in demand.
As the data is increasing day by day, more than 30 million devices will be connected by 2020. Each day more than 2.9 quintillion of data is created. According to Forbes.com the data is estimated to grow at a rate of more than 45x over one year through 2020. As the tools are build up on the existing paradigm of Hadoop Distributed File System (HDFS) and MapReduce. The analytical tools are under continuous active development. New features and tools are developed continuously to enhance the analytical approach.
The new dataset i.e. structured data created (.csv files) in the project, later can be used by Amazon to have a overlook at their products to find that demands of which products are increasing and decreasing. And can find the factors that are leading to the decreasing demand of particular product. If products are decreasing there brand quality then they can remove that product from there database. And by looking at products whose demands are increasing then they can add more varieties to that category.
References Analysis of amazon product reviews using big data- apache pig tool
- J., Dean, & S., Ghemawat (2010). MapReduce: a flexible data processing tool. Communications of the ACM, 53(1), 72-77.
- J., Mehine (2011). Raamistiku Apache Pig kasutamine suuremahulises andmeanalüüsis (Doctoral dissertation, Tartu Ülikool).
- B., Jopson (2011). Amazon urges California referendum on online tax. The Financial Times, 4.
- J., McAuley, R. Pandey & J. Leskovec (2015, August). Inferring networks of substitutable and complementary products. In Proceedings of the 21th ACM SIGKDD International Conference on Knowledge Discovery and Data Mining (pp. 785-794). ACM.
- J., McAuley, C., Targett, Q., Shi, & A., Van Den Hengel (2015, August). Image-based recommendations on styles and substitutes. In Proceedings of the 38th International ACM SIGIR Conference on Research and Development in Information Retrieval (pp. 43-52). ACM.
- J., McAuley, & A. Yang, (2016, April). Addressing complex and subjective product-related queries with customer reviews. In Proceedings of the 25th International Conference on World Wide Web (pp. 625-635). International World Wide Web Conferences Steering Committee.
- S., Mohanty, K., NathRout, S., Barik, & S.K., Das. A Study on Evolution of Data in Traditional RDBMS to Big Data Analytics.
- S., Singh, V., Mandal, & S., Srivastava. The Big Data Analytics with Hadoop
- Apache Hadoop, http://hadoop.apache.org
- R., Shobana, D., Saranya. Hadoop on Big Data Analysis. International Journal of Advanced Research Trends in Engineering and Technology
- S., Dhawan, & S., Rathee (2013). Big data analytics using Hadoop components like pig and hive. American International Journal of Research in Science, Technology, Engineering & Mathematics, 88, 13-131.
- Pig Latin Reference Manual 2. https://pig.apache.org/docs/r0.8.1/piglatin_ref2.html
- S., Rathi. A brief Study of Big Data Analytics using Apache Pig and Hadoop Distributed File System
- E. L., Lydia, & M. B., Swarup. Analysis of Big data through Hadoop Ecosystem Components like Flume, MapReduce, Pig and Hive.
