Analysis of Electroencephalogram Signals in Different Sleep Stages using Detrended Fluctuation Analysis

Author: Ateke Goshvarpour, Ataollah Abbasi, Atefeh Goshvarpour
Journal: International Journal of Image, Graphics and Signal Processing(IJIGSP) @ijigsp
Article in issue: 12 vol.5, 2013.
Free access
Scaling behavior is an indicator of the lack of characteristic time scale, and the existence of long-range correlations related to physiological constancy preservation. To investigate the fluctuations of the sleep electroencephalogram (EEG) over various time scales during different sleep stages detrended fluctuation analysis (DFA) is studied. The sleep EEG signals for analysis were obtained from the Sleep-EDF Database available online at the PhysioBank. The DFA computations were performed in different sleep stages. The scaling behavior of these time series was investigated with detrended fluctuation analysis (window size: 50 to 500). The results show that the mean values of scaling exponents were lower in subjects during stage 4 and standard deviation of scaling exponents of stage 4 was larger than that of the other stages. In contrast, the mean value of scaling exponents of stage 2 was larger, while a small variation of scaling exponent is observed at this stage. Therefore, DFA has a more stable behavior in stage 2, whereas the random variability and unpredictable behavior of DFA can be observed in the stage 4. In conclusion, scaling exponent indices are efficacious in quantifying EEG signals in different sleep stages.
Detrended Fluctuation Analysis, Electroencephalogram, Nonlinear Behavior, Scaling exponents, Sleep Stages
Short address: https://sciup.org/15013151
IDR: 15013151
Text of the scientific article Analysis of Electroencephalogram Signals in Different Sleep Stages using Detrended Fluctuation Analysis
-
I. 0BINTRODUCTION
Specific transient fluctuations in the signals are integrated into the definitions of the stages. Understanding the sleep stage distributions permits normal and pathological sleep to be differentiated [1]. By applying features of brain wave, eye movements, and muscle tone, sleep stages are generally distinguished [2]. electroencephalogram (EEG) signal is one of the most important discriminator between wakefulness and sleep, and between various sleep stages [3].
The main states of vigilance consists of wakefulness, rapid eye movement (REM) sleep and nonREM sleep. NonREM sleep is further comprised four stages from the lightest Stage 1 to the deepest Stage 4 [4]. The occurrence of sleep stages varies during the night - in the early hours of sleep slow wave sleep dominates, while REM sleep commonly arises in the second part of sleep. In fact, low voltage -(103 0μV) and mixed frequency EEG can be observed during wakefulness. Stage 1 (drowsiness) is described by low voltage, mixed frequency EEG with the highest amplitude in the range of 2-7 Hz and their amplitude can extent to the value of about 200 μV. In addition, in this stage eyes move very slowly. Sleep 2 stage is the light sleep state in which the eye movement is stopped and the brain waves are become slower. Stage 2 is described by wave patterns sleep spindles and K complexes and the absence of slow waves. K complex is a sharp negative wave followed by a slower positive one. Sleep spindles happen in 12-14 Hz frequency range. The minimum duration of these patterns is about 0.5 s. In stage 3 (deep sleep), extremely slow brain waves called delta waves begin to appear, combined with smaller, faster waves. In this case, the frequency range of EEG signal is about 1-3 Hz, while its amplitude is high. By stage 4 (deep sleep, slow wave sleep), delta waves are appeared in the brain activity. During stages 3 and 4, which are called deep sleep, it is very difficult to wake someone up. In stage 4, the EEG amplitude is high, but its frequency range is about less than 2 Hz. Subjects have rapid eyes movement along with the occasional muscular twitches in sleep 5 (REM) stage. In addition, theta wave is more predominant in this sleep stage.
It has shown that the physiological systems like brain have nonlinear behavior in health [5]. Therefore, several nonlinear indexes of EEG time series have been studied in healthy subjects, in various mental and physical states and in different pathologies [6-9].
The scalp EEG arises from a large number of neurons which have nonlinear interactions [10]; therefore, they can generate fluctuations that are not best described by linear approaches [11]. The human brain is a complex nonlinear system [12]. Some nonlinear method such as correlation dimension and Lyapunov exponents are very sensitive to noise and the stationary condition is needed, while EEG signals have a high non-stationary behavior [13].
Detrended fluctuation analysis (DFA) is one of nonlinear methods, which is widely used in bio-signal analysis owing to its robustness and capability to recognize nonlinear time series, and also avoids the spurious detection of apparent long-range correlations that are an artifact of non-stationary. In addition, it is a scaling analysis method providing a simple quantitative parameter (scaling exponent) to represent the long-range correlation properties of a signal [14].
A pioneer work done by Peng et al. [15] proposed the concept of DFA while examining a series of DNA nucleotides. It has subsequently been used in various fields especially in medical and physiological time series such as cardiac dynamics [16], breathing [17], blood pressure [18], nerve spike intervals [19], human gait [20], glucose levels [21], and EEG time series [22].
The reliable evaluation of polysomnographic recordings (PSG) is an essential precondition for good clinical practice in sleep medicine. Therefore, many publications can be found in the literature on automatic sleep/wake stages analysis. Zoubek et al. [23] applied frequency and time domain features on sleep EEG. Ferri et al [24] characterized the different levels of EEG synchronization during sleep (in the 0.25–2.5 Hz band) by means of the synchronization likelihood (SL) algorithm and analyzed its long-range temporal correlations. In another study [6], the sleep EEG analysis is carried out using non-linear parameters such as correlation dimension, fractal dimension, largest Lyapunov, entropy, approximate entropy, Hurst exponent, phase space plot and recurrence plots. Employing recurrence analysis, Carrubba et al [25] developed a method for capturing and quantifying the dynamical states of the brain during sleep. Recently, Brignol et al [26] proposed a new phase space-based (mainly based on Poincaré plot) algorithm for automatic classification of sleep–wake states in humans using short-time EEG data.
This study is concerned with quantifying dynamic properties of human sleep EEG in terms of power laws. Therefore, to investigate the fluctuations of the sleep
EEG over various time scales during different sleep stages DFA is studied.
The outline of this study is as follows. In the next section, we briefly describe the set of EEG time series used in our study. Then, the computation of the DFA and scaling exponent is explained. Finally, the results of the present study are shown and the study is concluded.
-
II. BACKGROUND
A. Data selection
The EEG data for analysis were obtained from the Sleep-EDF Database available from the Physionet databank [27]. This is a collection of sleep recordings from 8 healthy individuals. Each recording consist of two EEG signals, electrooculogram (EOG), and an event marker, and is accompanied by a manually-scored hypnogram. Four recordings also include sub-mental electromyogram (EMG), and the other four recordings also include the sub-mental EMG envelope, oro-nasal airflow, and body temperature. The recordings were obtained from Caucasian males and females (21—35 years old) without any medication. The recordings were taken for 24 hours from eight subjects. Sleep EEG for 80 hours is extracted from the recordings and sampled at 100 Hz. The sleep stages are scored according to Rechtschaffen and Kales based on Fpz-Cz/Pz-Oz EEG [28]. In this study, EEG signals of these two channels of 7 subjects were analyzed.
B. Detrended fluctuation analysis
The method of detrended fluctuation analysis has proven useful in revealing the extent of long-range correlations in time series. Briefly, in order to analyze the time series (with N samples), it is integrated at first. Next, the integrated time series is divided into boxes of equal length, n . In each box of length n , a least squares line is fit to the data (representing the trend in that box). The y coordinate of the straight line segments is denoted by y n (k).
Next, the integrated time series, y(k), is detrend by subtracting the local trend, yn(k), in each box. The rootmean-square fluctuation of this integrated and detrended time series is calculated by:
-
1 N (1)
—El y ( k ) - У п ( k ) ] 2
, N k = 1
This calculation is repeated over all time scales (box sizes) to describe the relationship between F(n), the average fluctuation, and the box size, n . Typically, F(n) will increase with box size. A linear relationship on a log-log plot indicates the occurrence of power law (fractal) scaling. Under such conditions, the fluctuations can be characterized by a scaling exponent, the slope of the line relating log F(n) to log n .
The study of the dependence of F(n) on the window size n , which ranges from 5 to 500 in this study, is the
F ( n ) =
Analysis of Electroencephalogram Signals in Different Sleep Stages using Detrended Fluctuation 51
Analysis essence of DFA. If it is a power-law behavior:
F ( n ) ∝ n α (2)
Then the scaling exponent α is an indicator of the nature of the fluctuations in EEG. It may be viewed as a nonlinear index of the complexity of the EEG signals [12,29].
The study of the dependence of F(n) on the window size n is the essence of DFA. If there is a power-law behavior ( F ( n ) ∝ n α ), α is an indicator of the nature of the fluctuations in the EEG. This exponent is 0.5 for uncorrelated white noise [29]. If α <0.5, the correlations in the signal are anti-persistent (i.e. an increment is very likely to be followed by a decrement, and vice versa), while if α >0.5 the correlations in the signal are persistent (i.e., an increment is very likely to be followed by an increment, and vice versa) [30]. The exponents estimated by DFA lie between 0 and 2.
If there are only short-term correlations, the initial slope may be different from 0.5, but α will approach 0.5 for large window sizes. If α is greater than 0.5 and less than (or equal to) 1, it indicates the persistent long-range power-law correlations. In contrast, 0 < α <0.5 indicates a different type of power law correlation such that large and small values of the time series are more likely to alternates [30]. A special case of α = 1corresponds to 1/f noise [31,32]. For α≥ 1, correlations exist but cease to be of a power-law form; α = 1.5 indicates Brown noise, the integration of white noise. The α exponent can also be viewed as an indicator that describes the roughness of the original time series: the larger the value of α, the smoother the time series. In this context, 1/f noise can be interpreted as a compromise between the complete unpredictability of white noise (very rough landscape) and the very smooth landscape of Brownian noise [33,34].
C. Statistical analysis
In this study, the Wilcoxon of the null hypothesis that the data in the vector x and y are independent samples from identical continuous distributions with equal medians, against the alternative that they do not have equal medians. The result of the test is returned in p-value. P-value→0 indicates a rejection of the null hypothesis at the 5% significance level ( p <0.05). P-value→1 indicates a failure to reject the null hypothesis at the 5% significance level.
-
III. RESULTS
Two channels of EEG recordings (Fpz-Cz/Pz-Oz) and the hypnogram scoring are shown in Figure 1.
In DFA calculation, the window size varied from 50 to 500, and a linear regression was made. All the computations were performed using MATLAB.
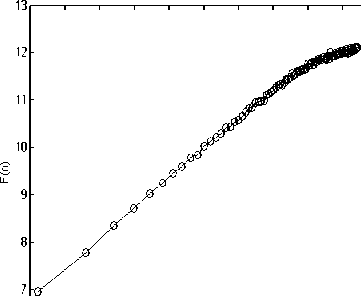
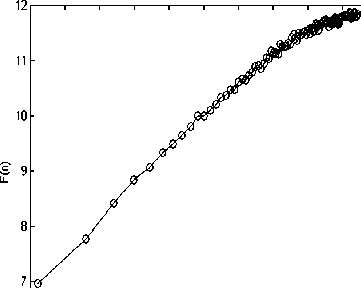
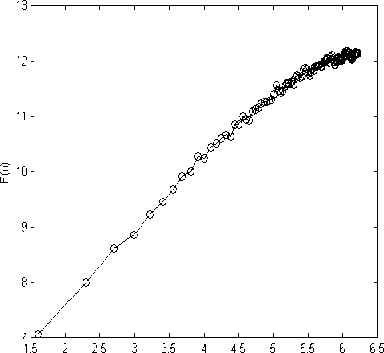
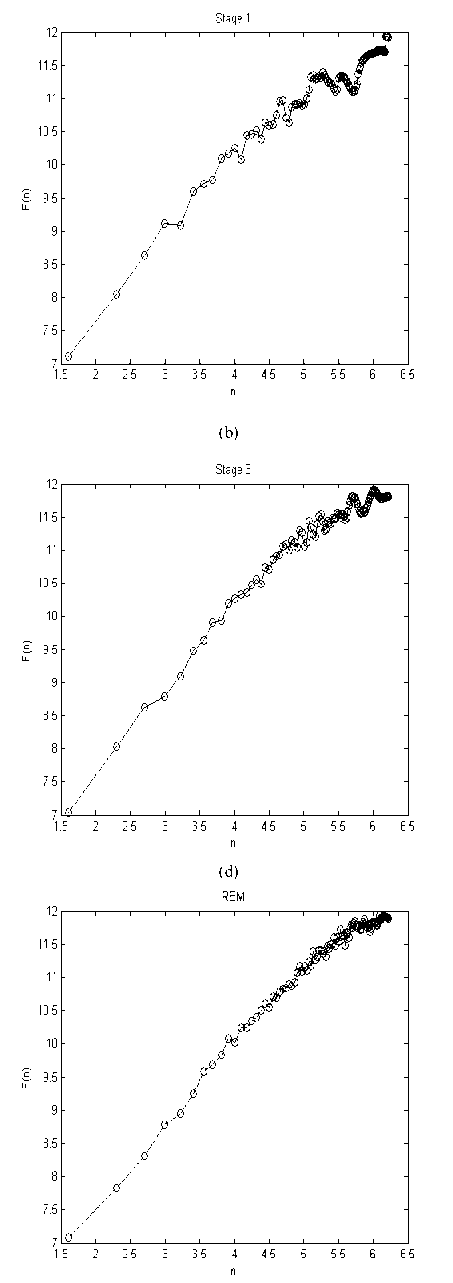
Figure 2 depicts the typical DFA computation results of each sleep stage and in wakefulness in one subject.
For quantifying these trends, scaling exponent, the slope of the line relating F(n) to n is calculated. Plot of means and standard deviations of scaling exponents for each sleep, REM and waken stage are presented in Figure 3. The DFA of EEG signals were computed, and scaling exponents were obtained as shown in Table I.
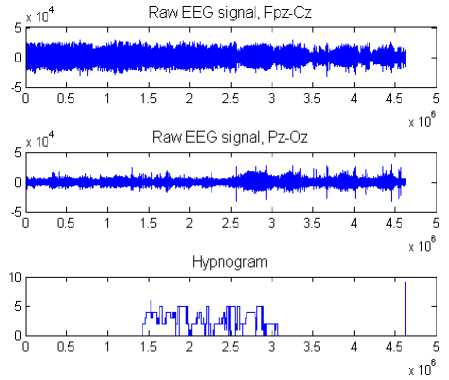
Figure 1. EEG recordings (Fpz-Cz / Pz-Oz channels) and hypnogram scoring.
As shown in Table I, DFA approach has shown significant deviations during different sleep stages from the normal range of scaling exponents. Therefore, these differences might be an indicator of dysfunction in the dynamics of related neuronal networks.
-
IV. DISCUSSION
The scaling behavior of EEG time series in different sleep stages and in wakefulness was analyzed using DFA. Using this approach, it was shown that the scaling exponents cannot be considered as constant over these stages. In other words, the Wilcoxon test disclosed significant differences between different sleep stages and the wakefulness range of scaling exponents. These scaling properties were found in both channels for all subjects.
DFA is one of the most frequently used techniques to analyze long-range correlations in various bio-signals, specially the EEG signals. It has been used to study the dissimilarities between the scaling behavior of EEG signals in sleep apnea and control subjects [35]. It has shown that the scaling exponents of EEG signals during apnea were lower than that of the healthy subject for all the stages.
To study the fluctuations of the sleep EEG over various time scales during major depressive episodes, scaling behavior is considered by means of DFA [36]. It has shown that Major depressive episodes are characterized by a modification in the correlation structure of the sleep EEG time series. The authors claimed that the observed modifications in scaling behavior in acutely depressed patients could be an explanation of the sleep fragmentation and instability found during major depressive episodes.
Wake
g______________________।iiiiiiii______________________
1.5 2 2.5 3 3.5 4 4.5 5 5.5 6 6.5
(a)
Stage 2
5______________________i______________________i______________________i______________________i______________________i______________________i______________________i______________________i______________________i______________________
1.5 2 2.5 3 3.5 4 4.5 5 5.5 6 6.5
(c)
Stage 4
(e)
(f)
Figure 2. F(n) vs. (n) for each sleep, REM and waken stage representation. (a) Wake, (b) Stage 1, (c) Stage 2, (d) Stage 3, (e) Stage 4, (f) REM.
By applying DFA to the synchronizations between the high frequency component of heart rate variability and all sleep power bands, Dumont et al [37] stated that the interdependence and the scaling exponent are not modified in patients suffering from Sleep Apnea– Hypopnea Syndrome (SAHS) as compared to controls.
In this article, using scaling exponents, some interesting results can be achieved: 1) For different sleep stages, not only the mean value of scaling exponent was different, but also different sleep stages led to dissimilar EEG activity patterns in different regions of brain (Fpz-Cz and Pz-Oz Channels); 2) Compared with the wakefulness, the mean value of scaling exponent of stage 4 was smaller, while the mean value of scaling exponent of stage 2 was larger; 3) Standard deviation of scaling exponent did not have similar trend. In fact, Standard deviation of scaling exponents of stage 4 was larger than that of others, while this value had a small variation in REM, stage 1 and stage 2. Therefore, one can conclude that DFA has a more stable behavior in stage 2, whereas the random variability and unpredictable behavior of DFA can be observed in the stage 4.
Some limitations of our study merit consideration. First of all, fractal scaling behavior identified from the EEG in our study is only reported within one scaling regions, whereas it can be characterized accurately by the slopes in two regions in which the first region corresponds to small window size and the second one corresponds to larger window size. Next, the result of this study is performed in two channels of EEG signals. For examining the effect of different sleep stages on brain behavior, this method could be extended on various electrode positions of the scalp. Finally, although our results show that the DFA was significantly different in various sleep stages, further studies with a larger sample size are required to prove the usefulness of this methodology.
References Analysis of Electroencephalogram Signals in Different Sleep Stages using Detrended Fluctuation Analysis
- Chokroverty S, Thomas RJ, Bhatt M. Atlas of sleep medicine. 1st ed. Philadelphia, PA: Elsevier; 2005.
- Stiller JWgos, Postolache TT. Sleepwake and other biological rhythms: functional neuroanatomy. Clinics in Sports Medicine , 2005, 24: 205-235.
- Werth E, Achermann P, Borbély AA. Fronto-occipital EEG power gradients in human sleep. Journal of Sleep Research , 1997, 6: 102-112.
- Aserinsky E, Kleitman N. Regularly Occuring Periods of Eye Motility, and Concomitant Phenomena, During Sleep. Science, 1953, 118:273–274.
- Higgins JP. Nonlinear systems in Medicine. Yale Journal of Biology and Medicine, 2002, 75(5–6): 247–260.
- Acharya UR, Faust O, Kannathal N, Chua T, Laxminarayan S. Non–linear analysis of EEG signals at various sleep stages, Computer Methods and Programs in Biomedicine, 2005, 80: 37—45.
- Janjarasjitt S, Scher MS, Loparo KA. Nonlinear dynamical analysis of the neonatal EEG time series: The relationship between neurodevelopment and complexity. Clinical Neurophysiology, 2008, 119: 822–836.
- Goshvarpour A, Goshvarpour A, Rahati S, Saadatian V, Morvarid M. Phase space in EEG signals of women referred to meditation clinic. Journal of Biomedical Science and Engineering, 2011, 4: 479–482.
- Lee Y.J, Zhu Y–S, Xu Y–H, Shen M–F, Zhang H–X, Thakor NV. Detection of non–linearity in the EEG of schizophrenic patients. Clinical Neurophysiology, 2001, 112: 1288–1294 .
- Linkenkaer–Hansen K, Nikouline VV, Palva JM, Ilmoniemi RJ. Long–range temporal correlations and scaling behavior in human brain oscillations. The Journal of Neuroscience, 2001, 21(4): 1370–1377.
- Hwa RC, Ferree TC. Scaling properties of fluctuations in the human electroencephalogram. Physical Review E, 2002, 66(2): 021901–021908.
- Ferree TC, Hwa RC. Power–law scaling in human EEG: relation to Fourier power spectrum. Neurocomputing, 2003, 52–54: 755–761.
- Lee JM, Kim DJ, Kim IY, Park KS, Kim SI. Detrended fluctuation analysis of EEG in sleep apnea using MIT/BIH polysomnography data. Computers in Biology and Medicine, 2002, 32(1): 37–47.
- Gifani P, Rabiee HR., Hashemi MR, Taslimi P, Ghanbari M. Optimal fractal–scaling analysis of human EEG dynamic for depth of anesthesia quantification, Journal of the Franklin Institute, 2007, 344: 212–229.
- Peng C–K, Buldyrev SV, Havlin S, Simons M, Stanley HE, Goldberger AL. Mosaic organization of dna nucleotides. Phys Rev E Stat Phys Plasmas Fluids Relat Interdiscip Topics, 1994, 49(2):1685–1689.
- Peng C–K, Havlin S, Stanley HE, GoldbergerAL. Quantification of scaling exponents and crossover phenomena in nonstationary heartbeat time series. Chaos, 1995, 5: 82–87.
- Campana LM, Owens RL, Malhotra A, Suki B. Detrended Fluctuation Analysis Of Respiratory Parameters During Sleep In People With And Without Asthma. American Journal of Respiratory and Critical Care Medicine, 2012, 185: A6420.
- Galhardo C.E.C, Penna T.J.P, Argollo de Menezes M, Soares P.P.S. Detrended fluctuation analysis of a systolic blood pressure control loop. New Journal of Physics , 2009, 11: 103005.
- Nelson ME. Multiscale spike train variability in primary electrosensory afferents, Journal of Physioloy – Paris 96, 2002, 507 – 516.
- Damouras S, Chang MD, Sejdić E, Chau T. An empirical examination of detrended fluctuation analysis for gait data. Gait Posture, 2010, 31(3):336–340.
- Ogata H, Tokuyama K, Nagasaka S, Ando A, Kusaka I, Sato N, Goto A, Ishibashi S, Kiyono K, Struzik ZR, Yamamoto Y. Long–range correlated glucose fluctuations in diabetes. Methods of Information in Medicine, 2007, 46(2):222–226.
- Lee J–M, Kim D–J, Kim I–Y, Park KS, Kim SI. Nonlinear–analysis of human sleep EEG using detrended fluctuation analysis. Medical Engineering & Physics, 2004, 26: 773–776.
- Zoubek L, Charbonnier S, Lesecq S, Buguet A, Chapotot F. Feature selection for sleep/wake stages classificationusing data driven methods, Biomedical Signal Processing and Control, 2007, 2:171–179.
- Ferri R, Rundo F, Bruni O, Terzano MG, Stam CJ. Dynamics of the EEG slow–wave synchronization during sleep. Clinical Neurophysiology, 2005, 116: 2783–2795.
- Carrubba S, Kim PY, McCarty DE, Chesson Jr. AL, Frilot C, Marino AA. Continuous EEG–based dynamic markers for sleep depth and phasic events. Journal of Neuroscience Methods, 2012, 208: 1– 9.
- Brignol A, Al–ani T, Drouot X. Phase space and power spectral approaches for EEG–based automatic sleep–wake classification in humans: A comparative study using short and standard epoch lengths. Computure Methods and Programs in Biomedicine, 2013, 109(3): 227–238.
- www.physionet.org.
- Rechtschaffen A, Kales A. A manual of standardized terminology, techniques and scoring system for sleep stages of human subjects. Brain Information Service/Brain Research Institute, University of California, Los Angeles, 1968.
- Montroll EW, Shlesinger MF. Nonequilibrium Phenomena II. From Stochastics to Hydrodynamics. edited by J.L. Lebowitz and E.W. Montroll, North– Holland, Amesterdam, 1984, pp1-121.
- Havlin S, Selinger RB, Schewartz M, Stanley HE, Bunde A. Random Multiplicative processes and transport in structures with correlated spatial disorder. Physical Review Letters, 1988, 61: 1438–1441.
- Bak P, Tang C, Wiesenfeld K. Self–organized criticality: An explanation of the 1/f noise. Physical Review Letters, 1987, 59(4): 381–384.
- Press WH. Flicker noises in astronomy and elsewhere. Comments Astrophys, 1978, 7:103–119.
- Peng C–K, Buldyrev S, Goldberger AL, Havlin S, Sciortino F, Simons M, Stanley HE. Long–range correlations in nucleotide sequences. Nature, 1992, 356:168–170.
- Buldyrev SV, Goldberger AL, Havlin S, Peng C–K, Stanley HE, Fractals in Science, edited by A. Bunde and S. Havlin, Springer– Verlag, Berlin, 1994, pp. 48–87.
- Lee J–M, Kim D–J, Kim I–Y, Park KS, Kim SI. Nonlinear–analysis of human sleep EEG using detrended fluctuation analysis, Medical Engineering & Physics, 2004, 26: 773–776.
- Leistedt S, Dumont M, Lanquart J–P, Jurysta F, Linkowski P. Characterization of the sleep EEG in acutely depressed men, using detrended fluctuation analysis. Clinical Neurophysiology, 2007, 118: 940–950.
- Dumont M, Juysta F, Lanquart J–P, Noseda A, van de Borne P, Linkowski P. Scale–free dynamics of the synchronization between sleep EEG power bands and the high frequency component of heart rate variability in normal men and patients with sleep apnea– hypopnea syndrome. Clinical Neurophysiology, 2007, 118: 2752–2764.
