Analysis of migration flows of the population of the Vologda oblast districts

Author: Panov Mikhail Mikhailovich
Journal: Economic and Social Changes: Facts, Trends, Forecast @volnc-esc-en
Section: Social development
Article in issue: 4 (40) т.8, 2015.
Free access
The article presents the research on the main directions and scale of migration in municipal districts of the Vologda Oblast and considers the main types of migration and the specifics of their statistical accounting. The data by Rosstat served as a basis upon which a general analysis of migration dynamics in the Vologda Oblast districts was carried out; and the article presents its periodization. Three main periods are defined: the “migration shock” of 1991-1999 after the collapse of the Soviet Union, the migration stability of 2000-2008 and the post-crisis rural out-migration that began in 2009 and is increasing year by year. At the same time, gross migration indicators have shown high sensitivity to significant socio-economic change, in particular, to the economic crises of 1999 and 2008. The article describes the main age and gender characteristics of migrants, it has been determined that the most active migrants are girls aged 15-29, who move from rural to urban settlements...
Unicipal districts, rural area, migration, growth points
Short address: https://sciup.org/147223740
IDR: 147223740 | UDC: 331.55(470.12) | DOI: 10.15838/esc/2015.4.40.8
Text of the scientific article Analysis of migration flows of the population of the Vologda oblast districts
Increase in the mobility of rural population essentially shows economic growth of a state and globalization and modernization of a society. This is reflected in occupational mobility (withdrawal from employment in agriculture) and in spatial mobility (migration of rural population to big cities) [20]. The fact that working population is gradually leaving agriculture with its low wages and lower dependence on the number of workers is a natural result of modernization processes, and in general it can have a positive impact on economic development. At that, rural residents themselves more and more often abandon farming due to the low profitability of the industry [17, p. 14]. At the same time, the economic effect of spatial mobility growth, which is manifested mainly in migration, is not so clear. On the one hand, migration plays an important role in the distribution of labor on the regional labor market. Territorial redistribution of specialists allows a greater number of enterprises to use the best practices of high-tech production. Migration inflow to cities with low natural increase supplies them with employees. Educational migration raises the general level of education and training of the population and of the region [10]. The relationship between spatial and professional mobility is also important, which is due to the reduction in the number of agricultural workers in favor of more economically attractive jobs, which are generally less in demand in rural areas. On the other hand, the outflow of people from underdeveloped areas and rural areas exacerbates the differences in economic development, leads to depopulation of villages and small towns, and creates obstacles to the smooth and sustainable development of regions [13, p. 47]. Thus, we consider it relevant to study internal migration in the region with a focus on municipal districts, the intensity of migration flows between which can significantly exceed foreign and interregional migration [9].
According to a modern definition, migration is the movement of population between different localities, placed either in one or in several areas [6, p. 179]. There are two main types of migration: return migration and migration without return. As the name implies, return (temporary) migration, regardless of the number of completed movements, presupposes a return to the starting point. Return migration is subdivided primarily on seasonal migration and commuting. Seasonal migration involves changing the place of stay for a limited period of time with a specific purpose (performance of seasonal work, training, vacation at a resort, etc.). Unlike seasonal migration, commuting is limited to a narrow time frame and is usually expressed as daily (or weekly) work or cultural and household trips (trip to work in the city, vacation out of town, etc.). Migration without return (of the resident population), by contrast, is associated with the “one way” movement, i.e. does not imply a return to the starting point. As a result, migration without return involves changing the place of residence, and return migration implies the change of the place of stay. In general, both types of migration have a similar reason, which lies in the contradiction between the needs of an individual and the possibilities of satisfying them in the place of permanent residence. As noted, individual choice between permanent and temporary migration are determined by territorial remoteness and availability of migration opportunities (migration policy, affordability of housing, availability of jobs, difference in wages and price level, etc.) [16, p. 15].
Educational migration can help demonstrate the similarities and, at the same time, the differences between these types of migration. For example, a resident of Sokol (Sokolsky District) studying at a Vologda university, usually has to travel from his/her place of residence to the place of training, thus taking part in commuting. However, if there is an additional place in the hostel, and the student takes it, the duration of stay in Vologda will increase to several weeks or months, indicating the seasonal character of migration. If a student gets a part-time job, which will allow him/her to have the money to pay for accommodation in the city, he/she will be able to change the place of residence permanently and thereby participate in (from the point of view of terminology) migration without return. As a result, approximately identical prerequisites, depending on the conditions, lead to different types of migration and, consequently, are registered differently.
It is important to take into consideration differences between types of migration and their triggers (the factors) when analyzing migration flows, since this is directly connected with specifics of their statistics accounting. According to the Rosstat methodology, migration data are obtained from official statements of local offices of the Directorate of the Federal Migration Service of Russia, i.e. they include only information about permanent residential registration (place of residence), temporary registration at the place of residence for a period of 9 months or more [5, p. 403]. At the same time, we know that, of all kinds of spatial movements, only a small proportion is accompanied by the change of permanent residence (or long-term registration): the volume of commuting over the weekend in large cities and metropolitan areas may exceed the volume of permanent migration over a year [11]. Of course, in most cases, this statement does not concern international migration, which involves strict registration and control. Since, in accordance with the legislation of the Russian Federation, citizens have a formal freedom of movement, migration exchange within the Russian Federation is controlled to a much lesser extent. In this case, the data of the national statistics service allow us to estimate only the scale of migration without return and also certain special cases of seasonal migration (for example, living in a dormitory, which requires temporary registration). There is no opportunity to assess the volume of commuting on the basis of official statements, which excludes from the analysis a significant part of migration movements, primarily within the range of short distances.
Another significant limitation of migration statistics is its formal connection to the administrative-territorial division.
According to migration law1, no citizen is obliged to undergo registration if the place of stay is in the same region as the place of residence. In other words, intraregional migration is registered only on a voluntary basis. Moreover, the movements within the same municipal district, even in case of registration, are not recorded in statistical accounting, despite the fact that the distance between two settlements in one district can be greater than when one moves from one district to another. As a result, statistics collections do not contain information about the volume of migration within a single municipal district, which makes the scope of the analysis even narrower.
Thus, unlike the statistics of international migration, impressive in its detailed description, intraregional accounting of migration exchange is inaccurate and fragmentary. In this regard, the analysis of migration between districts is inevitably accompanied by a number of assumptions. The first and basic assumption is equating the trends of registered migration without return to migration trends in general. The example above shows that temporary migration often leads to permanent migration. The author [11] points out that the presence of migration activity experience contributes to the formation of migration intentions in the future, i.e. a statistical indicator of permanent migration indirectly points to temporary migration. Another assumption would be the exception of intraregional migration from the analysis of overall migration flows. This may somewhat distort the findings on the highly populated municipal districts or districts with two or more relatively large (compared to villages) settlements, because migration activity within the district can play a significant role in them. However, with a reservation to the above mentioned limitations and assumptions, it is possible to carry out a general analysis of main migration flows in the Vologda Oblast.
The Vologda Oblast, which is the typical region of North-West Russia, is characterized by moderate migration outflow and natural decline, relatively high share of rural population (28.7% of the total population)2. The region is on the 3rd place in the Northwestern Federal District by the number of migrants and on the 2nd – by the intensity of intraregional migration [5]. It is worth noting that, compared with the indicators for earlier years (late 1990s – early 2000s), natural population growth has significantly improved, although it has not yet reached the level of the early 1990s (tab. 1) . However, a problem of migration outflow has become more acute, and, as in the case of a natural population decrease, the main losses occur in municipal districts. But since the main direction of migration is
Table 1. Indicators of natural and migration growth in the Vologda Oblast, people
|
Territory |
1991 |
1994 |
1999 |
2003 |
2007 |
2010 |
2011 |
2012 |
2013 |
|
Net migration rate |
|||||||||
|
Regional balance |
4657 |
7695 |
1574 |
339 |
441 |
-194 |
566 |
-1053 |
-1321 |
|
Municipal districts |
3052 |
1363 |
639 |
793 |
-865 |
-3762 |
-3538 |
-3671 |
-3269 |
|
Large cities |
1605 |
6332 |
935 |
-454 |
1306 |
3568 |
4104 |
2618 |
1948 |
|
Net rate of natural increase |
|||||||||
|
Regional balance |
-109 |
-9337 |
-10098 |
-11770 |
-5331 |
-5072 |
-3210 |
-1297 |
-1504 |
|
Municipal districts |
-991 |
-7492 |
-7006 |
-8354 |
-4115 |
-4180 |
-3235 |
-2291 |
-2251 |
|
Large cities |
882 |
-1845 |
-3091 |
-3416 |
-1216 |
-892 |
25 |
994 |
747 |
|
Note. Net rate of increase is calculated as the difference between the number of incomers and leavers during a specific period. Sources: compiled by the author; Demographic Yearbook of the Vologda Oblast for the years indicated; Munitsipal’nye obrazovaniya Vologodskoi oblasti, 1991–2000: stat. sbornik [Municipal Formations of the Vologda Oblast, 1991–2000: Statistics Collection]. Vologodskii oblkomstat [Regional Office of the Federal State Statistics Service of the Russian Federation in the Vologda Oblast]. Vologda, 2001. Pp. 129-148. |
|||||||||
from districts to major cities of the region3, the problem is practically not reflected in the statistics on the region as a whole.
Young people are traditionally considered to be the most active migrants [7]. This is also confirmed by the data on the Vologda Oblast: in 2013, the group aged 15–34 accounted for 52.2% of migrants. Out of them the urban population consists of 58.4% of incomers (11,187 people) and 53.9% of leavers (9,944 people), rural population consists of 39.9% of incomers and 59.9% of leavers. The most active migrants are girls aged 15–29; they are leaders in the number of outflows from rural areas (24.5% of the total number of leavers) and arrivals from the city (25.8% of the total number of newcomers). The destination of migration is another significant difference in migration of rural and urban population. Thus, the outflow of urban residents (primarily, residents of large cities) in other regions is almost as large as and the outflow in the communities of their own region (46.3 and 53.7% respectively), while the rural population moves primarily to the cities located within the Oblast (46.3% of the total migration outflow; tab. 2).
The annual account of migration allows us to analyze the dynamics of this process. Since the collapse of the Soviet Union we can highlight three periods of migration in the districts of the Vologda Oblast; they are inextricably linked to socio-economic processes in the country as a whole. In the early and mid 1990s, as in most regions of the country, in the Vologda Oblast there was a significant in-migration of residents from the former Soviet states. This is the so-called “stress migration”, when people who had been separated by new borders as a result of radical geopolitical transformations, tried to return home or to move to a country with
Table 2. Migration in urban and rural areas of the Vologda Oblast in 2013
|
Type of migration |
Number of incomers |
Number of leavers |
Migration increase (decline) |
||||||
|
Total |
From urban areas |
From rural areas |
Total |
To urban areas |
To rural areas |
Total |
At the expense of urban areas |
At the expense of rural areas |
|
|
Interregional urban |
6599 |
4953 |
1646 |
8110 |
6786 |
1324 |
-1511 |
-1833 |
322 |
|
Intra-oblast urban |
11111 |
3526 |
7585 |
9389 |
3519 |
5870 |
1722 |
7 |
1715 |
|
Interregional rural |
3380 |
2561 |
819 |
3872 |
3002 |
870 |
-492 |
-441 |
-51 |
|
Intra-oblast rural |
10824 |
5877 |
4947 |
12546 |
7602 |
4944 |
-1722 |
-1725 |
3 |
Note. Total migration balance in the Vologda Oblast in 2013 was 1,321 people.
Source: Demographic Yearbook of the Vologda Oblast, 2014.
supposedly better prospects [8]. The highest value of the indicator is marked in 1995, in which the region’s population increased by 6,145 former foreigners (16.7% of the total inflow of the population). Since the late 1990s and up to the late 2000s, during a period of economic growth, most regions of the Center and North-West of the country were characterized by a decrease in the intensity of migration exchange. For instance, in the Vologda Oblast in 2009 the total number of migrants was only 11,359 incomers and 11,296 leavers, which is three times less than in 1995. Intraregional and interregional migration were approximately equal and together they accounted for more than 95% of the total migration flows in the region; consequently, the influx from abroad decreased significantly. In the post-crisis years (beginning in 2010) and at present there is a significant increase in the intensity of migration flows. During this period, intraregional migration accounted for approximately two-thirds (65.2%) of registered migration activity in the region: 21,935 out of 33,622 people in 2013. Another third (34.3%) of migrants leave the Vologda Oblast for other subjects of the Russian Federation, and the share of incomers is somewhat smaller (29.7%).
The Vologda Oblast can hardly be called an object of migration attractiveness for residents of other countries (northern climate, low wages and high prices, etc.); the intensity of international migration in the region is low: as of 2013, there are 1,708 incomers and 1,026 leavers; in both cases the share of arrivals from the CIS countries is over 90%. In general, the change in the intensity of migration flows can be examined by using the indicator of gross migration. Gross migration is calculated as the sum of the number of incomers and the number of leavers. This indicator indirectly indicates the spatial mobility of the population and helps to identify migration triggers. Figure 1 presents trends in the intensity of migration in the municipal districts and major cities of the Oblast (Vologda and Cherepovets) in 1995–2012 (data for earlier years is limited or absent). The leap of migration, which was caused by the collapse of the USSR, and the peak of which was in the first half of the 1990s, changed to a relative decline in the period of economic growth in the 2000s; however, after the crisis of 2008–
Figure 1. Intensity of migration in large cities and municipal districts of the Vologda Oblast in 1995–2012
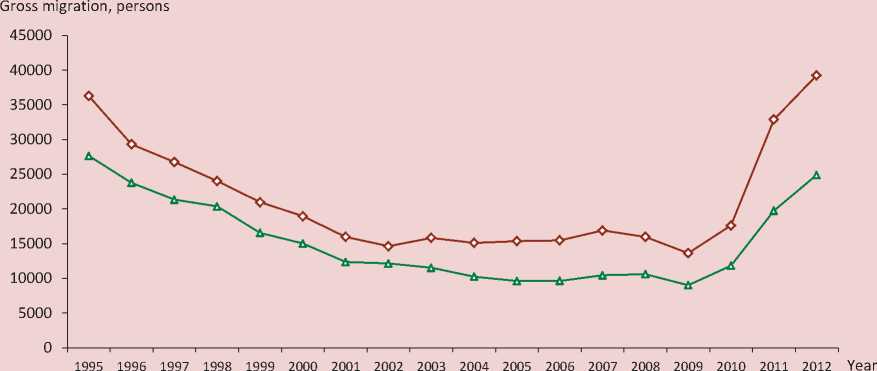
—»— Large cities —0— Municipal districts
Note. Gross migration is calculated as the sum of migrants, who arrived and left in the specific period. Sources: compiled by the author; Demographic Yearbook of the Vologda Oblast for the years indicated.
2009, migration increased sharply again. Moreover, the major part of migration was observed in municipal districts each year, despite their smaller total population compared to major cities (in 2012 – 565, 519 and 630,677 people, respectively).
It should be noted that given the greater intensity of migration exchange in municipal districts, there is a predominance of outflow over inflow. Unfortunately, on the basis of official statements it is impossible to find out clearly the direction of migration. However, one can reveal general patterns even with the data available, by comparing their graphical representations. For instance, by analyzing the lines of migration trends, one can observe an inverse relationship between the changes in the rate of net migration in the districts and major cities of the Oblast. If in 1993–1995 the inflow in major cities increased, then in municipal districts in the same period the index value decreased (fig. 2). Towards the end of the 1990s, when international migration could not compensate for the outflow of the population in major cities, the district average migration inflow dropped below the zero mark. The figure shows how migration growth in major cities is accompanied by a migration decrease in municipal districts.
Although migration trends in major cities and in municipal districts are similar in their dynamics, there are considerable differences in migratory activity and the rate of migration gain between them. This may be due to different prerequisites for migration (territorial remoteness, conditions of work and
Figure 2. Average migration rate in the districts of the Vologda Oblast in 1991–2012
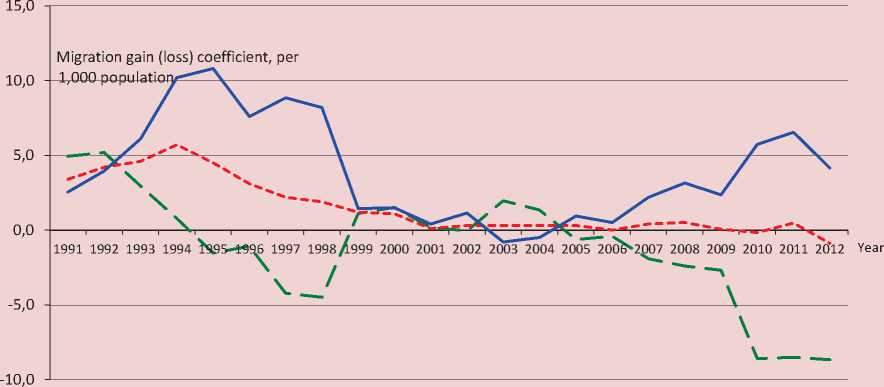
--Municipal areas -----In the Oblast on the whole-----Large cities
Note. The rate of migration gain (loss) is calculated as the difference between the number of arrivals and departures of migrants relative to the number of population.
Sources: compiled by the author; Demographic Yearbook of the Vologda Oblast for the years indicated; Munitsipal’nye obrazovaniya Vologodskoi oblasti, 1991–2000: stat. sbornik [Municipal Formations of the Vologda Oblast, 1991–2000: Statistics Collection]. Vologodskii oblkomstat [Regional Office of the Federal State Statistics Service of the Russian Federation in the Vologda Oblast]. Vologda, 2001. Pp. 129-148.
life, etc.) and different perception of changes in various factors of migration due to specifics of district economy and its organization [18]. In addition, within the Oblast there is migration not only from municipal districts to major cities, but also between municipal districts, because they are not equal in terms of economic development (income, labor productivity, living conditions, etc.) [2]. There can be several reasons for this. On the one hand, the inability or unwillingness to move to a major city given the inability or unwillingness to continue living at the place of residence registration. On the other hand, a potential migrant, on the contrary, can get an opportunity to settle in another, more attractive, municipal district (where he/she can get a job, and where the price of housing is lower, etc.). We add that the total costs when moving to another municipal district can be lower than when moving to a large city. As a result, if there is a significant difference (enough to completely cover the named costs in the medium term) between the actual and potential (in the case of moving) income, more cost effective to move to another municipal area than in a large city [19]. Such neoclassical interpretation is relevant to the previously mentioned cases of transition from commuting to permanent migraiton, since the difference in income will be supplemented by savings on transport costs, which will increase the economic attractiveness of changing the place of residence. Anyway, in all three cases, the differences between districts in migration gain are determined by the differences in their socio-economic development.
Taking into consideration these findings, let us take the period of 2009–2012, which is characterized by an increase in the intensity of migration exchange (see fig. 1) and at the same time covers the period of significant changes in intraregional migration exchange (tab. 3).
As can be seen from the data in 2009– 2012 only four districts in the Vologda Oblast had the positive balance of migration gain: Vologodsky (5.1 per 1,000 population),
Table 3. Main indicators of migration in of the Vologda Oblast municipal districts in 2009–2012
|
Municipal district |
Arrived, per 1,000 population |
Left, per 1,000 population |
Net rate of migration increase, per 1,000 population |
Gross rate of migration increase, per 1,000 population |
|
Vologodsky |
28.2 |
23.2 |
5.1 |
51.4 |
|
Kaduisky |
31.1 |
26.9 |
4.2 |
58.0 |
|
Ust-Kubinsky |
26.4 |
26.1 |
0.2 |
52.5 |
|
Sheksninsky |
26.0 |
25.9 |
0.1 |
51.9 |
|
Velikoustyugsky |
20.4 |
21.8 |
-1.5 |
42.2 |
|
Kirillovsky |
27.9 |
29.8 |
-1.9 |
57.7 |
|
Sokolsky |
11.9 |
14.7 |
-2.8 |
26.6 |
|
Chagodoshchensky |
19.5 |
22.6 |
-3.1 |
42.1 |
|
Totemsky |
26.6 |
30.4 |
-3.9 |
57.0 |
|
Cherepovetsky |
22.5 |
26.4 |
-4.0 |
48.9 |
|
Mezhdurechensky |
26.2 |
31.3 |
-5.0 |
57.5 |
|
Ustyuzhensky |
19.0 |
25.3 |
-6.3 |
44.3 |
|
Vytegorsky |
14.4 |
22.1 |
-7.7 |
36.5 |
|
Syamzhensky |
19.2 |
27.3 |
-8.2 |
46.5 |
|
Gryazovetsky |
14.9 |
23.2 |
-8.3 |
38.1 |
|
Verkhovazhsky |
16.3 |
26.4 |
-10.1 |
42.7 |
|
Vozhegodsky |
19.3 |
30.0 |
-10.7 |
49.3 |
|
Tarnogsky |
15.0 |
26.0 |
-11.0 |
41.0 |
|
Belozersky |
20.4 |
31.7 |
-11.2 |
52.1 |
|
Babaevsky |
13.2 |
25.1 |
-11.9 |
38.3 |
|
Nikolsky |
21.8 |
33.8 |
-12.0 |
55.7 |
|
Kharovsky |
12.5 |
25.6 |
-13.1 |
38.1 |
|
Nyuksensky |
16.0 |
29.4 |
-13.4 |
45.4 |
|
Babushkinsky |
10.0 |
23.9 |
-14.0 |
33.9 |
|
Vashskinsky |
13.6 |
27.7 |
-14.1 |
41.3 |
|
Kichmengsko-Gorodetsky |
9.2 |
26.2 |
-17.0 |
35.4 |
|
Sources: compiled by the author; Demographic Yearbook of the Vologda Oblast for the years indicated. |
||||
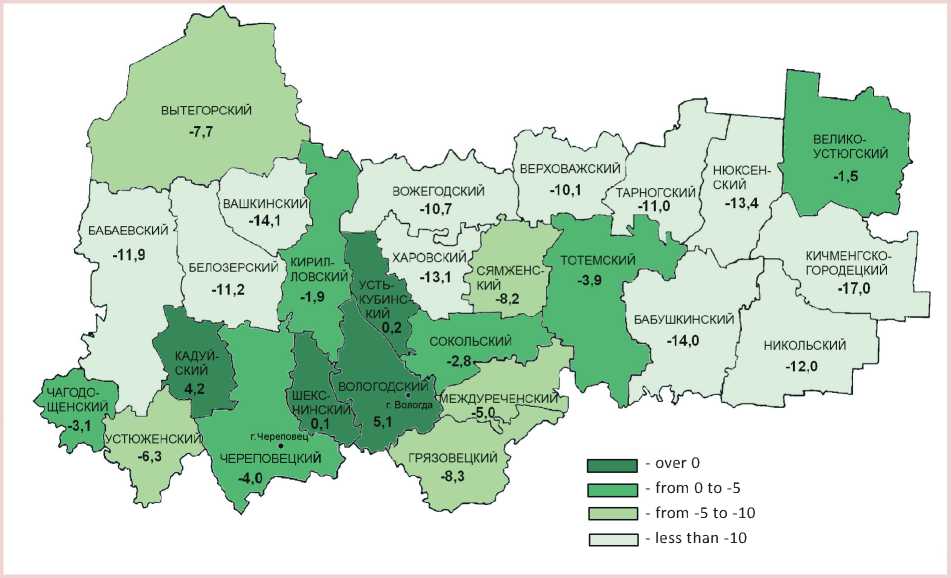
Figure 3. Value of the coefficient of migration gain (loss) in the Vologda Oblast districts in 2009–2012, persons per 1,000 population
Sources: compiled by the author; Demographic Yearbook of the Vologda Oblast for the years indicated.
Kaduysky (4.2), Ust-Kubinsky (0.2), Sheksninsky (0.1; fig. 3). However, differences in the rate of migration gain (loss) are quite substantial even between the districts with the negative balance of migration, especially central and peripheral districts. For instance, municipal districts with moderate migration outflow (Velikoustyugsky, Kirillovsky, Sokolsky, etc.) according to the relative rate of migration are closer to Vologodsky and Kaduysky districts than to the districts that lag behind by this indicator: Babushkinsky, Vashkinsky, Kichmengsko-Gorodetsky districts. During the period under consideration, 11 out of 26 districts annually lost an average of more than 1% of the population, which in the future can have a negative impact on the demographic situation, and also lead to degradation of the labor market due to lack of human resources.
It is important to note that in the case of the Vologda Oblast districts the role of inflow and outflow of the population in determining the value of migration gain is uneven. If we look at the statistics for the recent years (see tab. 3), we observe only a slight differentiation of the municipal districts by population decline. This means that the actual migration outflow in them is about the same – the difference in the value of the index does not exceed 10 persons per 1,000 population. The exception is Sokolsky District, in which the population outflow is much lower than in other districts due to a low intensity of migration. At the same time, districts vary widely by migration inflow: the variation of the index is threefold (from 9.2 people per 1,000 population in Kichmengsko-Gorodetsky District to 31.1 in Kaduysky District). We can also note the relatively high value of migration gain coefficient in the districts with a relatively high inflow of population. At the same time, the districts less attractive for migrants, for the most part are the lowest in the region the values of the coefficient of net migration.
A similar trend in relation to the intensity of migration flows is observed in the districts. The districts with positive values of migration gain are characterized by the high migration intensity, while in the districts with significant migration decrease the intensity is low in most cases. For a better explanation, we can take the top group of 5 districts by value of migration gain coefficient (Vologodsky, Kaduysky, Ust-Kubinsky, Sheksninsky, Velikoustyugsky; see tab. 3) and compare it with the corresponding lower group (Kharovsky, Nyuksensky, Babushkinsky, Vashkinsky, Kichmengsko-Gorodetsky). In the first group the average value of gross migration for the analyzed period is 49.1 per 1,000 population; the value is higher than 50 in four out of five districts. In the second group gross migration per 1,000 population is 38.0 on average. The low intensity of migration is also observed in Sokolsky District (26.0 per 1,000 population), which is geographically close to Vologda, which makes it possible to do more profitable work without changing the place of residence. In addition, many people in Sokolsky District are employed in the processing industry – 32% of workers, which is significantly greater than in other districts of the Oblast [15]. The developed industry retains residents due to the fact that it provides them with stable jobs that have existed for many decades, including the jobs that support the industry. At the same time, due to industry-relates specifics, wages in the district are low: 16,338 rubles in 2012, which is by 29% below the district average for the same year. As a result, the low potential income reduces migration attractiveness of the district.
Based on the above, we can draw a number of conclusions and assumptions. First, the statistical indicator of migration gain (loss) in the Vologda Oblast districts depends primarily on their migration attractiveness. It is determined by a number of diverse economic, geographic and socio-economic factors, which include territorial accessibility (remoteness), the difference in the level of income, living conditions, development of services sphere, etc. Second, municipal districts of the Vologda Oblast are characterized by a compensating role of migration inflow relative to outflow, the differentiation of which is insignificant. Only four districts of the Oblast (Vologodsky, Kaduysky, Ust-Kubinsky, Sheksninsky) are quite attractive for migrants; they help maintain a positive migration balance, despite the annual outflow of 2–3% of the population. This is followed by another pattern, which consists in the direct correlation between migration inflow and intensity of migration exchange in the districts: the higher migration activity in the district, the higher the value of migration gain coefficient. Thirdly, the main directions of migration flows in the region are nonlinear. The significant part of the rural population (especially girls aged 15–29) move either to rural areas of other districts or to nearby urban settlements. These migrants, in a sense, replace the residents of small towns, which, in turn, choose other cities (especially big cities) within and outside the Oblast as their final destination of migration. The central part of the region, which is most densely populated (see fig. 3), has the greatest migration attraction; while peripheral districts, especially with a predominant share of rural population, experience the significant outflow of population. Migration outflow in Velikoustyugsky and Chagodoshchensky districts, where the proportion of urban population amounts to 69.9 and 77.3%, respectively, is moderate, despite their location at the periphery. Such districts serve as “gravitational centers” of migration, i.e., they are more attractive for migrants from neighboring districts because of their remoteness from large cities [1]. Kaduysky and Ust-Kubinsky districts play the similar role; among other things, their location is favorable: on the one hand, they are located relatively close to major cities; on the other hand, they are located near districts with high migration outflow.
Accounting of migration flows can improve the effectiveness of regional policy. Currently, the focus on regional administration involves a desire to achieve even development in the Oblast districts. The results of the analysis of interdistrict migration will help identify the most problematic districts, which need state support, and will indicate errors in administrative decisions that lead to a sudden increase in the population outflow. In addition, the relatively high migration attractiveness helps reveal potential “growth points”, i.e. areas with more favorable conditions for public investment, the fact, which is in no small measure connected with the inflow of human resources. The development of social and engineering infrastructure, promotion of housing construction and creation of jobs in these areas will help create a basis for economic growth in the region. First of all, it will help slow down population outflow in those districts that suit their requirements and expectations of migrants when they change their place of residence. The fact that people prefer to move to these districts indicates that the districts have necessary conditions for individual selfrealization, and prospects for their public support. Promotion of development of districts such as Velikoustyugsky, Kaduysky, Chagodoshchensky and Ust-Kubinsky will make it possible to form a polycentric model of the region, it is an important element of the spatial organization of the population in the conditions of transition to innovation economy. Thus, the Transport Strategy of Russia for the period up to 2030 points out that the innovative scenario involving a polycentric model of development of countries and regions, will provide an opportunity to raise the quality of life, to improve the transport network, to increase spatial mobility of people, to create conditions for the development of high-tech production [14, p. 17]. The creation of these “economic pillars” contributes to the growth of regional economy through the compliance with the principle of maximizing economic efficiency, which in the future will have a positive impact on the development of the most important districts and also those that are currently in comparative decline. It is connected with the development of transport and engineering infrastructure, and with the expansion of opportunities for migratory exchange between rural settlements and small towns in the framework of commuting and seasonal employment, which is important, in particular, for the region’s peripheral districts.
Thus, the analysis of state statistics on inter-district migration helps identify its main directions, identify territories of risk and centers of migration attraction. Despite the significant limitations of official statistical reporting, it is possible to conclude that the Vologda Oblast has very intensive intraregional migration, predominantly, from rural areas to small towns and then – to cities. The study of factors that determine migration flows in the Oblast, and the timely adoption of appropriate management decisions will contribute to the development of economic growth points in the region. In addition, identifying and addressing the causes of migration will help curb depopulation of villages and, in the long term, to stabilize the demographic situation in rural areas.
References Analysis of migration flows of the population of the Vologda oblast districts
- Vasilenko P.V. Gravitatsionnye sily i migratsionnaya podvizhnost’ naseleniya regiona . Vestnik Baltiiskogo federal’nogo universiteta im. I. Kanta , 2013, no. 7, pp. 155-159.
- Voroshilov N.V. Differentsiatsiya sotsial’no-ekonomicheskogo razvitiya munitsipal’nykh obrazovanii Vologodskoi oblasti za 1991-2011 gg. . Problemy razvitiya territorii , 2013, no. 3 (65), pp. 31-41.
- Demograficheskii ezhegodnik Vologodskoi oblasti, 1996: stat. sbornik . Vologodskii oblkomstat .Vologda, 1997. 57 p.
- Demograficheskii ezhegodnik Vologodskoi oblasti, 2012: stat. sbornik . Vologdastat . Vologda, 2013. 80 p.
- Demograficheskii ezhegodnik Rossii, 2013: stat. sb. . Rosstat . Moscow: Rosstat, 2013. 543 p.
- Demograficheskii ponyatiinyi slovar’ . Ed. by L.L. Rybakovskii. Moscow: Tsentr sotsial’nogo prognozirovaniya, 2003. 352 p.
- Karachurina L., Mkrtchyan N.M. Migratsionnaya podvizhnost’ molodezhi i sdvigi v vozrastnoi strukture naseleniya gorodov i raionov Rossii (1989-2002) . Geograficheskoe polozhenie i territorial’nye struktury: pamyati I.M. Maergoiza . Moscow: Novyi Khronograf, 2012. Pp. 688-707.
- Kresova N.S. Osnovnye kharakteristiki migratsii sovremennoi Rossii . Teoriya i praktika obshchestvennogo razvitiya , 2007, no. 1, pp. 22-30.
- Mkrtchyan N.V., Karachurina L.B. Migratsiya v Permskom krae: opyt analiza na regional’nom i munitsipal’nom urovnyakh . Nauchnye trudy IPN RAN . Ed. by A.G. Korovkin. Moscow: MAKS press, 2009. Pp. 688-712.
- Mkrtchyan N.V. Migratsiya molodezhi v regional’nye tsentry Rossii v kontse XX -nachale XXI veka . Izvestiya RAN. Seriya geograficheskaya , 2013, no. 6, pp. 19-32.
- Mkrtchyan N.V. Migratsionnaya mobil’nost’ v Rossii: otsenki i problemy analiza . SPERO, 2009, no. 11, pp. 149-164.
- Munitsipal’nye obrazovaniya Vologodskoi oblasti, 1991-2000: stat. sbornik . Vologodskii oblkomstat . Vologda, 2001. 410 p.
- Patsiorkovskii V.V. Sel’sko-gorodskaya Rossiya . Moscow: ISEPN RAN, 2010. 390 p.
- Transportnaya strategiya Rossii na period do 2030 . Ministerstvo transporta Rossiiskoi Federatsii . 2008. Available at: http://www.mintrans.ru/upload/iblock/3cc/ts_proekt_16102008.pdf.
- Trud i zanyatost’ v razreze raionov Vologodskoi oblasti, 2012: stat. byull. . Vologdastat . Vologda, 2013. 90 p.
- Shabanova M.A. Sezonnaya i postoyannaya migratsiya v sel’skom raione . Novosibirsk: Nauka, 1991. 232 p.
- Shik O., Tikhonova T. Al’ternativnaya nesel’skokhozyaistvennaya zanyatost’ v sel’skoi mestnosti Rossii: nauchnyi otchet . Moscow: Institut ekonomiki perekhodnogo perioda, 2007. P. 206.
- Crow H. Factors Influencing Rural Migration Decisions in Scotland: an Analysis of the Evidence. 2010. Available at: www.scotland.gov.uk/socialresearch.
- Stark O., Yitzhaki S. Labor Migration as a Response to Relative Deprivation. Journal of Population Economics, 1988, no. 1, pp. 57-70.
- Taylor J.E., Martin P.L. Human Capital: Migration and Rural Population Change. Handbook of Agricultural Economics. Ed. by B.L. Gardner, G.C. Rausser. Vol. 1. Pp. 457-511. Available at: http://econpapers.repec.org/bookchap/eeehageco/1.html.
