Analysis of P-QRS-T Components Modified by Blind Watermarking Technique Within the Electrocardiogram Signal for Authentication in Wireless Telecardiology Using DWT

Author: Nilanjan Dey, Sayantan Mukhopadhyay, Achintya Das, Sheli Sinha Chaudhuri
Journal: International Journal of Image, Graphics and Signal Processing(IJIGSP) @ijigsp
Article in issue: 7 vol.4, 2012.
Free access
Presently considerable amount of work has been done in tele-monitoring which involves the transmission of bio-signals and medical images in the wireless media. Intelligent exchange of bio-signals amongst hospitals needs efficient and reliable transmission. Watermarking adds “ownership” information in multimedia contents to prove the authenticity, to verify signal integrity, or to achieve control over the copy process. This paper proposes a novel session based blind watermarking method with secret key by embedding binary watermark image into (Electrocardiogram) ECG signal. The ECG signal is a sensitive diagnostic tool that is used to detect various cardio-vascular diseases by measuring and recording the electrical activity of the heart in exquisite detail. The first part of this paper proposes a multi-resolution wavelet transform based system for detection ‘P’,‘Q’,‘R’,‘S’,‘T’ peaks complex from original ECG signal of human being. ‘R-R’ time lapse is an important component of the ECG signal that corresponds to the heartbeat of the concerned person. Abrupt increase in height of the ‘R’ wave or changes in the measurement of the ‘R-R’ interval denote various disorders of human heart. Similarly ‘P-P’, ‘Q-Q’, ‘S-S’, ‘T-T’ intervals also correspond to different disorders of heart and their peak amplitude envisages other cardiac diseases. In this proposed method the ‘P Q R S T’-peaks are marked and stored over the entire signal and the time interval between two consecutive ‘R’-peaks and other peaks interval are measured to detect anomalies in behavior of heart, if any. The peaks are achieved by the composition of Daubechies sub-bands wavelet of original ECG signal. The accuracy of the P, QRS and T components detection and interval measurement is achieved with high accuracy by processing and thresholding the original ECG signal. The second part of the paper proposes a Discrete Wavelet Transformation (DWT) and Spread Spectrum based watermarking technique. In this approach, the generated watermarked signal having an acceptable level of imperceptibility and distortion is compared to the Original ECG signal. Finally, a comparative study is done for the intervals of two consecutive ‘R-R’ peaks, ‘P-R’, ‘Q-T’, ‘QTc’, QRS duration, cardiac output between original P, QRS and T components detected ECG signal and the watermarked P,QRS and T components detected ECG signal.
ECG, P-QRS-T Components, R-R Interval, Spread- Spectrum, Cardiac Output
Short address: https://sciup.org/15012339
IDR: 15012339
Text of the scientific article Analysis of P-QRS-T Components Modified by Blind Watermarking Technique Within the Electrocardiogram Signal for Authentication in Wireless Telecardiology Using DWT
Published Online July 2012 in MECS DOI: 10.5815/ijigsp.2012.07.04
Doctors and Medical practitioners often exchange medical signals in various diagnostic centers for mutual availability of diagnostic and therapeutic case studies. The communication of medical data through signals requires authentication and security. Embedding of watermarks in signals can cause distortion in the signals. As the signals convey information required for detection of diseases, hence any kind of distortion can result in erroneous diagnosis.
Embedding of watermark [1, 2, 3]. in ECG signal causes compromise with the diagnostic value of medical signals. To achieve medical watermarking technique, is a challenging task.
Myocardial infarction (MI) or acute myocardial infarction (AMI) [4], commonly known as a heart attack is the most frequently occurring disease worldwide. This is also the major cause of the large number of premature deaths globally. This happens generally due to the occlusion of the coronary artery or pulmonary veins, triggered by natural, social, genetic or human behavior. If left untreated for an ample period, it can cause infarction of myocardium (heart muscle tissue) and can lead to fatal consequences. Electrocardiogram is a classical diagnosis to detect heart malfunctioning and heart muscle damage. This can even prognosticate heart attack in severe cases and is a unique tool for diagnosing several cardiac diseases like bradycardia, tachycardia, cardiac arrhythmias, conduction abnormalities, ventricular hypertrophy, myocardial infection and other disease states [5].
An ECG signal is composed of successive repetition of ‘PQRST’ in monotony. In the beginning, a crust is generated from the linear signal to form the ‘P’ wave. The declining linear wave soon gets a downward deflection labeled as ‘Q’ wave. A sudden upright deflection can be observed just beyond the Q wave to form a high cone that is, the ‘R’ wave. On its decline a slight downward defection is the ‘S’ wave. A noticeable hinge after the ‘S’ wave is known as ‘T’ wave that marks the end of a segment of the ECG signal [6] normally.
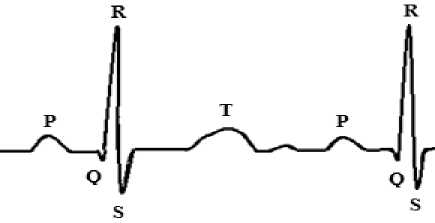
Figure 1 P, QRS, T Components
In this paper ‘R-R’ interval is emphasized for analyzing the heart condition of the concerned person based on the study of the ECG signal. For this, the ‘QRS’ wave is located in the ECG signal from which the ‘R’ wave is manifested. Considering the time axis along the ECG signal the time lapse between two consecutive R waves is measured [7]. The first algorithm detects the RR interval automatically by decomposing Daubechies Wavelet (db6) as mother wavelet generated from the ECG signal.
Watermarking (Chiou, 1999; Cox, 2002; Cox, 2001; Nikolaidis, 1996; Wolfgang, 1996; Wolfgang, 1999) is the process of embedding data into a 1-D or 2-D signal for security purposes.
Blind watermarking scheme does not require the original signal or any other data. Watermark insertion is done by using an embedding algorithm and a secret key.
In 2-D signal, processing, watermarking schemes can be classified either as Spatial Domain or as Transformed Domain. Least Significant bit (LSB) [8] insertion is a very simple and common approach to embedding information in an image in special domain. The limitation of this approach is vulnerable to every slight image manipulation. Converting image from one format to another format and back could destroy information hidden in LSBs. Watermarked image can be easily detected by statistical analysis like histogram analysis. This technique involves replacing N number of least significant bit of each pixel of a container image with the data of a watermark. Watermark is destroyed as the value of N increases. In frequency, domain analysis data can be kept secret by using Discrete Cosine Transformation (DCT) [9, 10]. Main limitation of this approach is blocking artifact. DCT pixels are grouped into 8x8 blocks, and transforming the pixel blocks are transformed into 64 DCT coefficients for each block. A modification of a single DCT co-efficient will affect all 64-image pixels in that block. One of the modern techniques of watermarking is Discrete Wavelet Transformation (DWT) approach [11, 12]. In this approach the imperceptibility and distortion of the watermarked 2-D signal is acceptable. Proposed watermarking method deals with a wavelet and spread spectrum based binary image watermarking in the P, QRS and T components detected ECG signal.
-
II. METHODOLOGY
-
A. Discrete Wavelet Transformation
The wavelet transform describes a multi-resolution decomposition process in terms of expansion of a signal onto a set of wavelet basis functions. Discrete Wavelet Transformation has its own excellent space frequency localization property. Application of DWT in 1D signal corresponds to 1D filter in each dimension. The input Daubechies Wavelet as mother wavelet is divided into 8 non-overlapping multi-resolution sub-bands by the filters, namely db1, db2, db3up to db8, where db is acronym for Daubechies. The sub-band is processed further to obtain the next coarser scale of wavelet coefficients, until some final scale “N” is reached. When a signal is decomposed into 8 levels, the db6 sub-band signal best reflects the original signal, since according to the wavelet theory, the approximation signal at level n is the aggregation of the approximation at level n-1 plus the detail at level n-1[13].
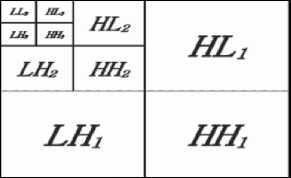
In cases of 2D signal, the wavelet transform describes a multi-resolution decomposition process in terms of expansion of an image onto a set of wavelet basis functions. Discrete Wavelet Transformation has its own excellent space frequency localization property. Application of DWT in 2D images corresponds to 2D filter image processing in each dimension. The input image is divided into 4 non-overlapping multi-resolution sub-bands by the filters, namely LL 1 (Approximation coefficients), LH 1 (vertical details), HL 1 (horizontal details) and HH 1 (diagonal details). The sub-band (LL 1 )
is processed further to obtain the next coarser scale of wavelet coefficients, until some final scale “N” is reached. When “N” is reached, 3N+1 sub-bands are obtained consisting of the multi-resolution sub-bands. Which are LL X and LH X , HL X and HH X where “X” ranges from 1 until “N.” Generally, most of the Image energy is stored in the LL X sub-bands.
The Haar wavelet is the simplest possible wavelet. Haar wavelet is not continuous, and therefore not differentiable. This property can be an advantage for the analysis of signals with sudden transitions. The Haar transform is the simplest orthogonal wavelet transform. The Haar basis is described as:
Г 1
У Haar ( t И- 1
for 0 < t < 0.5 for 0.5 < t < -1 otherwise
Its scaling function

can be described as
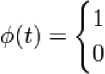
0 < t < 1, otherwise.
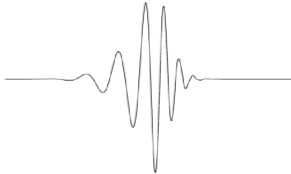
(a)
(b)
(c)
Figure 2 (a) Daubehies Wavelet, (b) Three-phase decomposition using DWT, (c) Haar Wavelet
-
B. Signal Denoising
To remove the artificially[14] added random noise in the signal is carried out by thresholding of the DWT coefficients up to level 2 using sym 4 wavelet function. As a thresholding method, a soft global threshold δ of an estimated value given by the following Eq. is used.
-
5 = a xj6! logL
Where the noise is Gaussian with standard deviation σ of the DWT coefficients and L is the number of samples of the processed signal.
Thresholding can be either soft or hard. In the cases of hard thresholding zeroes out all the signal parametric values smaller than δ, whereas, in the cases of soft thresholding all are same thing followed by the subtraction of δ from the values larger than δ.
III. proposed method
-
A. P, QRS and T Components Detection From ECG Signal
Step 1 ECG signal is read and the length is calculated.
Step 2 The signal is decomposed using db6 wavelet.
Step 3 3rd, 4th and 5th detail coefficients are selected, as most energy of the QRS complex is concentrated in these coefficients.
Step 4 The wave is reconstructed using detail coefficient 3, 4, 5. (D1=d3+d4+d5)
Step 5 A function d4*(d3+d5) /2 n is defined to reduce the oscillatory nature of the signal where d4, d3, d5 are the 4th, 3th, 5th detail coefficients and n is the level of decomposition.
Step 6 Derivate up to level 5 is made using the transfer function
W (z) = ) (—z-2 —2z-1—2z1 — ”2)
\8T /
Step 7 The differential equation:
y(nT)=(1/8T)(-x(nT-2T)-2x(nT-T) +2x(nT+T)+x(nT+2t)
is applied to the signal, by using the transfer function and taking the amplitude response as
\H(wT)\ = I [szn(2yr) + 2яп(соГ)]
Step 8 The signal is squared point-by-point using the equation
y(nT)=(1/8T)(-x(nT-2T)-2x(nT-T)+2x(nT+T)+ x(nT+2t))
to emphasize R wave from the ECG signal.
Step 9 A moving window is integrated using the equation Y=(1/N)*[x(nT-(N-1)T)+x(nT-(N-2)T)+…+x(nT)] to obtain the waveform feature information.
Step 10 The threshold value is calculated corresponding to the product of max and mean of the signal to locate the ends of the moving window.
Step 11 The P, QRS and T components peaks are located based on the amplitude of the signal within each moving window.
Step 12 The time intervals are calculated considering the positions of two consecutive same-labeled peaks and stored which is useful for the diagnosis of various cardiac diseases.
-
B. Watermark Embedding
Watermark embedding process is explained in Figure 3.
Step 1 ECG signal is converted into a largest possible square 2-D signal followed by decomposition into four sub bands (LL 1 , LH 1 , HL 1 and HH 1 ) using DWT.
Step 2 HH 1 is further decomposition into four sub bands (LL 2 , LH 2 , HL 2 and HH 2 ) using DWT.
Step 3 A binary image is taken and converted into
1D Vector.
Step 4 Pseudo random 2D sequence is generated by the session based key.
Step 5 HH 2 sub band of the base image is modified by using PN sequence depending upon the content of the secret 1D image vector to be embedded.
Step 6 Four sub bands of the 2nd level DWT decomposed 2D signal including modified sub band are combined using IDWT.
Step 7 Four sub bands of the 1st level DWT decomposed 2D signal including generated resultant 2D signal are combined to generate the Watermarked 2D signal using IDWT.
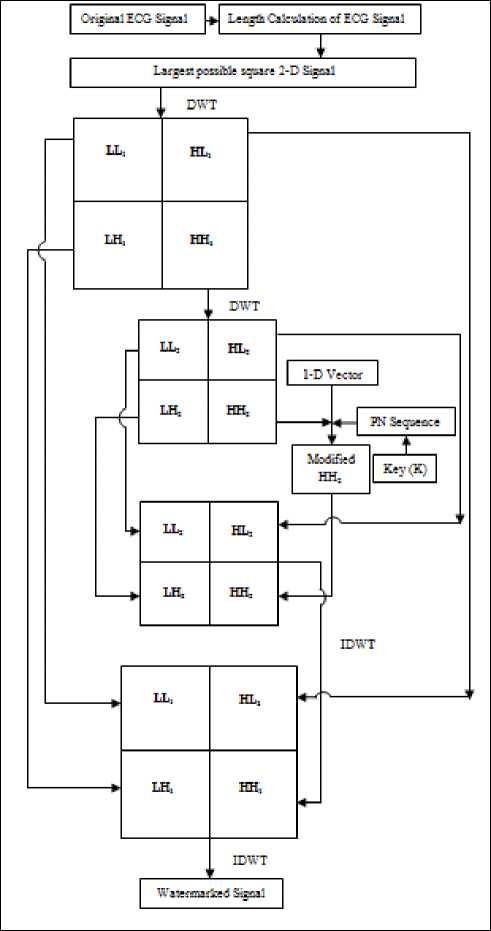
Figure 3 Watermark Embedding Process
-
C. Watermark Extraction
Watermark extraction process is explained in Figure 4.
Step 1 Session key and Sizes of the watermark image is sent to the intended receiver via a secret communication channel.
Step 2 Watermark image can be recovered from the watermarked 2D signal after 2nd level DWT decomposition using correlation function and knowing the size of the modified ECG signal.
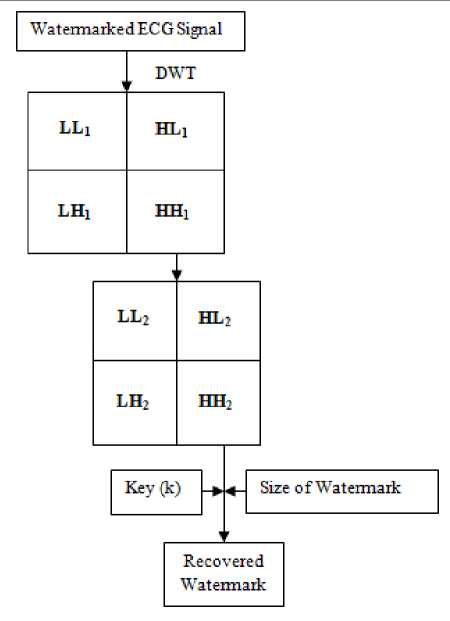
Figure 4. Watermark Extraction Process
-
D. P, QRS and T Components Detection from Modified ECG Signal
P, QRS and T components Detection from Modified ECG Signal is explained in Fig 4.
Step 1 2-D modified ECG Signal is reshaped into 1-D signal.
Step 2 Signal denoising using soft thresholding method.
Step 3 P, QRS and T components peaks are detected from the denoised ECG signal based on our proposed P, QRS and T components detection method.
Step 4 The time intervals are again calculated considering the positions of two consecutive same-labeled peaks.
Step 5 A comparative study is done for the two consecutive ‘R’-peaks and other peaks intervals between original and modified ECG signal.
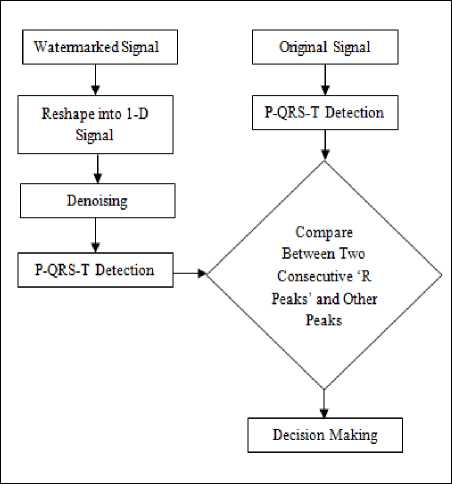
Figure 5 Comparison between P, QRS and T components Detection from Original ECG Signal and Modified signal.
IV. Explanation Of The Proposed Method
-
A. P, QRS and T Components Detection from the Original ECG signal
ECG signal decomposed using db6 wavelet. The 3rd, 4th and 5th detail coefficients are summed up for reconstruction of the wave, as most energy of the QRS complex is concentrated in these coefficients. A function D2=d4*(d3+d5) /2 n is defined to reduce the oscillatory nature of the signal where d3, d4, d5 are the detail coefficients and n is the level of decomposition [6]. Derivation of the ECG wave is done to obtain the QRS wave segment information. Derivate up to level 5 is made using the transfer function
H (z) = f—) (—z 2—2z 1+2z1+z2) (1)
\8Г/
The differential equation:
y(nT)=(1/8T)(-x(nT-2T)-2x(nT-T)
+2x(nT+T)+x(nT+2t) (2)
is applied to the signal, by using the transfer function and taking the amplitude response as
|Н(иТ) = 14) [sin(2wT) + 25in(coD] (3)
This gives close approximation of ideal derivative over this range, with negligible delay.
The important mathematical concept of Squaring is used to nullify the low amplitude waves like and around P and T waves.
The signal is squared point-by-point using the equation
y(nT)=(1/8T)(-x(nT-2T)-2x(nT-T) +2x(nT+T)+x(nT+2t) (4)
This gives magnified resultant of the emphasized R wave over the entire range of the ECG signal
A moving window is integrated using the equation
Y=(1/N)*[x(nT-(N-1)T)+x(nT-(N-2)T)+…+x(nT)] (5)
to obtain the waveform feature information. The sample size i.e. N varies for different cases and the wideness range of QRS complex also lies over a vast measurement. If the window is wide enough then the QRS complex gets merge with the T complex. Whereas, in case of narrow window several QRS peaks is generated to increase the complexity of analysis. Hence, the concept of moving window is induced in the algorithm to accustomed different samples for analysis.
-
B. Watermark Embedding Procedure
A 200 sec. long ECG signal is taken. The length of the ECG signal is calculated followed by the conversion of 1-D ECG signal into a largest possible square 2-D signal. Using DWT, the 2-D signal is decomposed into four sub bands (LL 1 , LH 1 , HL 1 and HH 1 ).HH 1 is further decomposition into four sub bands (LL 2 , LH 2 , HL 2 and HH 2 ) using DWT.
A binary image (watermark) is taken and converted into 2 one-dimensional vectors. Pseudo random sequence is generated using a session based key and the size of HH 2 sub band of the 2-D signal. Each of the bits of the binary is embedded in HH 2 sub-band depending upon the elements of the one-dimensional vector and the pseudo random sequence. The general equation used to embed the secret image is [16]:
IS (x, y) = I (x, y) + k × S (x, y) (6)
In which I(x, y) representing the selected DWT sub band of the 2-D signal, IS(x, y)) is the modified 2-D signal, k denotes the amplification factor that is usually used to adjust the invisibility of the secret image in corresponding sub band. S (x, y) is the pseudo random sequence.
Taking all the sub bands including the modified HH 2 sub-band, 2D signal is obtained applying IDWT (Inverse Discrete Wavelet Transformation). IDWT is further applied to get the watermarked signal.
-
C. Watermark Extraction Procedure
The session key and the size of the HH 2 sub-bands of watermarked signal is provided to the intended receiver through a secrete communication channel.
The HH2 sub-band of watermarked signal is selected after applying DWT. The pseudo random sequence (PN) is regenerated using the same session based key that was used in the secret image embedding procedure. The correlation between the selected watermarked sub-band and the generated pseudo random sequence is calculated. Each correlation value is compared with the mean correlation value. If the calculated value is greater than twice of the mean, then the extracted watermark bit is taken as a 0, otherwise 1. The recovery process then iterates through the entire PN sequence until all the bits of the watermark image have been recovered.
-
D. P, QRS and T Components Detection from Modified
ECG signals
Modified ECG Signal is reshaped into 1-D signal. Soft thresholding is applied on the signal for denoising purpose. Proposed P, QRS and T Components detection Method is applied on the watermarked ECG signal. A comparative study is done for the two consecutive ‘R’-peaks and other peaks intervals between original and modified ECG signal.
Experimental results are evaluated using PSNR (Peak Signal-to-Noise Ratio) and Correlation values.
-
V. RESULT AND DISCUSSION
MATLAB 7.0.1 Software is extensively used for the study of the ECG watermarking embedding and extraction process. Concerned images obtained in the result are shown in Fig. 6 through 8.
The sample ECG signal analyzed in this method as test cases are rendered by Suraha Nursing Home, Kolkata.
(a)
(b)
(c)
(d)
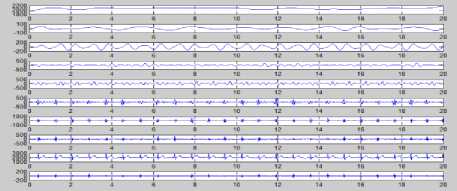
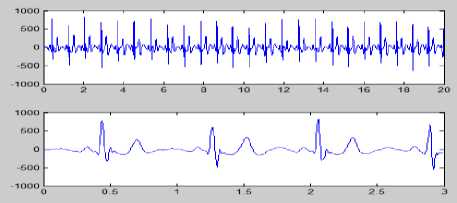
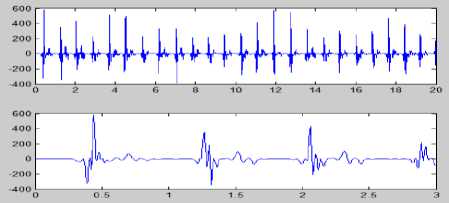
Figure 6 (a) Original ECG Signal(10 sec long); (b) Daubechies wavelet (db6) Decomposed ECG Signals; (c) Plot of D1 (d3+d4+d5); (d) Plot of D2 (d4*(d3+d5) /2n)
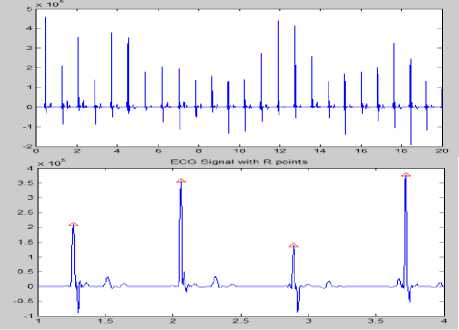
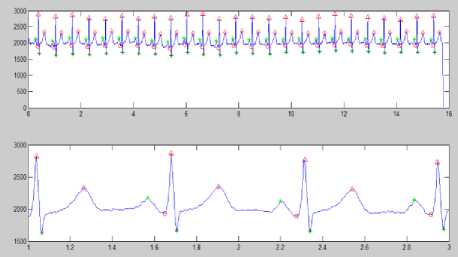
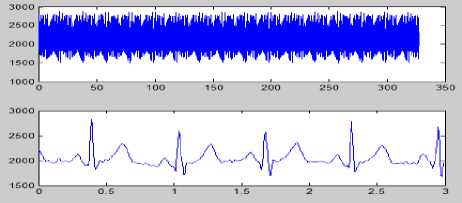
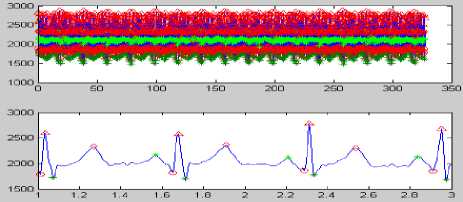
Figure 7 Plot of ECG signal with R Peaks
(a)
(b)

(d)

(e)
(f)
(g)
(h)
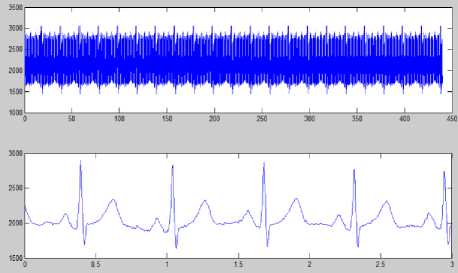
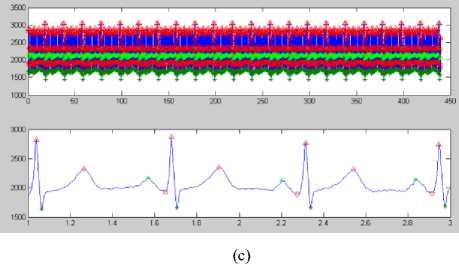
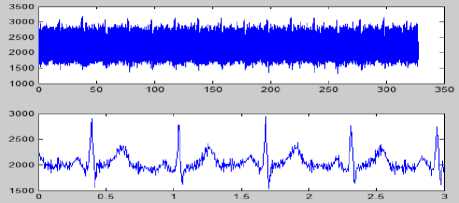
(i)
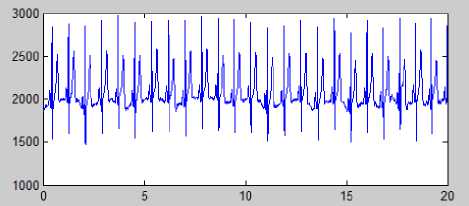
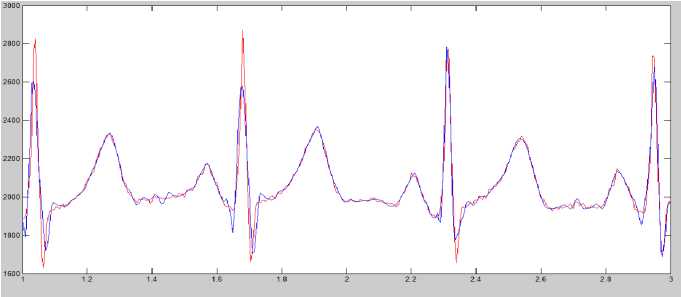
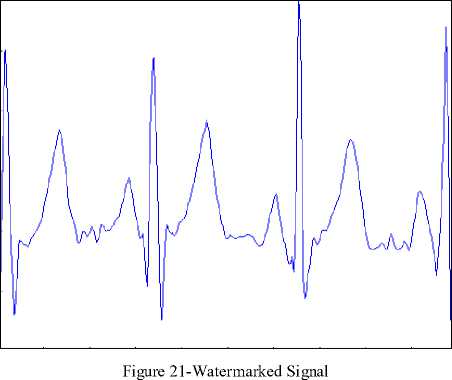
Figure 8 (a) Plot of ECG signal with P-QRS-T; (b) Original ECG signal for watermark(200 sec. long); (c) P,QRS and T components detected ECG signal before Watermark; (d) Original Watermark
Image; (e) Recovered Watermark Image; (f) Recovered Signal; (g) Recovered De-noised Signal; (h) Detected P,QRS and T Components after Watermark Extraction; (i) Plot Overlay of Original(Red) and
Watermarked (Blue) ECG Signal
TABLE 2 CORRELATION VALUE
|
Correlation between original Watermark image and recovered Watermark Image |
0.9777 |
It is observed that the extracted watermark is of good visual quality and the method is best suitable for copyright protection technique.
A. Peak Signal to Noise Ratio (PSNR)
It measures the quality of a watermarked signal. This performance metric uses to determine perceptual transparency of the watermarked signal with respect to original signal:
PSNR
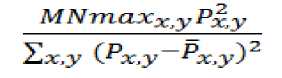
Where, M and N are number of rows and columns in the input signal,

is the original Signal and
TABLE 3 CHANGES OF PSNR, CORRELATION VALUE AND RR INTERVAL BASED ON THE AMPLIFICATION FACTOR (K)
|
Sl No. |
Amplification factor(k) |
PSNR |
Corr2 |
RR Interval before Watermark |
RR Interval after Watermark |
|
1 |
2 |
61.824 |
0.4502 |
0.6450 |
0.6450 |
|
2 |
5 |
53.886 |
0.6042 |
0.6450 |
0.6450 |
|
3 |
10 |
47.901 |
0.8059 |
0.6450 |
0.6500 |
|
4 |
20 |
41.951 |
0.9365 |
0.6450 |
0.6500 |
|
5 |
30 |
38.499 |
0.9566 |
0.6450 |
0.6500 |
|
6 |
40 |
36.069 |
0.9777 |
0.6450 |
0.6450 |
|
7 |
50 |
34.199 |
0.9777 |
0.6450 |
0.6450 |
|
8 |
60 |
32.684 |
0.9777 |
0.6450 |
0.6400 |

is the watermarked Signal.
PSNR between the original signal and watermarked signal is 32.6841 shown in Table 1 for amplification value (k) =50.
TABLE 1 PSNR VALUE
|
Original ECG Signal |
PSNR |
|
vs. Watermarked Signal |
32.6841 |
B. Correlation Coefficient
After secret image embedding process, the similarity of original signal x and watermarked signal x' is measured by the standard correlation coefficient as follows:
S S Х - Д.У™ - у ’) mn
SEk - *1 YlSk - у ’)2 m n )\ m n
Where y and y' are the discrete wavelet transforms of x and x'.
Correlation (corr2) between watermark image and the recovered watermark image is shown in the Table 2 for amplification value (k) =50.
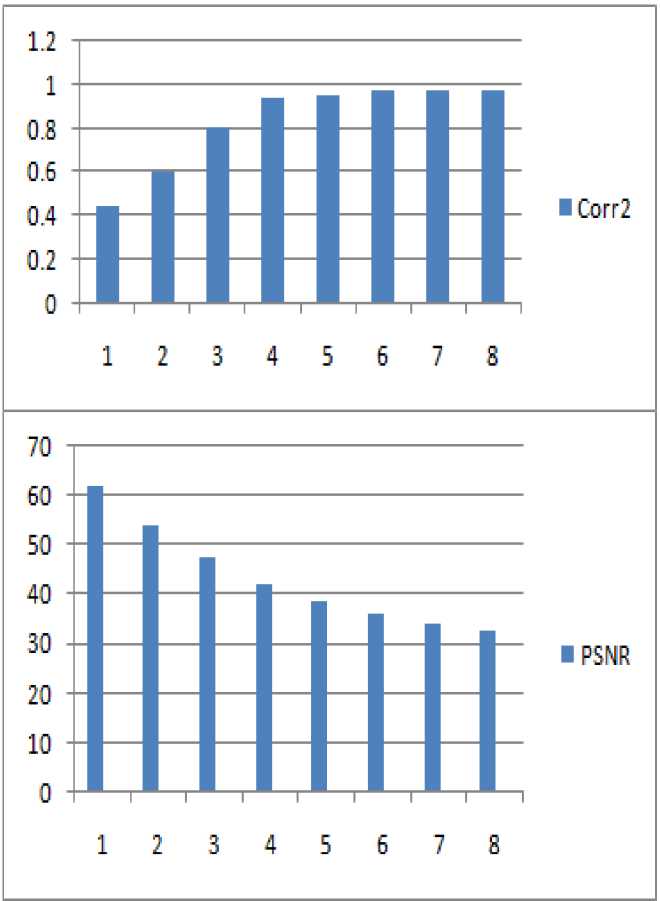
Figure 9 Changes of Correlation value, PSNR based on the Amplification factor (k)
For "normal " ECG (Heart Rate: 60 - 90 bpm)
characteristics are as follows:
PR Interval: 0.12 - 0.20 sec, QT Interval (QTc < 0.40 sec, where according to the Bazett's Formula the value of Corrected QT(QTc) is (QT)/Sq. Root RR (in seconds)[17] and QRS Duration: 0.06 - 0.10 sec.
Table 3 through 12 shows the results of watermarking taking amplification factor as 50.
TABLE 4 SHOWS THE R-R INTERVALS OF TWO CONSECUTIVE PEAKS BEFORE AND AFTER WATERMARKING
|
Sl. No. |
Interval |
Time Intervals Before Watermarking |
Time Intervals after Watermarking |
|
1 |
RR |
0.645 |
0.645 |
|
2 |
0.64 |
0.645 |
|
|
3 |
0.635 |
0.63 |
|
|
4 |
0.63 |
0.64 |
|
|
5 |
0.625 |
0.62 |
|
|
6 |
0.625 |
0.62 |
|
|
7 |
0.615 |
0.62 |
|
|
8 |
0.61 |
0.61 |
|
|
9 |
0.645 |
0.645 |
|
|
10 |
0.64 |
0.645 |
TABLE 5 SHOWS THE P-R INTERVALS OF TWO CONSECUTIVE PEAKS BEFORE AND AFTER WATERMARKING
|
Sl. No. |
Interval |
Time Intervals Before Watermarking |
Time Intervals after Watermarking |
|
1 |
P-R |
0.11 |
0.1 |
|
2 |
0.115 |
0.105 |
|
|
3 |
0.11 |
0.11 |
|
|
4 |
0.115 |
0.1 |
|
|
5 |
0.11 |
0.115 |
|
|
6 |
0.11 |
0.1 |
|
|
7 |
0.115 |
0.1 |
|
|
8 |
0.105 |
0.1 |
|
|
9 |
0.115 |
0.11 |
|
|
10 |
0.11 |
0.1 |
TABLE 6 AVERAGE R-R INTERVAL BEFORE AND AFTER WATERMARKING
|
Interval |
Total no. of Interval |
Average Interval Before Watermarking |
Average Interval After Watermarking |
|
R-R |
10 |
0.631 |
0.632 |
TABLE 7 HEART RATE BEFORE AND AFTER WATERMARKING
|
Heart Rate Before Watermarking |
Heart Rate After Watermarking |
|
95.08 |
94.93 |
Heart rate almost remains unaffected even after applying watermark.
Cardiac output can be defined as the blood ejection from the left or right ventricle into the aorta or pulmonary trunk per minute.
Cardiac Output=Heart Rate * Stroke Volume where, Stroke Volume is defined as the amount of blood pumped by each ventricle with each heartbeat (Average 70ml. per beat for the adult at rest).
Stroke Volume is the difference between end diastolic volume and end systolic volume [18].
Cardiac output remains unchanged as an effect of watermarking.
TABLE 8 SHOWS THE Q-T INTERVALS OF TWO CONSECUTIVE PEAKS BEFORE AND AFTER WATERMARKING
|
Sl. No. |
Interval |
Time Intervals Before Watermarking |
Time Intervals after Watermarking |
|
1 |
Q-T |
0.255 |
0.245 |
|
2 |
0.27 |
0.26 |
|
|
3 |
0.255 |
0.26 |
|
|
4 |
0.265 |
0.245 |
|
|
5 |
0.265 |
0.260 |
|
|
6 |
0.285 |
0.265 |
|
|
7 |
0.255 |
0.245 |
|
|
8 |
0.25 |
0.26 |
|
|
9 |
0.26 |
0.255 |
|
|
10 |
0.28 |
0.25 |
TABLE 9 SHOWS THE Q-Tc INTERVALS OF TWO CONSECUTIVE PEAKS BEFORE AND AFTER WATERMARKING
|
Sl. No. |
Interval |
Time Intervals Before Watermarking |
Time Intervals after Watermarking |
|
1 |
QTc |
0.317512131 |
0.305060675 |
|
2 |
0.3375 |
0.323737859 |
|
|
3 |
0.320002461 |
0.32756921 |
|
|
4 |
0.333868618 |
0.30625 |
|
|
5 |
0.335201432 |
0.33020033 |
|
|
6 |
0.360499653 |
0.336550337 |
|
|
7 |
0.325164124 |
0.311150311 |
|
|
8 |
0.3200922 |
0.332895888 |
|
|
9 |
0.323737859 |
0.317512131 |
|
|
10 |
0.35 |
0.311332503 |
R-R interval is the inverse of the heart rate.
Heart Rate=60/Avg. R-R Interval (Beats-per-minute)
TABLE 10 SHOWS THE QRS DURATION IN SEC. BEFORE AND AFTER WATERMARKING
|
Sl. No. |
Duration |
Time Duration Before Watermarking |
Time Duration after Watermarking |
|
1 |
QRS |
0.055 |
0.045 |
|
2 |
0.07 |
0.06 |
|
|
3 |
0.055 |
0.06 |
|
|
4 |
0.065 |
0.045 |
|
|
5 |
0.06 |
0.065 |
|
|
6 |
0.08 |
0.065 |
|
|
7 |
0.055 |
0.045 |
|
|
8 |
0.055 |
0.065 |
|
|
9 |
0.065 |
0.06 |
|
|
10 |
0.08 |
0.065 |
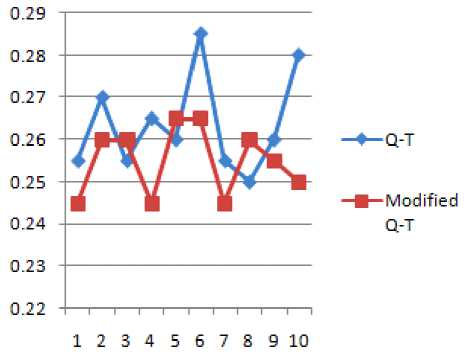
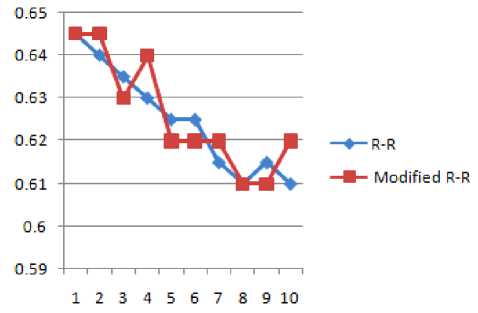
Figure 10 R-R and Modified R-R
Figure 12 Q-T and Modified Q-T
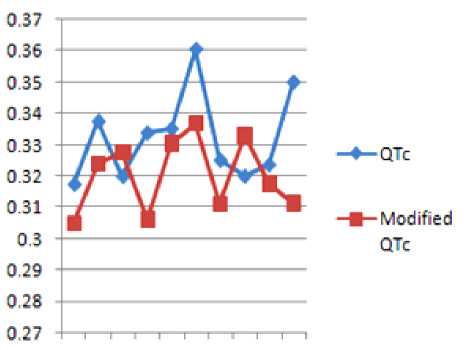
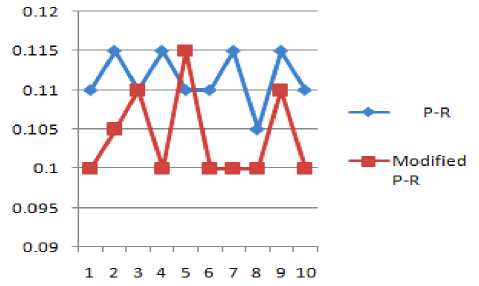
Figure 11 P-R and Modified P-R
1 2 3 4 5 6 7 8 9 10
Figure 13 QTc and Modified QTc
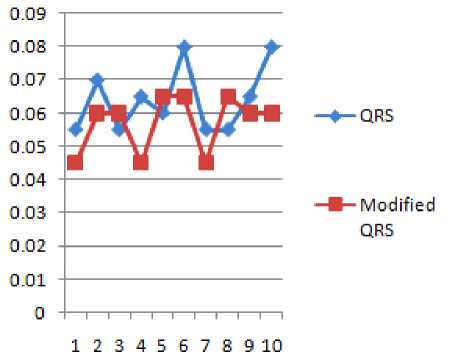
Figure 14 QRS Duration and Modified QRS Duration
TABLE 11 RESULT ANALYSIS OF R-R INTERVALS BEFORE AND AFTER WATERMARKING
|
R-R Interval |
||
|
Results |
Before Watermarking |
After Watermarking |
|
Total Number of Peak Intervals |
10 |
10 |
|
Mean (Average) |
0.631 |
0.632 |
|
Standard deviation |
0.0122 |
0.01358 |
|
Variance (Standard deviation) |
0.00015 |
0.00018 |
|
Population Standard deviation |
0.01158 |
0.01288 |
|
Variance (Population Standard deviation) |
0.00013 |
0.00017 |
TABLE 14 RESULT ANALYSIS OF Q-Tc INTERVALS BEFORE AND AFTER WATERMARKING
|
QTc |
||
|
Results |
Before Watermarking |
After Watermarking |
|
Total Number of Peak Intervals |
10 |
10 |
|
Mean (Average) |
0.33236 |
0.32023 |
|
Standard deviation |
0.0141 |
0.01148 |
|
Variance (Standard deviation) |
0.0002 |
0.00013 |
|
Population Standard deviation |
0.01338 |
0.01089 |
|
Variance(Population Standard deviation) |
0.00018 |
0.00012 |
TABLE 12 RESULT ANALYSIS OF P-R INTERVAL BEFORE AND AFTER WATERMARKING
|
P-R Interval |
||
|
Results |
Before Watermarking |
After Watermarking |
|
Total Number of Peak Intervals |
10 |
10 |
|
Mean (Average) |
0.1115 |
0.104 |
|
Standard deviation |
0.00337 |
0.00568 |
|
Variance (Standard deviation) |
0.00001 |
0.00003 |
|
Population Standard deviation |
0.0032 |
0.00539 |
|
Variance (Population Standard deviation) |
0.00001 |
0.00003 |
TABLE 15 RESULT ANALYSIS OF QRS DURATIONS BEFORE AND AFTER WATERMARKING
|
QRS Duration |
||
|
Results |
Before Watermarking |
After Watermarking |
|
Total Number of Peak Intervals |
10 |
10 |
|
Mean (Average) |
0.064 |
0.0575 |
|
Standard deviation |
0.00994 |
0.0089 |
|
Variance (Standard deviation) |
0.0001 |
0.00008 |
|
Population Standard deviation |
0.00943 |
0.00844 |
|
Variance(Population Standard deviation) |
0.00009 |
0.00007 |
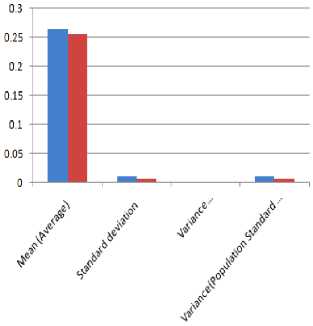
TABLE 13 RESULT ANALYSIS OF Q-T INTERVALS BEFORE AND AFTER WATERMARKING
|
Q-T Interval |
||
|
Results |
Before Watermarking |
After Watermarking |
|
Total Number of Peak Intervals |
10 |
10 |
|
Mean (Average) |
0.264 |
0.2545 |
|
Standard deviation |
0.0115 |
0.00762 |
|
Variance (Standard deviation) |
0.00013 |
0.00006 |
|
Population Standard deviation |
0.01091 |
0.00723 |
|
Variance (Population Standard deviation) |
0.00012 |
0.00005 |
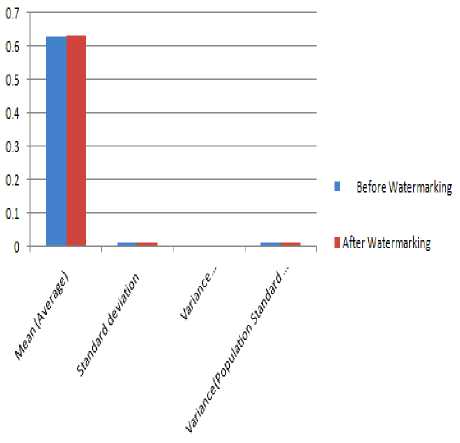
Figure 15 R-R intervals analysis before and after watermarking
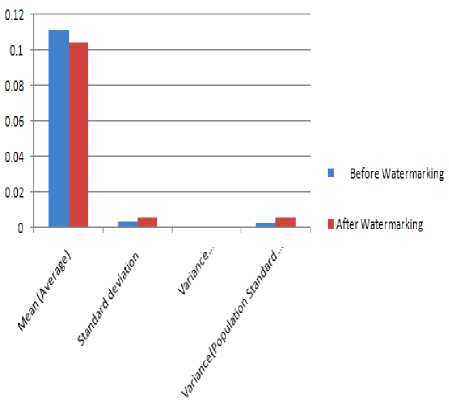
Figure 16 P-R intervals analysis before and after watermarking
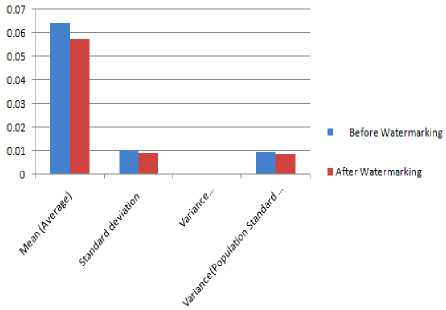
Figure 19 QRS duration before and after watermarking
■ Before Watermarking
■ After Watermarking
Figure 17 Q-T intervals analysis before and after watermarking
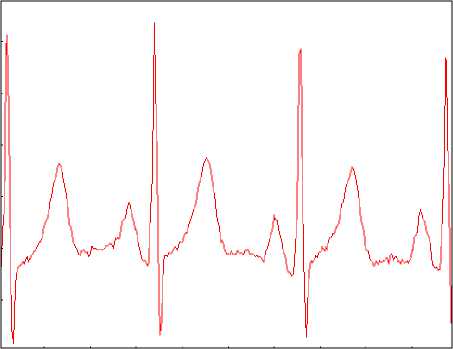
Figure 20 Original ECG Signal

Figure 18 Q-Tc intervals analysis before and after watermarking
The Watermarked ECG signal is compared with Original ECG signal based on nine performance measurements, namely, true positive (TP, a number of signal correctly detected), false positive (FP, a number of non-signal which are detected wrongly as signal), false negative (FN, a number of signal that are not detected), true negative (TN, a number of non-signal which are correctly identified as non-signal), sensitivity, specificity and accuracy are calculated.
TP
Sensitivity (Ss) = TP+FN ' TN
Specificity (SP) = TN*FP
Accuracy (%) = TP+TN + FP +FN
The overall accuracy of the proposed watermarking method is 96%
-
VI. CONCLUSION
For the application of wavelet transformation in electro cardiology, more methodological aspects (Choice of the mother wavelet, values of the scale parameters) of the wavelet technique require further investigations in order to improve the clinical usefulness of this original signal processing technique. Imperative clinical usefulness is drawn from the innovative application of wavelet transformation in electro cardiology. The wavelet technique will require auxiliary investigations in many methodological aspects such as selecting choice of mother wavelet and values of scale parameter to improve the clinical utility. This biomedical signal processing results in detecting many cardiovascular diseases based on diagnosing the ECG signal. The measurement of amplitude and intervals achieved in the proposed method is hence compared to the ground truth by medical expertise to detect a set of cardio vascular diseases in human.
The performance of the algorithm is measured using the “Test Performance.” Sensitivity, specificity, PPV, PLR and sensitivity are used as the performance measurement of watermarked signal, because they combine true positive and false positive rates.
Proposed technique of watermarking is useful in telemedicine applications for authentication of the source of the information. In this present work as Watermark is embedded in the HH sub band of the original ECG signal, there is a small change in between the original signal and the watermarked signal generating some imperceptibility of ECG data. However, due to strong security aspects, this small amount of imperceptibility is acceptable. The values of correlation and PSNR are very much encouraging regarding the faithfulness of the reconstruction of the image.
References Analysis of P-QRS-T Components Modified by Blind Watermarking Technique Within the Electrocardiogram Signal for Authentication in Wireless Telecardiology Using DWT
- ECG Signal Analysis Using Wavelet Transforms, C. Saritha, V. Sukanya, Y. Narasimha Murthy, Department of Physics and Electronics, S.S.B.N. COLLEGE (Autonomous), Andhra Pradesh, India(http://bjp-bg.com/papers/bjp2008_1_68-77.pdf)
- Automatic Detection of ECG R-R Interval using Discrete Wavelet Transformation, Vanisree K, Jyothi Singaraju, International Journal on Computer Science and Engineering (IJCSE), Vol. 3 No. 4 Apr 2011.
- Identification of Cardiac Arrhythmias using ECG, Pooja Sharma, Ms. Lakhwinder Kaur, Int.J.Computer Technology & Applications, Vol 3 (1), 293-297.
- http://www.cinc.org/2011/preprints/247.pdf
- A Novel Approach of Color Image Hiding using RGB Color planes and DWT, Nilanjan Dey, Anamitra Bardhan Roy, Sayantan Dey, International Journal of Computer Applications (0975 – 8887), Volume 36– No.5, December 2011
- A Real Time QRS Detection Algorithm, Jiapu Pan and Willis J. Tompkins, Senior Member, IEEE, IEEE Transactions on Biomedical engineering, Vol . BME 32, NO. 3, March 1985.
- Christian Rey, Jean-Luc Dugelay, “A Survey of Watermarking Algorithms for Image Authentication,” EURASIP Journal on Applied Signal Processing. Volume 2002 (2002), Issue 6, Pages 613-621.
- G. Voyatzis, N. Nikolaidis, and I. Pitas. Digital watermarking: an overview. In S. Theodoridis et al., editors, Signal processing IX, theories and applications: proceedings of Eusipco-98, Ninth European Signal Processing Conference, Rhodes, Greece, 8–11 September 1998, pages 9–12, Patras, Greece, 1998. Typorama Editions.
- Potdar, Vidysagar and Han, Song and Chang, Elizabeth, “A survey of digital image watermarking techniques”, Proceeding of 3rd IEEE-International Conference on Industrial Informatics, Frontier Technologies for the Future of Industry and Business, pp. 709-716, Perth, WA, Aug 10, 2005.
- Chan, C. K. and Cheng, L. M. 2003. Hiding data in image by simple LSB substitution. Pattern Recognition, 37:469-474.
- Juan R. Hernández, Martín Amado, Fernando Pérez-González, “DCT-Domain Watermarking Techniques for Still Images: Detector Performance Analysis and a New Structure”, IEEE TRANSACTIONS ON IMAGE PROCESSING, VOL. 9, NO. 1, JANUARY 2000.
- B. Tao and B. Dickinson, “Adaptive watermarking in the DCT domain,” in ICCASP’97. Munich, Germany, Apr. 1997, pp. 2985–2988.
- Anumol T.J, P Karthigaikumar,” DWT based Invisible Image Watermarking Algorithm for Color Images,” IJCA Special Issue on “Computational Science - New Dimensions & Perspectives” NCCSE, 2011.
- Mei Jiansheng, Li Sukang. Tan Xiaomei,” A Digital Watermarking Algorithm Based On DCT and DWT”, Proceedings of the 2009 International Symposium on Web Information Systems and Applications (WISA’09) Nanchang, P. R. China, May 22-24, 2009, pp. 104-107.
- E. Hoˇsˇt´alkov´a, A.Proch´azka, Institute of Chemical Technology, Department of Computing and Control Engineering,” WAVELET SIGNAL AND IMAG E DENOISING.”
- Nilanjan Dey, Moumita Pal, Achintya Das, “A Session Based Blind Watermarking Technique within the NROI of Retinal Fundus Images for Authentication Using DWT, Spread Spectrum and Harris Corner Detection”, International Journal of Modern Engineering Research , Vol.2, Issue.3, May-June 2012 pp-749-757.
- http://library.med.utah.edu/kw/ecg/ecg_outline/Lesson3/index.html
- [18http://www.physiol.med.uu.nl/interactivephysiology/ipweb/misc/assignmentfiles/cardiovascular/ Cardiac_Output.pdf
