Analysis of PV-FC Hybrid System Operation Considering Sale Electricity

Author: Amirali Shahkoomahalli
Journal: International Journal of Modern Education and Computer Science (IJMECS) @ijmecs
Article in issue: 5 vol.5, 2013.
Free access
This paper presents a hybrid power generation system modeling and simulation with the objective of electricity sale to distribution network (DN) which consists of photovoltaic (PV) module, proton exchange membrane (PEM) fuel cell (FC), hydrogen storage tank (HST) and electrolyzer (EL).Since last researches in optimal FC and PV application aimed in power electronic approach, In this paper the application between FC and PV is considered with the aim of maximizing profit gained due to electricity sale revenue to DN. The revenue from electricity sale to DN considering electricity price in low load, shoulder load and peak load hours is considered as the system profit. Also in a sensitivity analysis the impact of technical parameters of hybrid system components is investigated on system profit. The results showed that the system saves the electricity by hydrogen storage in HST in low load hours and sale it with more prices in shoulder load hours to DN. Also the obtained results show that several technical parameters of PV and PEM FC have considerable impact on system operation and profit.
Photovoltaic, Fuel cell, Electricity Price, Distribution network, GAMS
Short address: https://sciup.org/15014547
IDR: 15014547
Text of the scientific article Analysis of PV-FC Hybrid System Operation Considering Sale Electricity
Published Online June 2013 in MECS DOI: 10.5815/ijmecs.2013.05.04
Daily increase in energy demand caused new ambitions toward renewable and constant power technologies such as Photovoltaic (PV), Wind and Fuel cell (FC). The need to generate energy by renewable energy sources is increasingly growing since demand of electrical energy is increasing due to population growth and industrialization. Meanwhile, the sources of fossil fuels are reducing [1]. Generating energy in conventional method has the following drawbacks:
-
> Distribution lines cause significant losses
-
> Having weak voltage regulation and low quality
-
> Low reliability
The drawbacks can be removed by locally energy generation using renewable energy sources, like PV, FC and Wind turbine. This kind of energy generation is called Distributed Generation (DG). Some advantages of Distributed Generation (DG) are Low Distribution Losses, Better Power Quality and High Reliability [2-4]. When different kinds of renewable energy sources come together, they generate a Hybrid Distributed Generation System (HDGS). PV generator is one of the proposed sources in Hybrid Distributed Generation System (HDGS). PV is one of renewable energy systems which have always been in the spotlight and in recent years it has been increasingly expanded on business affairs. PV directly converts solar radiation energy to electrical energy and considering weather condition and Level of solar radiation the amount of generating energy changes. A PV generator has some drawbacks as well which are the followings [5]:
-
> PV output voltage versus current follows a nonlinear relation.
-
> The PV output power varies with solar radiation.
-
> This generated power variation causes disturbance for the utility or connected users.
-
> No power generation is feasible during night hours.
-
> Lack of control for generating power in PV caused it not to be able to schedule in generation for different periods which is one of the obstacles in business improvements in this technology.
When PV connected with a suitable auxiliary energy source, above drawbacks can be reduced or solved. The auxiliary energy sources that can work in connection with PV are FC, Wind Turbine, Battery and Diesel Generator. Battery is only low load solutions. Wind Energy is clean and renewable, but its reliability is low. The diesel Generator offers a compact size and high energy density, but it's not clean and renewable and its running cost is very high. FC converts chemical energy to Electrical energy and the amount of power generation can be controlled by regulating the fuel provided for it (Natural Gas/hydrogen). FC is an eco-friendly which owns a higher energy density and also can generate power as long as the fuel is supplied. FC suffers from running cost, but because of higher conversion efficiency, its performance is better compared to a Diesel Generator [6].
FC is capable of generating controlled energy in different periods and can be coupled with PV as an auxiliary source. Hence, FC acts as a source of Energy storage to compensate the intermittent in power generating of PV; As a result, it makes the scheduling of electric generating possible. Increased profits of generating electrical energy and increasing reliability in providing electrical demand of the consumers are the advantages of simultaneous application of PV and FC. From the current discussion, we can conclude that an HDGS System consists of PV and FC sources will result in an optimal HDGS which is capable of providing clean and reliable power round o’clock [7].
Investigating the studies, we have observed that problem of optimal application in PV and FC in all papers has been with the view of power electronic in order to provide the load power demand (peak-shaving). This problem has never been investigated on the view of electricity sale from hybrid system to DN. In [8] this problem investigated with objective of electricity sale to DN but the electricity price in low, shoulder and peak load not considered and system profit was the rate of sold electrical energy to DN in term of Wh. In this paper, a hybrid system modeling and simulation is presented by simultaneous and optimal application PV and FC and objective of electricity sale to DN considering electricity price and also is implemented a sensitivity analysis to find the technical parameters impact on the rate of electricity sale and system profit.
In this paper, the system description is presented in section two, the objective function of problem defined in section three, the obtained results and discussion is presented in section four, in section five a sensitivity analysis is applied to investigating the effects of technical parameters of system on sale electricity and in section six is concluded the results.
DC Bus AC Bus
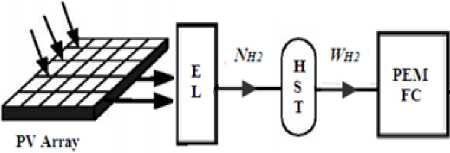
Figure 1. The block diagram of case study system.
^ To Grid
II. S ystem D escription
In this section, mathematical models for components of hybrid distributed generation system (HDGS) are explained. Proposed HDGS consists of PV and PEMFC with one EL and HST. The block diagram of case study system is depicted in Fig. 1.
In this system, with receiving solar radiation, PV generates necessary power for generating hydrogen for EL, and then the generated hydrogen is delivered into the tank and stored under pressure. Based on house power demand and maximizing the system profit, some of hydrogen is used by FC and the rest is stored in the tank under pressure. It's worthwhile to mention that the amount of hydrogen stored in HST is so effective in the amount of system profit and that the amount of hydrogen storage depends on tank pressure.
-
A. Calculation of PV Output Power
The solar radiation converts to electricity by PV. The output power of PV considering temperature and solar radiation changes is calculated by [9]:
PPv = VpvIpv(1)
Vpv = Vref + (вT - Rs (a(-G)AT + (-G-1)Isc))
G ref
Ipv = Iref + (a (G )A T + (-G -1) Isc )
G ref G ref
P PV : I PV : V PV :
V ref :
I ref :
G: V OC : I SC :
α, β:
A T-
PV Array output power [W] PV Array output voltage [A] PV Array output current [V] PV Array voltage in standard condition [V]
PV Array current in standard condition
[A]
Solar radiation [W/m2]
Photovoltaic open circuit voltage [V] Photovoltaic short circuit current [A] Current and voltage change temperature coefficients
PV cell Temperature variation [°K]
In this paper, temperature variations are ignored.
-
B. Calculation of PEMFC Output Power
The oxygen and hydrogen energy converts to electricity. The amount of output voltage in each cell is little, so some cells connected in series to gain a bigger output voltage and that is called FC stack. The performance of FC is described by polarization curve and in a constant state which shows FC voltage based on the current. Three basic areas which affect the overall polarization are as followings [10]:
> Ohmic Polarization
> Activation Polarization
> Concentration Polarization
Above factors are cell voltage drops which change the cell potential from ideal behavior. FC output voltage is mentioned in polarization curve calculated by:
V FC
E .
nernst act
-
ohmic
-V con
VFC :
E nernst :
Vact :
V L ohm :
V con
Cell output voltage [V]
Cell potential open-circuit voltage [V]
Activation voltage drop [V]
Ohmic voltage drop [V] Concentration voltage drop [V]
O 2
C O 2 a 498
6 498
E shows open circuit and lossless voltage in FC and defined by
Concentration polarization shows voltage drop due to reduction in density of reaction materials which is called mass transport losses. To determine voltage drop model in mass transport or concentration voltage drop, maximum current density must be gained (J max ). Voltage drop corresponding to mass transport can be calculated by:
E nernst - 1.229 - 0.85 x 10 - 3 ( T - 298.15) +
4.3085 x 10 - 5 T [l n( P H ) + 0.5ln( P^ ) J
V con -BB ln(1 - ( JI J max )) (11)
J max : Maximal current density [mA/cm2]
Constant associated with concentration
: losses
T: Operation temperature [°K]
P H 2 : Partial pressure of oxygen [atm]
P O 2 : Partial pressure of Hydrogen [atm]
Ohmic polarization shows ohmic voltage drop occurs due to resistive losses in the cell which is caused by resistance against electrons and ions movement. The ohmic voltage drop can be defined as follows:
V ohmic = i FC ( RM + RC )
i FC : Cell output current [A]
RC :
RM :
Equivalent resistance to proton conduction
[Q]
FC membrane resistance against ions passing [Q]
Where, R C is the resistance of FC electrodes against electrons movement which is constant and R M is the FC membrane resistance against ions passing, which can be calculated by:
R m = P m ( lA ) (7)
p M . Membrane specific resistivity [Q.m]
A: Cell active area [cm2]
l : Membrane thickness [gm]
_ 181.6((1 + 0.03( i FC / A ) + 0.062 T /303)2( i FC A) )2 ' 5)
P m = (( ^ - 0.634 - 3( i FC A ))exp(4.18(( T - 303)/ T )))
Ф : Membrane humidity [Q.m]
Activation polarization shows activation voltage drops in FC anode and cathode electrodes. These drops are caused by the slow reactions on the surface of electrodes which are calculated by:
Vac. Ч й + & T + ^T ln( C0 ,) + § 4 T ln iFC ) J (9)
§ i - 4 : Parameters corresponding to Vact
Where CO oxygen concentration rate on the catalyst surface which can be described as follow:
Considering all FCs voltage drops and for n cells which are connected in series by forming a stack, output power of FC stack is defined as follows:
P =N -V -i
1 FC 1N FC FFC FFC
PFC : Fuel Cell output Power [W]
NFC : Number of cells in FC stack
The FC current iFC can be determined as a function of hydrogen flow rate to FC and can be obtained by:
FCC - (2 F^N fc )(W„JM „, ) (13)
MH 2 Molar mass of hydrogen [kg kmol-1]
W Consumed hydrogen moles per second by
H 2 : FC [Kmol s-1]
-
C. Calculation of Hydrogen Production Rate
Water by EL can be decomposed into its elementary components. This process is done by passing electrical current between two electrodes that are separated by an aqueous electrolyte. The rate of hydrogen production in an EL is directly proportional to electrical current which is given by [11]:
N h, = ^ f H c I el /2 F (14)
-
F : Faraday constant [C kmol-1]
IEL : EL current [A]
-
nc: Number of EL cells in series
-
n F : Faraday efficiency
N Produced hydrogen moles per second by
-
H 2 : EL [Kmols-1]
The ratio between the real and theoretical maximum amount of hydrogen which is produced in the EL is called faraday efficiency and defined by:
П - 96.5 e (0.09/ I EL - 75.5II E l ) (15)
-
D. HST Modeling
Physical hydrogen storage is one of the storage techniques that use tank to store compressed hydrogen. After compressing under high pressure, the hydrogen molar flow which is required by PEMFC is sent from the HST. The model of HST is described according to (16) [12] and using the ratio of hydrogen flow to the tank, directly obtained the tank pressure.
P - P = z (( N - W ) RT M V ) (16)
b bi H2 H2 b H2 b universal (Rydberg) gas constant [J
R: (kmol °K)-1]
P b : Pressure of tank [Pa]
Pbi: Initial pressure of the storage tank [Pa]
Tb: Tank operating temperature [°K]
Vb: volume of the tank [m3]
compressibility factor as a function of tank
z: pressure
-
III. O bjective F unction
The power injected to ac bus considering the efficiency of AC/DC converter is defined by
P sys ( t ) = P fc ( t ) (17)
P sys : Hybrid system power
The equations from (1) to (17) represent the mathematical formulation of hybrid system. This modeling is implemented as MINLP in GAMS environment [13]. The objective function is to maximize the system profit due to selling electricity to the DN. The objective function can be defined by
Maximize System profit = L t K • P sae ( t )] (18)
t = 1
P sale : Sold power to DN (W)
K : Electricity Price (€/KWh)
The difference of power between generated power by hybrid system and consumed power by the house refers to sold power to DN and is calculated by
P sae ( t ) = P sys ( t ) — P House ( t ) (19)
PHouse : House power demand
-
A. Constraints
-
> Generated power by hybrid system in every moment must be more than house power demand as follows:
P sys (t) > P House (t) (20)
-
> HST pressure must reach to its maximum level at least once within 24 hours. Also following is tank pressure:
Pmin ≤ Pstorage ≤ Pmax (21)
-
> Hydrogen during all hours must be transported to FC.
In other words : WH2 ≠ 0
-
B. System data
System data includes load power demand, solar radiation and cost of electrical energy within 24 hours.
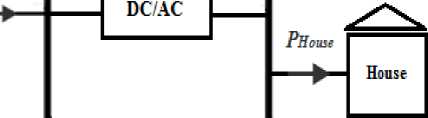
The load of typical house in Iran is shown in Fig. 2. It is assumed that the load demand over 24 hours is the profile shown in Fig. 2.
1 3 5 7 9 11 13 15 17 19 21 23
Time (Hour)
Figure 2. House power demand within 24 hours.
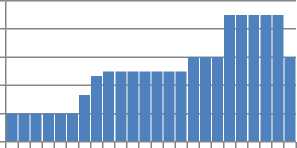
The profile of solar irradiance shown in Fig. 3.
*
1 3 5 7 9 11 13 15 17 19 21 23 25
Time (Hour)
Figure 3. The profile of solar radiation within 24 hours.
Price of electricity is presented in Table I according to low load, shoulder load and peak load hours.
TABLE 1
PRICE OF SOLD ELECTRICITY TO DN
|
Hour |
(low load) 0:00-6:00 |
(shoulder load) 6:0018:00 |
(peak load) 18:0024:00 |
|
Price (€/KWh) |
5 |
10 |
13 |
IV. R esults and D iscussion
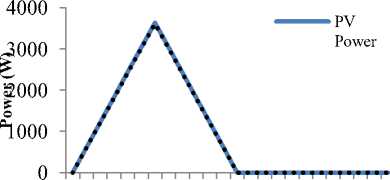
The power generated by PV and consumed power by EL for hydrogen production is shown in Fig. 4. According Fig. 3, PV is capable to produce power due to radiation from 6 to 18. Also in these hours, with receiving PV power by EL, hydrogen is produced. The results show that in remaining hours, PV is not able to produce power for EL and in these hours hydrogen is not produced.
clear from tank pressure variations, with the tank being filled with hydrogen at 17, the pressure reaches to its maximum level at this hour which equals 2 atmospheres. But from 17 onwards, with reducing hydrogen production and stopping production process, storing in tank is stopped and stored hydrogen is consumed by FC. In this situation tank pressure curve continues smoothly.
6 8 10 12 14 16 18 20 22 24 2 4
Time (Hour)
Figure 4. Produced power by PV and consumed power by EL within 24 hours.
The rate of hydrogen production by EL, hydrogen consumption by FC (tank output molar flow) and tank stored hydrogen are depicted in Fig. 5. According to house demand in all hours and considering maximizing the system profit resulting from electricity sales to DN, being under pressure in tank, amount of hydrogen is delivered to FC for power generation. The rest of hydrogen is also stored in tank for future use and it's delivered to FC when PV can’t generate power for electrolysis process. According to Fig. 5, with receiving the power of PV by EL, produces hydrogen from 6 to 18. But in remaining hours is not capable to produce hydrogen due to lack of solar radiation. The house needs power during all hours and must the aim of selling electricity to DN is considered in these hours. Being under pressure in tank, some amount of produced hydrogen is delivered to FC and the rest is stored. According to curve related to tank stored hydrogen, it is clear that amount of hydrogen is positive from 6 to 17. This means that in these hours hydrogen is produced, some amount of hydrogen is also stored in tank more over consuming hydrogen by FC. In other words, the tank is filling of hydrogen which happens at 17. But from 17 onwards, with reducing the level of hydrogen production and stopping production process, the storing is no longer happens in tank and only FC uses hydrogen stored in the tank. This is visible in negative values in Fig. 5. As mention earlier, the maximum house demand is from 17 to 23 in which some more hydrogen is extracted from the tank and delivered to FC as shown in Fig. 5.
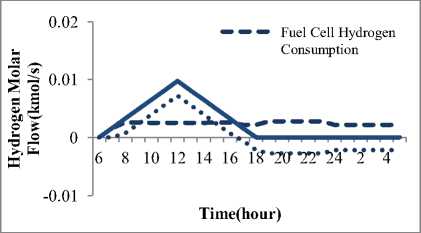
Figure 5. Produced hydrogen by EL, consumed hydrogen by FC and tank hydrogen storage.
Tank pressure variations are illustrated in Fig. 6. Being filled of hydrogen, tank pressure reaches to its maximum amount for once within 24 hours. As it is
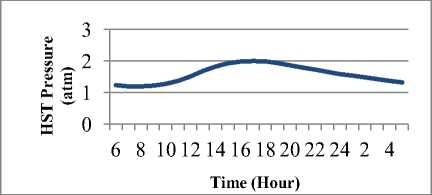
Figure 6. The pressure changes of HST.
The generated electricity by PEMFC, Sold electricity to DN and house electricity demand during 24 hours is shown in Fig. 7. PEMFC generates electricity proportional to consumed hydrogen molar flow rate.
According to Fig. 7, it can be observed that maximum power is sold to DN is during 1 to 5 which is related to low load period. During 19 to 23 it is related to peak load period in which the generated electricity is only devoted to house demand supply which indicates system optimal performance. The results of optimization prove this claim that moreover providing house demand, electricity can also be sold by proposed hybrid system to
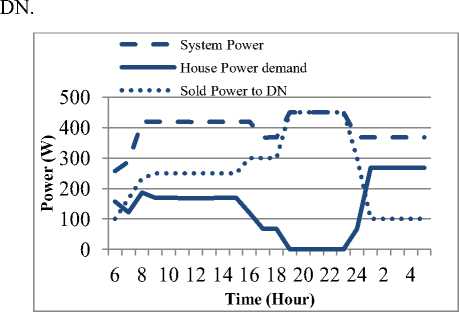
Figure 7. The generated power by FC, Sold power to DN and house power demand during 24 hours.
The system profit within 24 hours is presented in Fig.
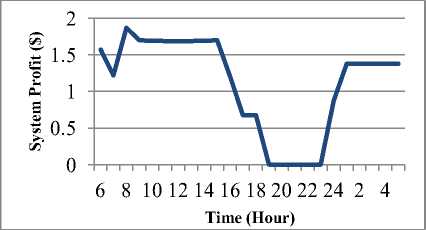
Figure 8. System profit changes curve in 24 hours.
As shown as in Fig. 8, system profit is zero from 19 to 23. This means that house demand has peak level within these hours. According to optimization goals which include house demand supply and maximizing system profit and since house demand is in priority, the optimization program devotes produced power by system to house demand supply (peak-shaving) which indicates system suitable performance in optimization. Maximum level of profit is also gained from 8 to 15 which is related to shoulder load hours. Also the minimum level of profit is related to peak load hours due to importance of house demand supply by system especially in house peak time. It should be mentioned that most of sold power house demand to DN is related to low load hours from 1 to 6, but due to lower cost of electrical energy in these hours comparing to average house demand hours, generally more system profit is gained during shoulder load hours.
-
V. S ensitivity A nalysis
In this section, the effects of technical parameters of PV, FC and HST volume variations are investigated on system profit and operation.
-
A. PV
In this section the effect of the parameters of PV like maximum solar radiation and sunshine hour's variations is evaluated on system profit. The system profit is calculated in three situations: 1) due to variations of maximum radiation intensity and constant sun hours, 2) due to sun hours variations and constant maximum radiation intensity and 3) due to variations of maximum radiation intensity and sun hours. It should be mentioned that the number of sun hours and maximum radiation intensity in basic analysis was 12 hours and 800 W/m2, respectively. The results of these variations are shown in Figs. 9-11. Based on the obtained results, system profit is increased in three situations.
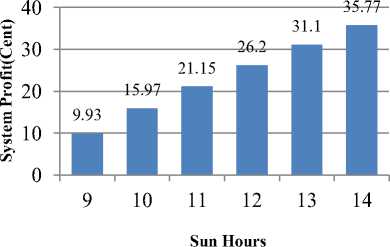
Figure 10. Sun hours Impact on System Profit.
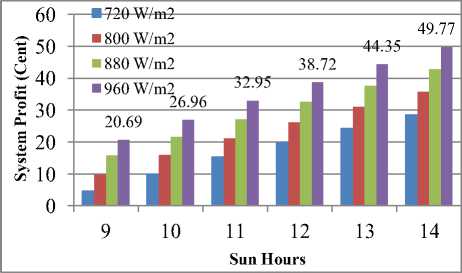
Figure 11. Sun hours and maximum radiation intensity Impact on System Profit.
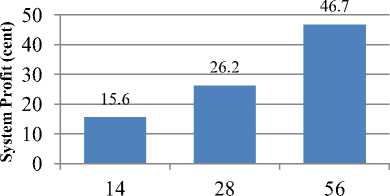
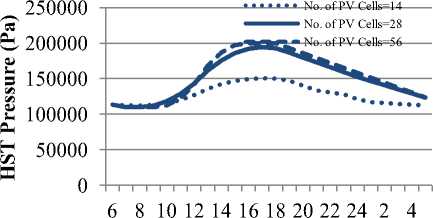
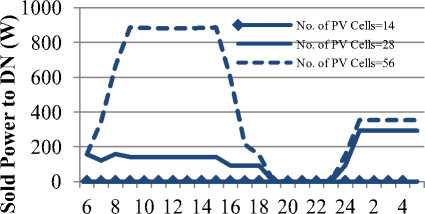
Important factor in system operation and system profit is the generated power by PV. In order to study the impact of PV, also the number of PV cells has been changed and the effect of this change is investigated on system profit and operation. Results are presented in Figs. 12-14. As shown as in obtained results, system profit is increased with PV power increasing. It is clear that the HST pressure and sold power to DN is increased resulting PV cells increasing. Also in No. of PV cells=14, power can’t be sold to DN and the system only supply the house demand.
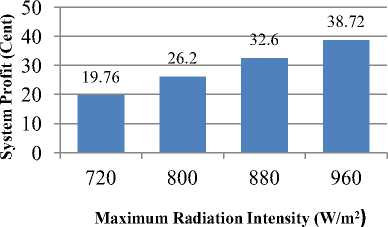
Figure 9. Maximum radiation intensity Impact on System Profit.
PV Power (W)
Figure 12. PV Power Impact on System Power.
Time (Hour)
Figure 13. PV Power Impact on HST Pressure.
Time (Hour)
Figure 14. PV Power Impact on Sold Power to DN.
-
B. FC Stack
In this section the impact of operational temperature of FC, hydrogen partial pressure and membrane humidity were investigated on system profit. The obtained results are illustrated in Figs. 15-20.
As it is clear from the results, any reduction and increase in temperature respectively leads to partial reduction and increase in system profit. This is due to direct relationship between electrochemical reaction rate in FC and these change in which reaction speed increase leads to increase production in FC.
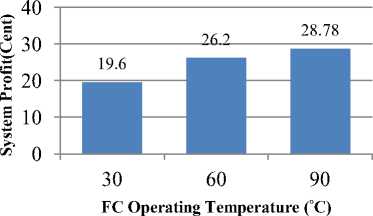
Figure 15. FC’s operating temperature impact on system profit.
pressure level is also proportional to FC structure and hydrogen molar flow entered the cell.
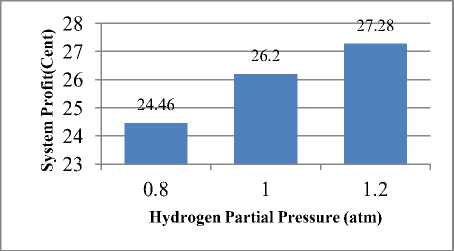
Figure 16. PEM FC Hydrogen partial pressure impact on system profit.
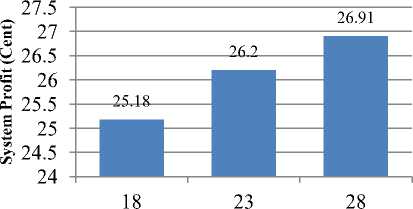
FC membrane acted as an insulator against the passage of electrons and it mostly deals with leading hydrogen ions from anode electrode to Cathode. These electrons pass through an external route called cell current. From the results, it is completely clear that increased level of membrane humidity has a direct impact in FC power increase, So that with membrane humidity increase, intensity of hydrogen ion transfer becomes more and membrane acts as a better insulator against electrons. Of course, it is difficult to control level of cell humidity and FC membrane is so sensitive in this.
FC Membrane Humidity
Figure 17. PEM FC membrane humidity impact on system profit.
Also another important factor in system operation and system profit is the generated power by PEM FC. The impact of PEM FC power variations is presented on system profit and operation in Fig. 16.
According to obtained results in Figs. 18-20, increasing the FC power capacity causes an increase in system profit and sold power. But no significant increase is showed in HST pressure.
Then, effect of changes in Hydrogen partial pressure was considered. Hydrogen partial pressure in FC was considered 1 atmosphere. Partial pressure is a pressure with which hydrogen gas strikes to anode electrode in cell and attends in reaction. It is completely clear that with pressure increasing, system profit increases, too. The reason is that increased pressure, increases rate of reaction and raises FC power production, but change in
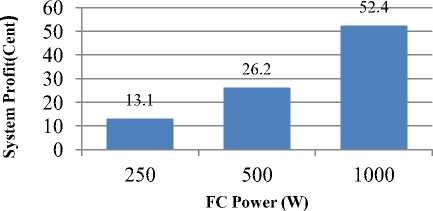
Figure 18. PEM FC power impact on system profit.
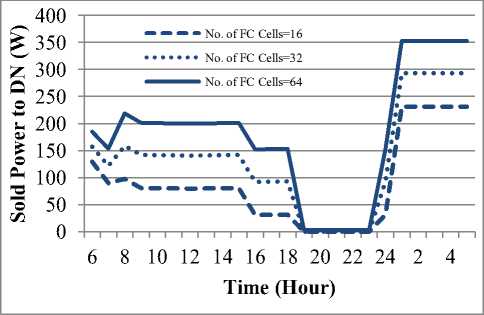
Figure 19. PEM FC power impact on Sold Power to DN.
6 8 10 12 14 16 18 20 22 24 2 4
Time (Hour)
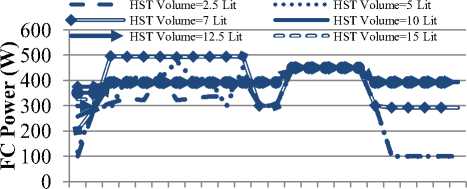
Figure 22. HST Volume impact on FC Power.
HST Volume=2.5 Lit HST Volume=5 Lit
HST Volume=7.5 Lit HST Volume=10 Lit
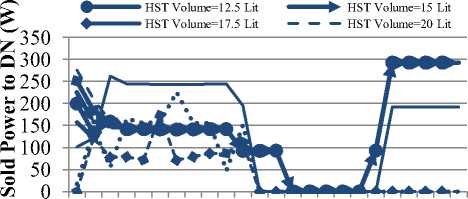
6 8 10 12 14 16 18 20 22 24 2 4
Time (Hour)
Figure 23. HST Volume impact on Sold Power to DN.
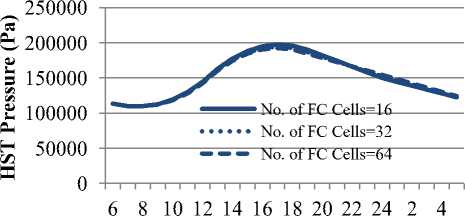
Time (Hour)
Figure 20. PEM FC power impact on HST Pressure.
C. HST
The impact of HST variations is also evaluated on system profit and operation. The impact of variations in HST volume on system profit and operation is shown in Figs. 21-24.
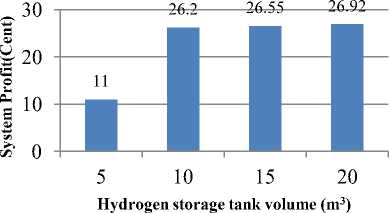
Figure 21. HST Volume impact on system profit.
HST Volume=2.5 Lit
HST Volume=5 Lit
HST Volume=7.5 Lit HST Volume=10 Lit
HST Volume=12.5 Lit HST Volume=15 Lit
HST Volume=17.5 Lit HST Volume=20 Lit
6 8 10 12 14 16 18 20 22 24 2 4
Time (Hour)
Figure 24. HST Volume impact on HST Pressure.
Investigating the obtained results, it becomes clear that tank volume reduction from basic analysis value, reduces the sold power to DN system profit rate and increased HST volume causes little system profit which isn’t significant. Followings are some instances which justifies this problem:
> Increasing the HST volume, HST maximum pressure is reduced so that it will no longer be under the basic maximum pressure. In this condition, HST molar flow rate will be reduced causing FC power production level and system profit to be reduced.
> Due to reduction of maximum pressure and tank output hydrogen molar flow rate, hydrogen depletion process becomes longer and rate of hydrogen stored in the tank which has an important role in system profit amount is increased and follows an increasing process in system profit amount.
According to these two important points, we observe a reducing, increasing or mutual behavior which results in minor increase in system profit. It is completely obvious that according to high cost of increasing tank volume, too much increase in basic tank volume is not economical.
-
VI. C onclusion
In this study the modeling and simulation of a PV-FC hybrid power generation system is presented considering sale electricity to DN. The hybrid system consists of PEM FC, PV, EL and HST.
The objective of hybrid system simulation is considered maximizing the system profit due to electricity sale to DN.
According to obtained results, it is clear that the HST has an important role in energy storage and sale electricity to DN with more prices in shoulder load hours. Considering the pressure variations of HST and management the molar flow rate of tank output, the system capable to supply the house demand and sale electricity to DN. Also seems that filling the tank with hydrogen in its maximum pressure is so important in suitable operation of hybrid system.
In a sensitivity analysis, the impact of FC and PV technical parameters is investigated on system profit in which PV and FC power capacity has significant impact on system profit. The parameters like temperature stack, hydrogen partial pressure and membrane humidity of FC have very low impact on system profit. Also the HST volume reduction from basic analysis value reduces the sold power to DN and system profit rate and increased HST volume causes little system profit which isn’t significant. It is completely obvious that according to high cost of increasing tank volume, too much increase in basic tank volume is not economical.
According to results, all optimization constraints are observed and there was no violation. The results of simulation prove this claim that moreover house demand supply, electricity can also be sold by presented hybrid system.
APPENDIX
TABLE 2 THE PARAMETERS OF SYSTEM COMPONENTS
|
MSX-120 PV module |
Value |
Parameter corresponding to Vact ( ξ 1 ) |
-0.948 |
|
Rated Power (Pmpp) |
120 Wp |
Parameter corresponding to Vact ( ξ 2 ) |
0.00286+0.0002ln(A) +0.000043ln(CH2) |
|
Rated Voltage (Vmpp) |
17.1 V |
Parameter corresponding to Vact ( ξ 3 ) |
0.000076 |
|
Rated Current (Impp) |
7.0 A |
Parameter corresponding to Vact ( ξ 4 ) |
-0.000193 |
|
Open Circuit Voltage (VOC) |
21.3 V |
Membrane humidity ( ϕ ) |
23 |
|
short Circuit Current (ISC) |
7.6 A |
B |
0.016 V |
|
Number of cells in FC stack (NFC) |
30 |
Faraday’s constant (F) |
96 484 600 C/kmol |
|
Typical FC, 500W BCS Stack |
Value |
Universal gas constant (R) |
8314.47 J/(kmol K) |
|
Cell active area (A) |
64 cm2 |
Hydrogen Storage Tank |
Value |
|
Maximal current density ( Jmax) |
469mA/ cm2 |
Volume |
0.01 m3 |
|
Operation temperature ( T) |
333K |
Minimum Pressure (Pmin) |
1.2 atm |
|
Membrane thickness ( l ) |
178 μm |
Maximum Pressure (Pmax) |
2 atm |
|
P Partial pressure of Hydrogen ( H 2 ) |
1atm |
Temperature |
298.15 ºk |
|
P Partial pressure of oxygen ( O 2 ) |
0.2095atm |
DC/AC Converter |
Value |
|
Equivalent resistance to proton conduction ( RC ) |
0.0003Ω |
Efficiency |
1 |
References Analysis of PV-FC Hybrid System Operation Considering Sale Electricity
- Anne-Marie Borbely” Distributed Generation: The power paradigm for the new Millenium”, 2001.
- P. Chiradeja and R. Ramakumar “An approach to quantify the technical benefits of distributed generation,” IEEE Trans. Energy Convers. 2004, vol. 19, no. 4, pp. 764-773.
- Saber Arabi Nowdeh, Mohammad Bagher Nasrollahnejad, Mahsa Khayyatzadeh and Sina Kashani, “Analysis of Effective Parameters of a PEMFC Considering Optimal Operation”, Research Journal of Applied Sciences, Engineering and Technology 4(22): 4845-4850, 2012.
- L. Hedstrom, C. Wallmork, P. Alvafors, “Description and Modeling of the Solar hydrogen- biogas-fuel cell System in GlashusEtt”, Journal of power sources 131(2004), pp. 340-350.
- Loc Nguyen Khanh; Jae-Jin Seo; Yun-Seong Kim; Dong-Jun Won”Power-Management Strategies for a Grid-ConnectedPV-FC Hybrid System” IEEE Transactions on Power Delivery, vol 25, no.3, pp.1874-1882, 2010.
- Amphlett JC, Baumert RM, Mann RF, Peppley BA, Roberge PR, Harries TJ. Performance modeling of the Ballard mark-IV solid polymer electrolyte fuel cell. Journal of the Electrochemical Society1995; 142(1):9–15.
- S. Arabi Nowdeh, A. R. Ghahnavie and S. Khanabdal ,” PV/FC/Wind Hybrid System Optimal Sizing Using PSO Modified Algorithm”, Universitatea Tehnică „Gheorghe Asachi” din Iasi,Romania, Tomul LVIII (LXII), Fasc. 4, 2012.
- S. Arabi Nowdeh, A. R. Ghahnavie and A. Bazzazi, “Designinig a PV/FC Hybrid System Considering Sale Electricity”, Universitatea Tehnică „Gheorghe Asachi” din Iasi, Romania, Tomul LVIII (LXII), Fasc. 2, 2012.
- S. Islam and R. Belmans, “Grid Independent Photovoltaic Fuell-Cell Hybrid System: Optimal Design and Control Strategy”, Katholieke Universiteit Leuven, ESAT-ELECTA, Kasteelpark Arenberg 10, B-3001 Leuven-Heverlee, Belgium 2002.
- Xu Qingshan, Wang Nianchun, Katsuhiro Ichiyanagi, Kazuto Yukita, “PEM Fuel Cell Modeling and Parameter Influences of Performance Evaluation”, DRPT 2008 6-9 April 2008 Nanjing China.
- Gyu-Yeong Choe; Jong-Soo Kim; Byoung-Kuk Lee; Chung-Yuen Won; Jin-Wook Kim; Ji-Won Jeong; Jae-Sun Shim” Comparative study of power sharing algorithm for fuel cell and photovoltaic hybrid generation system” Power Electronics International Conference (IPEC), pp. 2615-2620, 2010.
- J.K. Kaldellis, D. Zafirakis, E. Kondili” Optimum sizing of photovoltaic-energy storage systems for autonomous small islands” International Journal of Electrical Power & Energy Systems, Vol. 32, no.1, pp. 24-36, January 2010.
- www.GAMS.com
