Analysis of Students' Performance by Using Different Data Mining Classifiers

Author: Hilal Almarabeh
Journal: International Journal of Modern Education and Computer Science (IJMECS) @ijmecs
Article in issue: 8, 2017.
Free access
Data mining is the analysis of a large dataset to discover patterns and use those patterns to predict the likelihood of the future events. Data mining is becoming a very important field in educational sectors and it holds great potential for the schools and universities. There are many data mining classification techniques with different levels of accuracy. The objective of this paper is to analyze and evaluate the university students' performance by applying different data mining classification techniques by using WEKA tool. The highest accuracy of classifier algorithms depends on the size and nature of the data. Five classifiers are used NaiveBayes, Bayesian Network, ID3, J48 and Neural Network Different performance measures are used to compare the results between these classifiers. The results shows that Bayesian Network classifier has the highest accuracy among the other classifiers.
Data Mining, Error Measurement, Accuracy, NaiveBayes, Bayesian Net, ID3, J48, Neural Network
Short address: https://sciup.org/15014990
IDR: 15014990
Text of the scientific article Analysis of Students' Performance by Using Different Data Mining Classifiers
-
I.I ntroduction.
Nowadays, data mining is playing a vital role in educational institutions and one of the most important areas of research with the objective of finding meaningful information from hisorical data stored in huge dataset. Educationl data mining (EDM) is a very imprtant research area which helpful to predict usful information from educational database to improve educational performance, better understanding and to have better assessment of the students learning process. EDM can be taken as one of the learning sciences and as a field of data mining [1][2][3]. EDM can be applied in modeling user knowledge, user behavior and user experience [4]. Data Mining or knowledge discovery has become the area of growing significance because it helps in analyzing data from different perspectives and summarizing it into useful information [5. Educational data mining uses many techniques such as decision trees, neural networks, k-nearest neighbor, naive bayes, support vector machines and many others [6]. One of the open source software designed for data analysis and knowledge discovering is WEKA (Waikato Environment for Knowledge Analysis)
-
[ 7]. Weka is an open source software system that implements a large collection of machine learning algorithms and is widely utilized in data mining applications. This paper focuses on using data mining techniques to predict and analyzie the students' performance and to find the highest accuracy between the five classifiers.
-
II .Related Work
Many research studies have been done in educational data mining to predict the students' performance. In [8] the Decision Tree (DT) algorithm was used to predict the performance of engineering students. Authors gathered data around 340 students to predict their performance in their first year exam. The accuracy of model generated was 60% in their training set. In [9] the authors used WEKA data mining software for the prediction of final student mark based on parameters in two different datasets. Each dataset contains information about different students from one college course in the past fourth semesters. The IBK shows the best accuracy among other classifiers. In [10] the author presented a reviews of previous research works done on students’ performance prediction, analysis, early alert and evaluation by using different methods of data mining. In [11] the authors measuring student performance using DT classification techniques and used artificial neural network to build classifier models. The work processed based on the several attributes to predict the performance of the students. Analyzing the weakness and strength of student which may be helpful to improve the performance in future. This finding indicates the effectiveness of using data mining techniques in course evaluation data and higher education mining. In [12] the authors represents a study that will be helped to the students and the teachers to improve the result of the students who are at the risk of failure. Information’s like Attendance, Seminar and assignment marks were collected from the student’s previous database, to predict the performance at the end of the semester. The authors used Naïve Bayes classification algorithm that shows a highest accuracy compared to other classification algorithms. The researchers in [13] conducted a comparative research to test multiple decision tree algorithms on an educational dataset to classify the educational performance of students. The study mainly focuses on selecting the best decision tree algorithm from among mostly used decision tree algorithms, and provide a benchmark to each one of them and found out that the Classification and Regression Tree method worked better on the tested dataset, which was selected based on the produced accuracy and precision using 10-fold cross validations. Researchers in [14] provided an overview on the data mining techniques that have been used to predict students performance and also it focused on how the prediction algorithm can be used to identify the most important attributes in a student's data. Under the classification techniques, Neural Network and Decision Tree are the two methods highly used by the researchers for predicting students performance. Authors in [15] applied Data Mining techniques to find and evaluate future results and factors which affect them. The analysis was performed by discovering the Association rules for the same using FP Growth Algorithm which were sorted by Lift Metric. This was followed up by Classification through Rule Based Induction Method.
-
III .Data Set and Description
The student's college database was used for the prediction students' performance by using different classification techniques. Dataset consist of 225 instance and each one consists of ten attributes. Table 1 shows the attributes with their description and values. The attributes were defined as follows:
MTs: midterms, two midterms are conducted in each semester. The midterms are added to calculate the student's results. Poor < 20%, Average >20% and < 30%, Good > 30%.
Act: Activity performance, four assignments are given in each semester. It is divided into two classes , Yes [Submitted], and No [Not submitted].
StAtt: Student attendance, 70 percent attendance is mandatory to participate in final examination, but students with a specific cases with low attendance can participate in final examination. Student attendance is divided into three classes. Poor < 60%, Average > 60 % and < 80 %, Good > 80 %.
Sem: Seminar performance, seminars are conducted to examine students performance depends on student's presentation and communication skills. It has three classes. Poor [ both presentation and communication skills are low], Average [Either presentation is perfect or communication skills is perfect], Good[ both presentation and communication skills is perfect].
LabE: Lab experiments, it has two classes, either student completed his experiments [Yes] or not completed his experiments [No].
OAP: Office Automation Project, one project at the end of semester. It divided into two classes. [Yes] if student submitted the project, [No] if student not submitted the project.
FE: Final Examination, one final exam at the end of semester. It divided into three classes. Poor < 15 %, Average > 15% and < 25 %, Good > 25 %.
WS : Workshop, student participation in workshop conducted by university. It divided into two classes. Participate in workshop [Yes] and [No] if the student not participate in workshop.
PSFM: Previous Semester Final Mark, it is the total evaluation of student in the previous semester, it divided into four classes. HA (high average) > 85 %, A
(Average) > 70 % and < 84 %, P (Poor) > 60 % and < 69 %, F (Fail) < 60 %.
FM: Final Mark, it is the total evaluation of student in semester, it divided into four classes. HA (high average) > 85 %, A (Average) > 70 % and < 84 %, P (Poor) > 60 % and < 69 %, F (Fail) < 60 %.
Table 1. Data description and values
|
Attribute |
Description |
Values |
|
MTs |
Midterms |
Poor, Average, Good |
|
Act |
Activity |
Yes, No |
|
StAtt |
Student Attendance |
Poor, Average, Good |
|
Sem |
Seminar |
Poor, Average, Good |
|
LabE |
Lab Experiments |
Yes, No |
|
AOP |
Office Automation Project |
Yes, No |
|
FE |
Final Examination |
Poor, Average, Good |
|
WS |
Workshop |
Yes, No |
|
PSFM |
Previous Semester Final Mark |
HA > 85 %, A > 70 % and < 84 %, P > 60 % and < 69 %, F < 60 %. |
|
FM |
Final Mark |
HA > 85 %, A > 70 % and < 84 %, P > 60 % and < 69 %, F < 60 %. |
-
IV .Data Mining Classification
Classification is a data mining task that divides data sample into target classes. This techniques based on supervised learning approach which having known class categories and it is used two methods , binary and multilevel. Dataset are partitioned as training and testing dataset and the classifier is trained by using training dataset. The correctness of classifiers could be tested using test dataset. Classification is a data mining task that divides data sample into target classes. This techniques based on supervised learning approach which having known class categories and it is used two methods , binary and multilevel. Dataset are partitioned as training and testing dataset and the classifier is trained by using training dataset. The correctness of classifiers could be tested using test dataset. The major algorithms for classification are Naive Bayes, BayesNet, ID3, C4.5(J48) and Neural Network (MLP).
-
3 GradesFilel - Notepad — □
File Edit Format View Help
@RELATION GradesFilel
@ATTRIBUTE mis {Good,Average,Poor} @ATTRIBUTE act {Yes,No}
@ATTRIBUTE statt {Yes,No} @ATTRIBUTE sem {Yes,No} @ATTRIBUTE labe {Yes,No} @ATTRIBUTE oap {Yes,No} @ATTRIBUTE fe {Good,Average,Poor} @ATTRIBUTE ws {Yes,No} @ATTRIBUTE fs-Fm {HA,A,P,F} @ATTRIBUTE fm {HA,A,P,F}
@DATA
Good,Yes,Yes,Yes,Yes,Yes,Good,Yes,HA,HA Good,Yes,Yes,No,Yes,Yes,Good,Yes,HA,HA Average,Yes,Yes,Yes,No,Yes,Average,Yes,A,A Average,Yes,Yes,No,Yes,No,Good,No,A,A Good,Yes,Yes,No,No,Yes,Average,Yes,A,A Average,Yes,No,Yes,No,No,Poor,No,P,P Good,No,Yes,No,Yes,Yes,Poor,No,P,P Poor,No,Yes,Yes,Yes,No,Poor,Yes, F,F Average,No,Yes,No,Yes,No,Poor,No,F,F
Fig.1. Data Sample in arff
WEKA has different types of classification algorithms. This section will perform the implementation of five algorithms, Naive Bayes, BayesNet, ID3, J48 and Neural Network under 10 fold cross validation in WEKA tool.
-
A. Naive Bayes Classifier
Naive Bayes is a simple classifier and used for probabilistic learning and it shows a great performance in terms of accuracy when attributes are independent.
-
B. BayesNet Classifier
BayesNet or Bayesian Network is a graph description of conditional probabilities. It represents random attributes and conditional dependencies using a direct graph and nodes represent random variables. Bayesian Network makes computation process easier and better speed and accuracy for huge database.
-
C. ID3 Classifier
ID3 ( Iterative Dichotomiser 3) algorithm is used for building decision tree from dataset. It was invented by Ross Quinlan. ID3 uses entropy and information gain to construct a decision tree. The algorithm builds the fastest tree but introduced a short tree and only needs to test enough attributes until all data is classified, and for making a decision it tested only one attribute at a time.
-
D. C4.5 (J48) Classifier
This algorithm is developed by Ross Quinlan and it is an extension of ID3 algorithm. It Used to generate decision tree which is generated by C4.5 algorithm and it is often referred to as a statistical classifier.
-
E. Neural Network (NN) Classifier
Neural Network or Multilayer Perceptron (MLP) algorithm. It was developed in the early of 20th century. In NN, the basic elements are neurons or nodes and these are interconnected within the network they work together in parallel in order to produce the output function. The NN is an adaptive in nature because it changes its structure and adjust its weight in order to minimize the error.
V.WEKA tool and pre-processing
WEKA is graphical user interface (GUI), it's an open source software developed at Waikato University in New Zealand. It contains four applications; explorer, experimental, knowledge flow and the command line interface(CLI) and also contains tools for data preprocessing, classification, clustering, regression and visualization.
The pre-processing is an important step that is used to extract and improve the quality of data. WEKA tool import dataset from a proper file like attribute relation file format which is the preferable one. Figure 2 and Figure 3 show the output of data pre-processor and model visualization in WEKA, respectively.
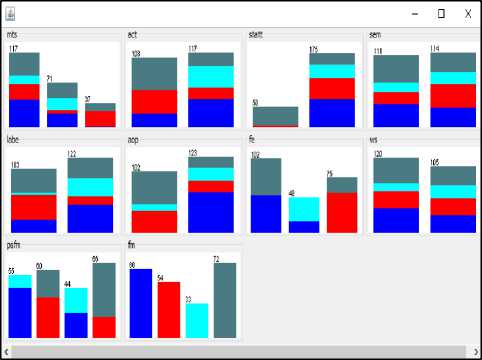
Fig.2. Data Pre-processor Output
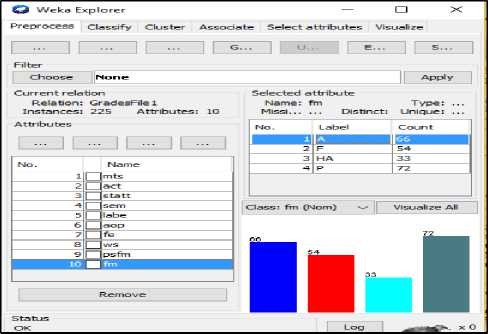
Fig.3. Model Visualization
Different measures are used in predictive classification techniques accuracy, which refers to the ability of the model to correctly predict the class label of new or previously unseen data. Other evaluation criteria are used such as speed, scalability, robustness and simplicity to determine the algorithm accuracy. This section explains different error measures used to evaluate classification techniques.
-
A. Mean Absolute Error (MAE)
This error measures the average of the absolute value of the difference between the predicted and actual values. The MAE is denoted by the following formula:
n
MAE = E ™(1) i=1 n where a is an actual value and p is a predicted value.
-
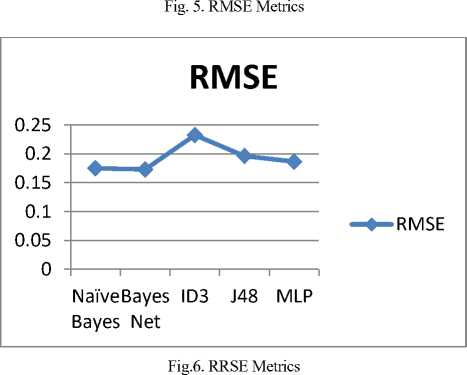
B. Root Mean Sequared Error (RMSE)
This error used to measure the difference between the predicted and actual value. It is the standard deviation of the prediction errors. It denoted by the following formula:
VII.Determining the classification Accuracy
Accuracy is defined as the proportion of correct classification from overall number of cases and it depends on confusion matrix. Table 2 shows the confusion matrix that illustrates the number of correct and incorrect predictions made by the classification model compared to the actual value.
Table 2. Confusion matrix
|
Confusion Matrix |
Actual (Target) |
||
|
Predicted a |
Predicted b |
||
|
Model |
True a |
TP |
FN |
|
True b |
FP |
TN |
|
True positive (TP) is the positive instances predicted as positive. False positive (FP) is the negative instances predicted as positive. False negative (FN) is the positive instances predicted as negative. True negative (TN) is the negative instances predicted as negative. From Table 2, the TP rate, FP rate, precision, recall, F-measure and accuracy can be calculated.
-
A. True Positive Rate (TP Rate)
TP rate or sensitivity measures the proportion of positives that are correctly identified.
TP
TP rate , Sens-t-v-ty =--------- TP + FN
where p ^ is the predicted value and p is the modeled value.
C. Relative Absolute Error (RAE)
Is the ratio of dividing the absolute error by the magnitude of the exact value. The absolute error is the difference between the actual value and individual measured value. The RAE denoted by:
n
El p. - a -\
RAE = ^------ (3)
E|a - ail i=n
-
B. False Positive Rate (FP Rate)
FP rate is the proportion of negative that are correctly identified rate, FP =
FP
TN + FP
-
C. Precision and Recall
Precision is the proportion of correct classification from cases that are predicted as positive, whereas recall is the proportion of correct classification from cases are actually positive. Multiple measurements need to be taken to determine precision and recall.
where p j is the predicted value, ais the actual value and a is the mean of actual value.
Precision, P =
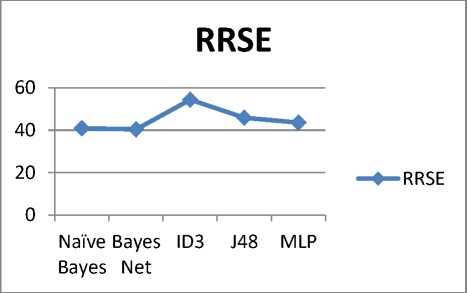
D. Root Relative Squared Error (RRSE)
Is a relative to what the error would have seen if the average of the actual values had been used. RRSE denoted by the following formula:
Recall, R =
TP
TP + FP
TP
TP + FN
n
E( b-- a.)
RRSE = -------T (4)
n2
E( a- — a)
I i = 1
-
D. F-Measure
Is a variant of accuracy not effected by negative, it's denoted by the following formula:
2 PR
where P is the precision and R is the recall.
-
E. Accuracy
It is the closeness of a measurement to the actual value of what is being measured. Only one measurement needs to be taken to determine accuracy.
TP + TN
Accuracy =------------------ (10)
TP + FN + FP + TN
VIII.Experimental Results and Discussion
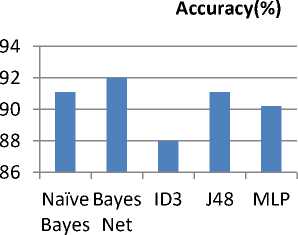
The experimental results and discussion have done on selecting 225 instance. Five selected classification algorithms were used; Naive Bayse, Bayesian Net, ID3, J48 and Neural Network and each one has its own characteristics to classify the data set. Table 3 shows performance results of all classifiers by using WEKA, and Figure 4 shows the accuracy performance of classification techniques.
Table 3. Performance result
Accuracy(%)
Table 4. represents the error measures of all classifiers, it shows that Bayesian Network has the a minimum error based on RMSE and RRSE among other classifiers.
Table 3 shows the performance accuracy of the five classifiers based on different classification metrics. These metrics are; (TP), (FP), Precision, Recall and F-measure measure are very important to determine the classifiers based on the accuracy. These metrics shows that Bayesian Network classifier performs better than other classifiers.
Fig.4. Classifiers Accuracy Performance
In table 3, the Bayesian Network classifier has more correctly classified instances than other classifiers, which is usually referred to the best accuracy model. The graphical representation in Figure 4 shows that the best classifier of students' performance based on their dataset is the Bayesian Network classifiers. In the result, Bayesian Network has an efficient classification among other classifiers.
Figure 5 and Figure 6 below show the analysis of all
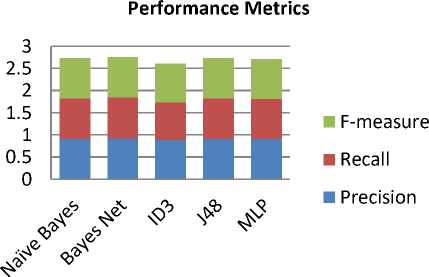
Fig.7. Classifiers Performance Metrics
In Figure 7 Precision, Recall and F-measures analyzed of Bayesian Network outperforms other classifiers. among all classifiers. It shows that the weighted average
Table 4. Error measures in weka
|
Criteria |
Data Mining Classifiers |
||||
|
Naive Bayes |
Bayesian Network |
ID3 |
J48 |
Neural Network (MLP) |
|
|
Mean Absolute Error (MAE) |
0.0691 |
0.0645 |
0.0562 |
0.0605 |
0.0531 |
|
Root Mean Squared Error (RMSE) |
0.175 |
0.1729 |
0.2324 |
0.1962 |
0.1865 |
|
Relative Absolute Error (RAE) |
18.8452 |
17.5924 |
15.3921 |
16.4984 |
14.4796 |
|
Root Relative Squared Error (RRSE) |
40.8761 |
40.3966 |
54.3977 |
45.8466 |
43.5654 |
Table 5. Weighted average of class label accuracy
|
Classifier |
True Positive (TP) |
False Positive (FP) |
Precision |
Recall |
F-measure |
|
Naive Bayes |
0.911 |
0.032 |
0.911 |
0.911 |
0.911 |
|
Bayesian Network |
0.92 |
0.029 |
0.92 |
0.92 |
0.92 |
|
ID3 |
0.884 |
0.038 |
0.884 |
0.884 |
0.884 |
|
J48 |
0.911 |
0.028 |
0.914 |
0.911 |
0.912 |
|
Neural Network (MLP) |
0.902 |
0.032 |
0.904 |
0.902 |
0.903 |
IX.Conclusion
Data mining has a significant importance in educational institutions. The obtained knowledge with the use of data mining techniques can be used to make successful and effective decisions that will improve and progress the student's performance in education. Data set contains of 225 instance and ten attributes. Five classifiers are used and the comparisons are made based on the accuracy among these classifiers and different error measures are used to determine the best classifier. Experiments results show that Bayesian Network has the best performance among other classifiers. In future work, more dataset instance will be collected and will be compared and analyzed with other data mining techniques such as association and clustering.
References Analysis of Students' Performance by Using Different Data Mining Classifiers
- M. Goyal and R. Vohra, “Applications of Data Mining in Higher Education”, IJCSI International Journal of Computer Science Issues, Vol. 9, Issue 2, No 1, March 2012.
- R. Huebner, “A survey of educational data mining research”, Research in Higher Education Journal, 2012.
- M.S. Mythili, A.R. Mohamed Shanavas, “An Analysis of students’ performance using classification algorithms”, IOSR, Journal of Computer Engineering, Volume 16, Issue 1, January 2014.
- S. Lakshmi Prabha, A.R.Mohamed Shanavas, “Educational data mining applications”, Operations Research and Applications: An International Journal (ORAJ), Vol. 1, No. 1, August 2014.
- C. Romero, S. Ventura and E. Garcia, "Data mining in course management systems: Moodle case study and tutorial", Computers & Education, vol. 51, no. 1, 2008, pp. 368-384
- S. Ayesha, T. Mustafa, A. Sattar and M. Khan, “Data mining model for higher education system”, Europen Journal of Scientific Research, vol.43, no.1, 2010. pp.24-29.
- Weka: Data Mining Software in Java, University ofWaikato,[Online].Available: http://www.cs.waikato.ac.nz/ml/index.html.
- Z. J. Kovacic, “Early prediction of student success: Mining student enrollment data”, Proceedings of Informing Science & IT Education Conference (InSITE) 2010.
- I. Milos, S. Petar, V. Mladen and A. Wejdan, Students’ success prediction using Weka tool, INFOTEH-JAHORINA Vol. 15, March 2016. 684.
- P. Kavipriya, A Review on Predicting Students’ Academic Performance Earlier, Using Data Mining Techniques, International Journal of Advanced Research in Computer Science and Software Engineering, Volume 6, Issue 12, December 2016 ISSN: 2277 128X.
- N. Ankita, R. Anjali, Analysis of Student Performance Using Data Mining Technique, International Journal of Innovative Research in Computer and Communication Engineering, Vol. 5, Issue 1, January 2017.
- P. Shruthi, B. Chaitra, Student Performance Prediction in Education Sector Using Data Mining, International Journal of Advanced Research in Computer Science and Software Engineering, Volume 6, Issue 3, March 2016.
- S.K Yadav, B. Bharadwaj, and S. Pal, 2012. Data Mining Applications: A Comparative Study for Predicting Student’s Performance. International Journal of Innovative Technology & Creative Engineering (ISSN: 2045-711), Vol. 1, No.12, December.
- A.Mohamed Shahiria,, W. Husaina , N. Abdul Rashida, "A Review on Predicting Student’s Performance using Data Mining Techniques" Procedia Computer Science 72 ( 2015 ) 414 – 422, ELSEVIER.
- K. Kohli and S. Birla, " Data Mining on Student Database to Improve Future Performance", International Journal of Computer Applications (0975 – 8887), Volume 146 – No.15, July 2016.
