Analysis of the Functional Relationship between Electrocardiographic Signal and Simultaneously Acquired Respiratory Signals

Author: Shikha Thakur, Rakesh Kumar Saxena
Journal: International Journal of Image, Graphics and Signal Processing(IJIGSP) @ijigsp
Article in issue: 9 vol.7, 2015.
Free access
Clinically, ECG is a potential tool used in the applications evaluating electrical activities of heart, functioning and providing solution to problems associated with it. Among such, the relationship (correlation) between respiration and electrocardiographic signal has attracted attention in past decades. In this research, a Welch spectrum estimation approach was utilized for normalizing cross spectrum analysis between these two signals. This approach can be useful while diagnosing diseases like pulmonary embolism, coronary lung diseases, Deep vein thrombosis and other diseases related to heart, from the knowledge of existing coherence bonding between these signals. This research applies the above approach to human subjects, whose ECG and respiratory signal annotations has been evaluated and were sampled at 100 samples/ second (sampling rate). The different respiratory signals are taken from Chest (CRSP), abdominal (ARSP) and oronasal regions (NRSP). The annotated signals for all the four subjects, discussed in this paper were obtained through a non-invasive test, which is medically well known as impedance phlebography, or impedance plethysmography. The numbers of samples, under the analysis were 6000 for each signal. The data was acquired from recording database of physionet. For this examination the mean square coherence (MSC) was chosen as an excellent candidate. The results imply that the mean of MSCs is found continuously decreasing in chest respiration. Secondly, the results showed maximum coherence between ECG and corresponding respiratory signal in three subjects is in Abdominal (ARSP) region (i.e. having maximum value greater than 0.5). Lastly, above analysis was analyzed over the fourth subject's data and under observation it was found, exceptionally that, the value of coherence for all respiratory patterns showed a poor functional association or simply coherence between the signal i.e.Coh2 below 0.5 in the abdominal region (ref.Fig.5) and the reason suggested could be chronic lung disease while the results show higher values, that is between (0.5 < coherence <1) in other two. Further, we show that the coherence peak reflects that the one physiological signal is synchronized with another signal of same nature at a particular frequency, here it is 0 to 35 Hz frequency band and combined analysis is shown through a Boxplot, from three regions showing maximum value of coherence upper quartile in abdominal region for three healthy subjects with maximum value of peak in the same region. This paper also presents a platform to dissolve the problem pertaining in an individual related to deep vein thrombosis, hypoxemia (blood level <90%) [16] and related diseases by estimating the coupling associated between saturated oxygen content (SO2) with respiratory patterns, in order to detect dysfunctioning clinically, also for efficient heart working. Thus, the research shows successful attempt to investigate the interaction of the PS of ECG signal and respiratory signals. The work presented in this paper can further be extended by adopting different method and either by defining a vector array element for maximum number of coherence value that could be beneficial for detecting diseases like sleep apnea on basis of minimum or maximum occurrence of peaks.
ECG, cross spectrum, mean square coherence, power spectrum, correlation
Short address: https://sciup.org/15013907
IDR: 15013907
Text of the scientific article Analysis of the Functional Relationship between Electrocardiographic Signal and Simultaneously Acquired Respiratory Signals
Published Online August 2015 in MECS
The electrocardiographic signal medically termed as ECG is a representative signal containing information about the condition of the heart and is a muscular organ in all vertebrates responsible for pumping blood through the blood vessels by repeated, rhythmic contractions.
An electrical impulse from the SA node travels through the muscle fibers of the atria and ventricles, causing them to contract. From decades, many advances has been taking position in the direction to cure any kind of heart disease and finding this functioning associated with the organs of body. It can be said shortly, that ECG may be considered as a potential tool in clinical applications. Careful study of the ECG data may give the measure of heart’s condition and its association with different physiological systems and among such, the relationship between respiration and ECG signal may be used to quantify the respiration state. Heart rate and respiratory rate are two important vital signs and are of great importance when critically ill adults and newborn infants are monitored. The respiratory activity influences electrocardiography measurements in various ways, and can be separate in two types: that which affect beat morphology and that affecting heart rate variability [12]. Therefore, the measurement and monitoring of respiration is important in order to check the respiration rate and breathing health.
Clinically monitoring of heart rate is generally performed by counting QRS complexes of the ECG per time unit [15]. Clinically monitoring of respiration rate is done through impedance plethysmography [15].
There are many several reasons to study interrelationship between these signals, example for cardiac arrhythmias, apneas, lung water content, lung diseases, tachapneas, and hypoxemia. An earlier study found that only 33% of people presenting to an emergency department with oxygen saturation below 90% had an increased respiratory rate [16].
Therefore, this paper outlines a scheme for providing reliable detection of functional association of heart impulses with simultaneously acquired respiratory signals from three different regions by MSC estimate using Welch’s method. It indicates how signal say X corresponds to another signal, Y at each frequency of same length. Cross spectrum is an important issue for any physiological signal for detection of its correlation with other signal or organ in human body. Most of the reported work is dedicated to techniques of signal processing which derives respiratory waveforms from ordinary ECGs, called as an EDR [1-7].
The overall organization of the paper is as follows. Section II describes the methodology adopted and materials acquired for the analysis. Section III demonstrates the results and evaluates the performance of each signal computed and conclusions are finally presented in the section IV which tells the advantages of this work. Some other future works in this field has been proposed in this part too.
-
II. Material And Methodology
-
A. Database preparation
Four subject’s ECG and respiratory signal were extracted from a larger database of simultaneously recorded polysomnogram measurements approximately 8
hours duration. All signals are sampled at 100 samples/ second (sampling rate), with 16 bit resolution. The different respiratory signals are taken from Chest region (for simplicity abbreviated as C), abdominal (abbr. as A) and oronasal (abbr. as N) region. The average age of subjects was between 27 and 63 years. Each segment was annotated on the basis of respiration and oxygen saturation signals using amplitude criterion for airflow and desaturation at any time during one minute recording, approximately for 8 hours duration [17].
-
B. Signal analysis and Methodology
Coherence is the degree of relationship or association of frequency spectra between the ECG and Respiratory signals at a particular frequency band. The signal analysis was executed after the data acquisitions was done by correlation process and using power spectrum analysis on ECG and corresponding acquired respiratory signals. The source code for mean square coherence estimated was developed in MATLAB 7.9.0 for programming and deriving conclusion.
The cross correlation function of two series is expressed by the equation (1),
(V)=lim т → -Тт ∫ ⁄ ⁄ 2Х ( t ) У ( t +v) dt (1)
Where x (t) and y (t) are the values of two time series x and y at time t, and v is the time lag of x (t) with respect to y (t). Here, x (t) is the signal to be evaluated, and y (t) is the reference for the cross-correlation. Coherence measures coupling between components of same frequency in different recordings made simultaneously. In order to express the time series in discrete form the formula for the cross-correlation thus becomes
()= ∑n=0 (и)У(п+У )(2)
The Fourier transformation of the cross-correlation function yields the cross-spectral density function, the cross-spectrum which is expressed as
^ху (/)=∫-ОО Тху (V) е j2nfv^v(3)
The MSC between any two signals say, x (ECG Signal) and y (respiratory signal) can be given as,
Соℎ2= (/)= | ( f-(4)
()( )
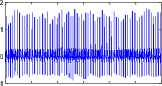
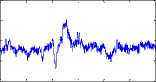
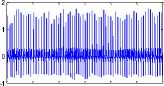
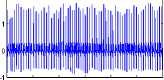
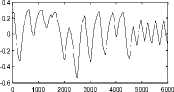
Where P xy (f) is a complex value and consists of a real valued function R xy (f) and an imaginary Q xy (f), respectively and P xx (f) and P yy (f) are power densities of x signal and y signal [9]. The respiratory and ECG signal (first subject) are shown in Fig. 1.The coherence value is the relevant degree between two signals in a frequency ω. When two signals have a maximum correlation, Coh2 is 1, and when two signals have no relevancy, Coh2 is 0.
The cross spectrum of Pxy (f) can also be shown as,
Рху (/)= Rxy (/)– jQxy ( f ) (5)
0 1000 2000 3000 4000 5000 6000
0.4
0.2
-0.2
-0.4
0 1000 2000 3000 4000 5000 6000
0 1000 2000 3000 4000 5000 6000
0 1000 2000 3000 4000 5000 6000
0 1000 2000 3000 4000 5000 6000
No. of samples taken of ECG signal (e)
0.5
-0.5
No. of samples taken of respiratory pattern (f)
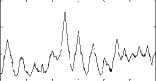
Fig.1. ( a), (c), (e) Represents ECG signal of subject 1 and (b), (d), (f)represents simultaneously acquired respiratory signal from chest region, abdominal region, oronasal respiratory signal.
When the cross spectrum value is low, the coherence is meaningless. Therefore, the threshold of the cross spectrum defines the range of the coherence value [9].
In order to analyze the degree of phase induced by one signal over another the phase difference is expressed as,
9 xy (f = tan 1
f Q xy (f 1 [ R xy (^
The coherence value and phase coherence were calculated on the ECG signal and corresponding respiratory signal from three different regions.
III. Results And Discussion
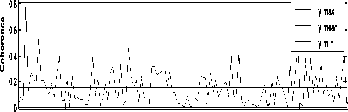
The coherence between the electrocardiographic and simultaneously acquired respiratory signal from chest, abdominal and oronasal region for four subjects was analyzed to evaluate their relationships in frequency domain. Fig. 2 shows the coherence analysis results for first subject for all three prominent regions.
As is implied in Fig. 2(a), the mean of coherence is found to be 0.1448 in the frequency band (0 – 35 Hz) and maximum coherence is 0.8118 near the frequency 16 Hz. There are another two coherence peaks found near the frequency range of 15 to 23Hz. The result for oronasal region for same subject is shown in Fig. 2(b), the mean of coherence is found to be 0.1742 and maximum coherence is 0.5754 near the frequency 26-30Hz. There are another two coherence peaks found near the frequency range of 27 to 30Hz. The MSC depicts that high coherence exists between ECG and respiratory abdominal pattern maximum coherence of 0.8118 near the frequency 01 Hz and the mean of coherence is 0.1562 in the same band.
Standard deviation is generally increasing continuously in the coherence between ECG and Respiratory signals from the Chest (C), Oronasal (N) to the abdominal (A). The list of various parameters determined is given in Table 1.
Table 1. Coherence and phase coherence measure parameters for first subject
|
Signals |
Paramete rs |
Max |
Min |
Mean |
Std |
|
ECG and Chest signal ( C) |
Coherenc e |
0.5518 |
0.00023 |
0.1448 |
0.1305 |
|
Phase coherenc e |
1.516 |
-1.563 |
-0.0137 |
0.882 |
|
|
ECG and abdomi nal signal (A) |
Coherenc e |
0.8118 |
0.00112 |
0.1562 |
0.1305 |
|
Phase coherenc e |
1.57 |
-1.545 |
-0.0224 |
0.9113 |
|
|
ECG and oronas al signal (N) |
Coherenc e |
0.5754 |
0.00180 |
0.1742 |
0.1312 |
|
Phase coherenc e |
1.571 |
-1.569 |
0.02731 |
0.886 |
frequency band (Hz)
0 5 10 15 20 25 30 35
frequency band (Hz) (b)
abdominal
0 5 10 15 20 25 30 35
frequency band
Fig.2. (a) Coherence between ECG and Respiratory signal of Chest in frequency band (0 to 35Hz), (b) Coherence between ECG and Respiratory signal of oronasal region, (c) Coherence between ECG and Respiratory signal of abdominal.
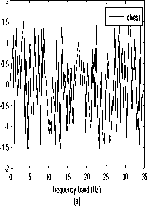
The results of the coherence phase for the same subject are demonstrated in Fig. 3 for all three regions where Fig. 3(a) and Fig. 4(b) implies that ECG signals leads the respiratory signal (as is < 0) for chest and oronasal region and lags in abdominal region.
1.5
0.5
-0.5
-1
-1.5
-2
1.5
0.5
-0.5
-1
-1.5
-2
0 5 10 15 20 25 30 35
frequency band(Hz) (b)
0 5 10 15 20 25 30 35
frequency bnd(Hz)
(c)
Fig.3. (a) Coherence phase between ECG and Respiratory chest pattern in frequency band (0 to 35Hz), (b) Coherence phase between ECG and Respiratory oronasalsignal, (c) Coherence phase between ECG and Respiratory abdominal signal.
Table 2. Coherence and phase coherence measure parameters for second subject
|
Signals |
Parameters |
Max |
Min |
Mean |
Std |
|
ECG and Chest Signal ( C) |
Coherence |
0.7922 |
0.02278 |
0.1587 |
0.1476 |
|
Phase coherence |
1.57 |
-1.532 |
0.09688 |
0.9277 |
|
|
ECG and abdominal signal (A) |
Coherence |
0.5336 |
0.00097 |
0.1769 |
0.1364 |
|
Phase coherence |
1.553 |
-1.538 |
0.06189 |
0.9078 |
|
|
ECG and oronasal signal (N) |
Coherence |
0.657 |
0.00212 |
0.1589 |
0.1297 |
|
Phase coherence |
1.548 |
-1.558 |
0.01189 |
0.8733 |
Similarly, the coherence analysis of second subject is plowed in Fig.(4). The maximum mean value and coherence value was found to be 0.156 and 0.0798 respectively. The peaks of occurrence of coherence in chest region were found one between 10Hz to 13Hz and other around 6 Hz as depicted in Fig. 4(a). For oronasal and abdominal regions also the coherence was found near around 0.6 and 0.56 (refer to Fig. 4(b) and 4(c)).
The results of phase coherence existing between the two signals for second subject are shown in Fig. (5), with the same order arranged in Fig. (4). from these plots it can be answered that which signals leads or lags with the other. Since, the phase is greater than zero it implies that the ECG signals leads the respiratory signal. The detailed list of parameters is given below under Table 2.
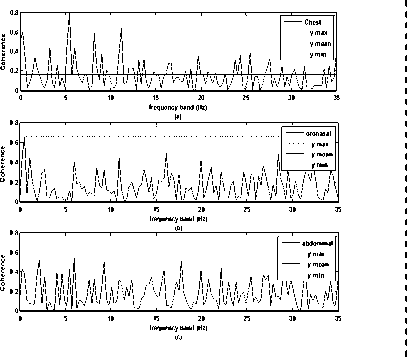
Fig.4. (a) Coherence between ECG and Respiratory signal of Chest in frequency band (0 to 35Hz) (b) Coherence between ECG and Respiratory signal of oronasal region (c) Coherence between ECG and Respiratory signal of abdominal of second subject.
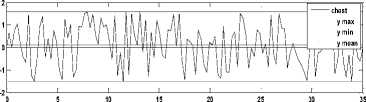
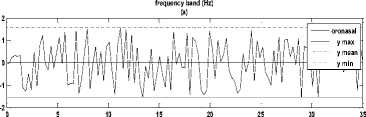
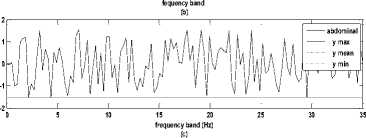
Fig.5. (a) Coherence phase between ECG and Respiratory Chest pattern in frequency band (0 to 35Hz), (b) Coherence phase between ECG and Respiratory oronasal signal, (c) Coherence phase between ECG and Respiratory abdominal signal.
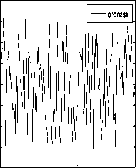
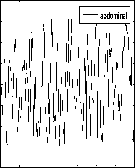
Almost similar results are derived for third and fourth subjects. The only exception is that very low coherence is found in results of fourth subject that is in abdominal region i.e. below 0.5 values. It is implied from Fig.6 (a) the mean of coherence is found to be 0.1394 and maximum coherence is 0.7296. In Fig. 6(b) the mean of coherence is found to be 0.1636 in the frequency band (0 – 35 Hz) and maximum coherence is 0.6041 near the frequency 2.5 Hz for oronasal pattern. It is seen in Fig. 6 (c) the maximum coherence between two signals is 0.4 (which is smaller than i.e. < 0.5) for abdominal region which depicts that there is very poor relation between the two signals. The reason may be that the subject may be having chronic lung disease. Thus, if one needs to find the relationship between two signals of physiological nature there coherence analysis of mean and maximum value can suggest the criterion to detect the affecting organ/region in human body (as evident in Figure 6).
0.8
0.6
0.4
0.2
0 5 10 15 20 25 30 35
frequency band (Hz)
(a)
0.8
0.6 - I
00..24 ?i'\Mi^A:J
0I__2__U ^l
0 510
0.8
0.6
0.4J
0.2
u^yV^, VV
0 510
oronasal
15 20 25 30 35
frequency band (Hz)
(b)
I abdominal
15 20 25 30 35
frequency band(Hz)
(c)
Fig.6. (a) Coherence between ECG and Respiratory chest signal in frequency band (b) Coherence between ECG and Respiratory oronasal signal in frequency band (c) Coherence between ECG and Respiratory abdominal signal in frequency band (0 to 35Hz).
Combined analysis of three subjects by box plots:
Box plots are utilized to find the maximum number of coherence peak occurrence within the coherence coefficient range and respective maximum values of coherence and median for each region. As it is depicted that upper quartile is around 0.5 for each region and maximum occurrence of coherence is found in chest region (shown as + sign). Although the maximum coherence values are observed in abdominal region having value around 0.8 (refer Fig. 7).
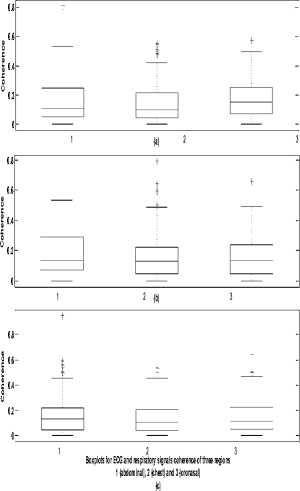
Fig.7. Box plot of coherence between ECG and corresponding three respiratory signals
Relationship between oxygen saturation level and respiratory signals:
Oxygen saturation is a term referring to the concentration of oxygen in the blood. The human body requires and regulates a very precise and specific balance of oxygen in the blood. Normal blood oxygen levels in humans are considered 95-100 percent. If the level is below 90 percent, it is considered low resulting in hypoxemia. Blood oxygen levels below 80 percent may compromise organ function, such as the brain and heart, and should be promptly addressed. It could prove to be effective candidate to detect diseases like pulmonary embolism which can cause heart damage and blockage. Continued low oxygen levels may lead to respiratory or cardiac arrest. In order to function properly, body needs a certain level of oxygen circulating in the blood to cells and tissues. When this level of oxygen falls below a certain amount, hypoxemia occurs and one may experience shortness of breath.
Therefore, it becomes essential to estimate the relationship shared by these two signals which can further be useful for heart working efficiency. Coherence (efficient values <0.5) between oxygen saturation level (SO2) and Respiratory signal acquired from three prominent regions named as the Chest (C), Abdominal (A) and Oronasal (N) is investigated as:
0.8
0.7
0.6
0.7
oronasal
0.6
0.5
chest y min y max y mean y min y max y mean
0.5
0.4
0.3
0.2
0.1
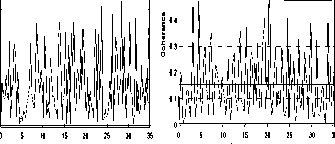
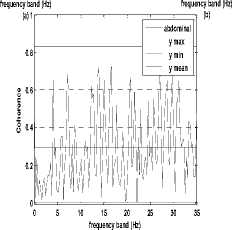
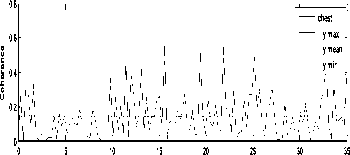
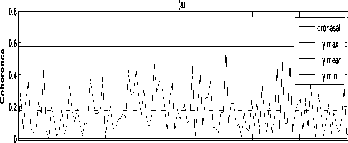
Fig.8. (a): Coherence between SO2 and Respiratory signal (abbr. as C) in frequency band (0 to 35Hz), (b) Coherence between SO2 and Respiratory oronasal signal (abbr. as N) in frequency band (0 to 35Hz), (c) Coherence between SO2 and Respiratory signal (abbr. as A) in frequency band (0 to 35Hz)
Table 3. Coherence parameters between SO2 and respiratory signals for first subject
|
Signals |
Parameters |
Max. |
Mean |
Min. |
Std. |
|
ECG and Chest signal ( C) |
Coherence |
0.7455 |
0.1819 |
0.00625 |
0.1465 |
|
ECG and abdomin al signal (A) |
Coherence |
0.8285 |
0.2935 |
0.00265 |
0.2059 |
|
ECG and oronasal signal (N) |
Coherence |
0.675 |
0.1537 |
0.03886 |
0.1203 |
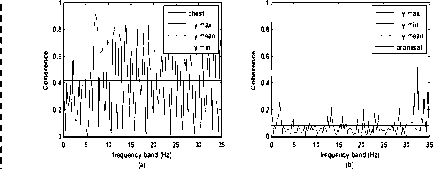
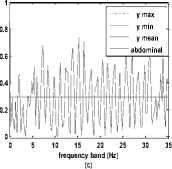
Fig.9. (a)Coherence between SO2 and Respiratory signal (abbr. as C) in frequency band (0 to 35Hz), (b) Coherence between SO2 and Respiratory oronasal signal (abbr. as N) in frequency band (0 to 35Hz), (c) Coherence between SO2 and Respiratory signal (abbr. as A) in frequency band (0 to 35Hz)
-
IV. Conclusion
This research evaluates the coherence and cross correlation and phase coherence between the ECG and Respiratory signal acquired from three different regions of human body and secondly estimates the relation in frequency domain between blood saturation level and respiratory patterns. The Welch’s method was used for computation of the mean square coherence parameters. The coherence and phase coherence analysis results are demonstrated and the results show that they are coherent (MSQ greater than 0.5) at respiratory frequency and observing the cross relation between these signals one can detect disease like lung diseases, hypoxemia, apnea, cardiac arrhythmias etc. In addition , existence of maximum number of coherence peaks are analyzed and are seen maximum occurrence in chest region, but the highest peak values were seen in abdominal, through box plots.
It has been shown that coherence cross spectrum is sensitive and specific to the respiratory signal taken from three different regions. Besides, different method or approach, which has not been used in the present work, can be used to analyse and study these signals relation. One can acquire other signal corresponding to respiratory signal and electrocardiogram. Another approach that can be performed is to examine comparative analysis on these signals with either by Burg method (parametric methods), covariance method, spectral estimation etc. for predicting cross spectrum and power estimation.
References Analysis of the Functional Relationship between Electrocardiographic Signal and Simultaneously Acquired Respiratory Signals
- George B. Moody, Roger G. Mark, Andrea Zoccola, and Sara Mantero, "Derivation of Respiratory Signals Multi-lead ECGs", Massachusetts Institute of Technology, Computers in Cardiology, Washington, IEEE Computer Society Press, 1985.
- Douglas A. Newandee, M.S., Reisman," Measurement of EEG coherence in Group Meditation, IEEE Computer society, pp.7803-3204, 1996.
- N. Saiwaki, H. Tsujimoto, S. Nishida and S. Inokuchi, "Directed Coherence Analysis of EEG recorded during music listening", 18th Annual International Conference of the IEEE Engineering in Medicine and Biology Society, 1996.
- Yan Xu, Simon Haykin, Fellow, IEEE, and Ronald J. Racine," Multiple Window Time-Frequency Distribution and Coherence of EEG Using Slepian Sequences and Hermite Functions", IEEE Transactions on biomedical engineering, vol. 46, no. 7, July 1999.
- JE Mietus, C-K Peng, PCh Ivanov, AL Goldberger ,"Detection of Obstructive Sleep Apnea from Cardiac Interbeat Interval Time Series", Harvard Medical School, Boston, USA, Computers in Cardiology, vol. 27, pp. 753-756, 2000.
- Ta-Hsin Li, Ta-Hsin Li," Detection of Cognitive Binding During Ambiguous Figure Tasks by Wavelet Coherence Analysis of EEG Signals, IEEE 2000.
- Dr. David Rapoport, Robert Norman, Michael Nielson, "Nasal Pressure Airflow Measurement", Pro-Tech Services, Inc., 2001.
- B. Schack', G. Seide12, Heinrich3, U. Krause',"Coherence analysis of the ongoing EEG by means of microstates of synchronous oscillations", Proceedings of the 23rd Annual EMBS International Conference, pp. 25-28, Istanbul Turkey, October 2001.
- Minfen Shen, Xianhui Li and Xinjun Zhang, "The Time-Varying Coherent Analysis of Medical Signals", proceedings in International Conference, 2002.
- Hye-Sue Songand Paul M. Lehrer," The Effects of Specific Respiratory Rates on Heart Rate and Heart Rate Variability", Applied Psychophysiology and Biofeedback, Vol. 28, No. 1, March 2003.
- Zhenhua Zhang, Tong Wang, Jinshan Ding, Zheng Bao, "A New Approach to Improve Coherence in SAR/GMT Processing of Distributed Microsatellites Systems", IEEE 2006.
- A Sobron, I Romero, T Lopetegi," Evaluation of Methods for Estimation of Respiratory Frequency from the ECG", 2008
- Alexander Wong," An Iterative Approach to Improved Local Phase Coherence Estimation", Canadian Conference on Computer and Robot Vision, IEEE 2008.
- Tetsuya Asakawa, Takuto Hayashi, Yuko Mizuno-Matsumoto," Visualization of the correlation and propagation of information between EEG electrodes", IEEE 2008.
- Yer Der Lin, Wei Ting Liu, Ching Che Tsai, and W. Chen, " Coherence Analysis between Respiration and PPG signal by Bivariate AR Model", WASET, vol. 3, No. 5, 2009.
- Gavendra Singh, Charanjeet Singh, "Estimation of Coherence Between ECG and EEG signal at different Heart rate and Respiratory Rate", International journal of Engineering and Innovative Technology, vol. 1, Issue 5, 2012.
- Physionet: the research resource for complex physiologic signals http://www.physionet.org/.
- N. Sumitra, Rakesh Saxena,"Brain Tumor Classification Using Back Propagation Neural Network", International Journal of Image, Graphics and Signal Processing, DOI: 10.5815, 2, 45-50, February 2013.
