Analysis of the liquidity and solvency of the company and directions of their increase

Free access
This article discusses some aspects of liquidity and payment analysis of the company. Also proposed the main directions for increasing the above economic indicators. It is recommended that the organization improve the structure of liquid assets, use the capital structure and a system of short-term liquidity planning and budget forecasting to assess and forecast the company's medium and long-term capital needs.
Analysis, liquidity, solvency, increase, current ratio, quick ratio, cash
Short address: https://sciup.org/140288574
IDR: 140288574 | UDC: 657.47
Text of the scientific article Analysis of the liquidity and solvency of the company and directions of their increase
Huawei is a private company founded in 1987 and the only company that is not listed on the Global 500. Committed to becoming the world's leading provider of ICT (information and communications) infrastructure and smart terminals. At present, Huawei has 188,000 employees, has operations in more than 170 countries and regions, and serves 3 billion people. It is the world's largest supplier of communications equipment. Huawei's core competitiveness is its proprietary and unique technologies in three aspects: 5G communication technology, Kirin chip opens a new era of mobile phone AI chips, Hongmeng system is a multi-terminal distributed operating system developed completely independently by Huawei.
Huawei: The registered capital is 40,341,131,82 million yuan (RMB), and the actual paid-in capital is 39,908,132,000 (RMB).
Huawei's shareholding structure: Huawei Technologies Co., Ltd. is 100% controlled by Huawei Investment & Holding Co., Ltd.; Huawei Investment Holding Co., Ltd. is composed of two shareholders (Ren Zhengfei holds 1.01% of the shares, and the labor union committee of Huawei Investment Holding Co., Ltd. holds 98.99% of the shares). Huawei employee shareholding is achieved through this "alliance" (virtual restricted shares).
Liquidity analysis is an analysis of the efficiency of the use of corporate funds. The circulation and turnover of corporate funds reflects the operational efficiency of the company’s supply, production, and sales operations. High efficiency, fast capital turnover and good efficiency.
Table 1 – The financial statements in the 2019 annual report
|
Indicator |
2019.12.31 |
2018.12.31 |
Growth rate |
|
Cash flow from operating activities |
91384 |
74659 |
122.4% |
|
Cash and short-term investments |
371040 |
265857 |
139.6% |
|
Short-term loan |
7631 |
3771 |
202.4% |
|
Long-term loan |
104531 |
66170 |
158.0% |
As of the end of 2019, Huawei’s cash flow from operating activities totaled RMB 91,384 million, an increase of 22.5% from RMB 74,659 million at the end of 2018. The cash flow from operating activities this year has increased, which shows that Huawei maintains its working capital. In order to achieve a healthy cash flow and a stable capital structure. However, cash and short-term loans totaled RMB 371,040 million, an increase of 39.6% from RMB 265,857 million at the end of 2018. Huawei's long-term and short-term borrowings in 2019 have increased significantly year-on-year, which is a signal of financial data worth warning. The management of cash capital and assets and liabilities in Huawei's liquidity risk management is not very complete.
Short-term solvency refers to the ability of an enterprise to repay current liabilities with current assets, and it reflects the ability of an enterprise to repay its daily due debts.
Analyze the current ratio:
Current ratio = Total current assets / Total current liabilities
Mobility ratio
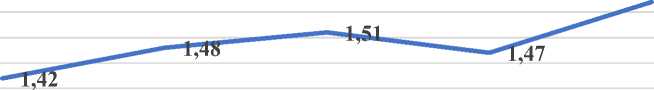
2015 2016 2017 2018 2019
1,57
1,6
1,55
1,5
1,45
1,4
1,35
1,3
г Mobility ratio
The current ratio is relatively stable at around 1.5. Huawei’s average current ratio in the past five years is 1.49, indicating that its short-term debt solvency is within a controllable range, but the risks of growth deserve attention.
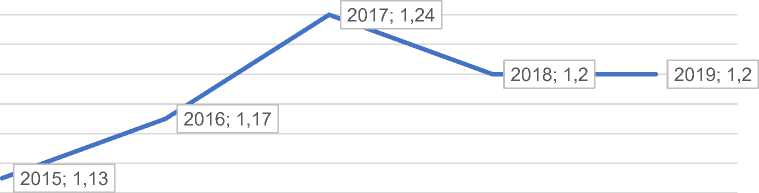
Analyze the quick ratio:
Quick ratio = (Current assets – Inventory) / Current liabilities
Speed ratio
1,26
1,24
1,22
1,2
1,18
1,16
1,14
1,12
1,1
1,08
1,06
^^^^^w Speed ratio
Analyze cash ratio:
Cash ratio = Monetary funds / Current liabilities
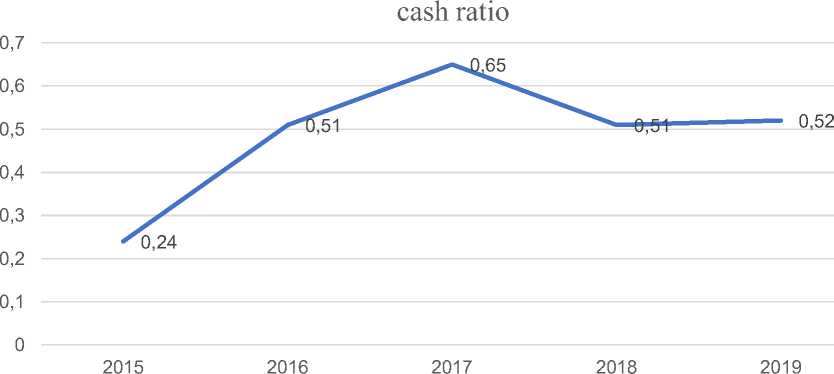
с cash ratio
Long-term solvency refers to the ability of an enterprise to bear debts and the ability to guarantee debt repayment. The strength of long-term solvency is an important indicator of the financial security and stability of a company
Analyze the asset-liability ratio:
Asset-liability ratio = (Total liabilities / Total assets) * 100%
Table 2 – Analyze the asset-liability ratio in the 2015-2019
|
Indicator |
2019 |
2018 |
2017 |
2016 |
2015 |
|
Total assets |
858661 |
665792 |
5052 25 |
443634 |
372155 |
|
Total liabilities |
563124 |
432727 |
329609 |
303501 |
253086 |
|
Assets and liabilities |
65.6% |
65.0% |
65.2% |
68.4% |
68% |
|
Total borrowing |
112162 |
69941 |
399 41 |
44799 |
28986 |
At the end of the article, we will give the following financial recommendations:
