Analysis of the Younger Dryas impact layer

Author: Firestone Richard B., West Allen, Revay Zsolt, Hagstrum Jonathan T., Belgya Tamas, Smith Alan R., Que Hee shane S.
Journal: Журнал Сибирского федерального университета. Серия: Техника и технологии @technologies-sfu
Article in issue: 1 т.3, 2010.
Free access
We have uncovered a thin layer of magnetic grains and microspherules, carbon spherules, and glass-like carbon at nine sites across North America, a site in Belgium, and throughout the rims of 16 Carolina Bays. It is consistent with the ejecta layer from an impact event and has been dated to 12.9 ka BP coinciding with the onset of Younger Dryas (YD) cooling and widespread megafaunal extinctions in North America. At many locations the impact layer is directly below a black mat marking the sudden disappearance of the megafauna and Clovis people. The distribution pattern of the Younger Dryas boundary (YDB) ejecta layer is consistent with an impact near the Great Lakes that deposited terrestrial-like ejecta near the impact site and unusual, titanium-rich projectile-like ejecta further away. High water content associated with the ejecta, up to 28 at. % hydrogen (H), suggests the impact occurred over the Laurentide Ice Sheet. YDB microspherules and magnetic grains are highly enriched in TiO2. Magnetic grains from several sites are enriched in iridium (Ir), up to 117 ppb. The TiO2/FeO, K/Th, TiO2/Zr, Al2O3/FeO+MgO, CaO/Al2O3, REE/ chondrite, FeO/MnO ratios and SiO2, Na2O, K2O, Cr2O3, Ni, Co, U, Th and other trace element abundances are inconsistent with all terrestrial and extraterrestrial (ET) sources except for KREEP, a lunar igneous rock rich in potassium (K), rare-earth elements (REE), phosphorus (P), and other incompatible elements including U and Th. Normal Fe, Ti, and 238U/235U isotopic abundances were found in the magnetic grains, but 234U was enriched over equilibrium values by 50 % in Murray Springs and by 130 % in Belgium. 40K abundance is enriched by up to 100 % in YDB sediments and Clovis chert artifacts. Highly vesicular carbon spherules containing nanodiamonds, glass-like carbon, charcoal and soot found in large quantities in the YDB layer are consistent with an impact followed by intense burning. Four holes in the Great Lakes, some deeper than Death Valley, are proposed as possible craters produced by the airburst breakup of a loosely aggregated projectile.
Impact ejecta layer, impact crater, methods of elemental analysis, magnetic grain and microspherule analysis, analysis of carbon spherules and glass-like carbon
Short address: https://sciup.org/146114522
IDR: 146114522 | UDC: 551.3
Анализ импактного слоя Молодого Дриаса
Мы обнаружили тонкие слои магнитных зерен и гранул, шарики углерода, а также стекло преимущественно из углерода в девяти пунктах по всей Северной Америке, Бельгии и во всех 16 заливах Каролины. Это согласуется со слоями с импактным веществом и приурочено к 12,9 тыс. лет назад, совпадая с похолоданием и повсеместным исчезновением мегафауны в Северной Америке в начале Молодого Дриаса (YD). Во многих местах слой с импактным веществом расположен непосредственно под маркировкой внезапного исчезновения мегафауны и культуры Кловиса. Картина распределения слоя импактного вещества на границе Молодого Дриаса (YDB) согласуется с импактным воздействием около Великих озер, которое отложило вещество, выброшенное вблизи от места необычного импактного воздействия, и богатые титаном частицы, выброшенные дальше. Высокое содержание воды в слоях импактного вещества (до 28 % водорода) свидетельствует, что воздействие произошло на Лаврентидовом ледниковом щите. Микрогранулы и магнитные зерна в слое YDB высоко обогащены TiO2. Магнитные зерна из нескольких мест обогащены иридием (Ir), до 117 частей на миллиард. Отношения TiO2/FeO, K/Th, TiO2/Zr, Al2O3/FeO + MgO, CaO/Al2O3, REE / хондриты, FeO / MnO, а также SiO2, Na2O, К2О, Сг2О3, Ni, Co, U, Th и другие следы элементов являются несовместимыми со всеми земными и внеземными источниками, за исключением KREEP - лунной магматической породы, богатой калием (K), редкоземельными элементами (РЗЭ), фосфором (P) и другими несовместимыми элементами, включая уран и торий. Нормальные Fe, Ti и изотопы 238U/235U в изобилии были найдены в магнитных зернах, но 234U обогатилась более равновесными значениями на 50 % в Мюррей-Спрингс и на 130 % в Бельгии. 40K обогащен до 100 % осадками из YDB и кремниевыми артефактами культуры Кловис. Высокая везикулярность углеродных шариков, содержащих наноалмазы, стекло, так же как углерод, древесный уголь и сажа, обнаружены в больших количествах в слое YDB и согласуются с последствиями интенсивного горения. Четыре глубокие впадины в районе Великих озер, более глубокие, чем в Долине смерти, предлагаются в качестве возможных кратеров в результате взрыва в воздухе и распада слабо агрегированных образований.
Text of the scientific article Analysis of the Younger Dryas impact layer
We have reported [16] a narrow layer of magnetic grains and microspherules, dated to 12.9 ka, at seven Clovis sites across North America, glacial Lake Hind in Manitoba, Canada, a drumlin in Alberta, Canada, a comparably dated site in Lommel, Belgium, and throughout the 1-5 m thick rims of 15 Carolina Bays. Additional markers found in the YD boundary layer (YDB) at most sites include high concentrations of iridium, glass-like carbon containing nanodiamonds and fullerenes with ET 3He abundance, carbon spherules, soot, and charcoal. At many sites, a «black mat» lies directly above the YDB layer, which has also been identified by C. Vance Haynes at 57 sites in North America [23]. Haynes [24] reported that no evidence of extinct megafaunal remains or in situ Clovis artifacts is found above the black mat and suggested that « the sudden extinction of the Pleistocene megafauna would be dramatically revealed by explaining that all were gone an instant before the black mat was deposited» . The age of the YDB layer was determined as 12,938 ± 25 cal yr BP from the average of youngest dates determined at various sites summarized in Table 1. This age coincides with the onset of YD cooling ~12,900 yr BP determined from GISP2 methane and paleotemperature analysis (Fig. 1).
Table 1. Youngest dates available for the sites examined containing YDB markers. In most cases, the sites were independently dated by other researchers and recalibrated here using IntCal04 [40]. Two sites were not previously radiocarbon dated: (1) Morley drumlin is constrained by the end of local deglaciation to ~13 ka; and (2) the Chobot site is of Clovis age because of an abundance of Clovis artifacts, limiting the site’s age, according to Waters and Stafford [49], to a minimum range of ~200 years between 13,125 to 12,925 cal. B.P. Seven of the 10 sites exhibit a black mat immediately overlying the YDB layer
|
YDB TEST SITES |
Da tes |
Black Mat |
Cal BP |
± (1σ) |
14 C Date |
± (1σ) |
SOURCE |
|
Blackwater Draw, NM |
1 |
Yes |
12982 |
575 |
11040 |
500 |
Taylor, et. al (1996) [41] |
|
Chobot, AB, CAN |
1 |
Yes |
~13000 |
-- |
Archaeology |
-- |
Staff (2000) [11] |
|
Daisy Cave, CA |
1 |
Yes |
13090 |
140 |
11180 |
130 |
Erlandson, et al. (1996) [14] |
|
Gainey, MI |
1 |
No |
12400 |
1000 |
TL |
-- |
Simons, et al. (1984) [39] |
|
Lake Hind, MB, CAN |
1 |
Yes |
12755 |
87 |
10610 |
25 |
UCIAMS 29317 (this work) |
|
Lommel, Belgium |
1 |
Yes |
12943 |
30 |
10950 |
50 |
Van Geel, et al. (1989) [45] |
|
Morley, AB, CAN |
1 |
Yes |
~13000 |
-- |
Deglaciation |
-- |
Boyce, et al. (1991) [6] |
|
Murray Springs, AZ |
8 |
Yes |
12916 |
25 |
10890 |
50 |
Taylor, et al. (1996) [41] |
|
Wally’s Beach, ABA CAN |
1 |
No |
12966 |
61 |
10980 |
80 |
Kooyman, et al. (2001) [31] |
|
Weighted Average |
12938 |
25 |
|||||
Sample collection and preparation
Sediment samples were collected from the YDB layer at each site which was identified by its proximity to the black mat and/or its association with Clovis-age artifacts. Sediment samples from above and below the YDB layer were also collected to determine the distribution of YDB markers. The magnetic and carbon components of the impact layer were separated from sediment as follows.
Separation of the magnetic component of the impact layer
A 2” x 1” x 0.5” grade-42 neodymium magnet was used for qualitative in situ field testing to locate the peak in magnetic grains in the YDB. This worked best in loose, dry sediment with a high grain concentration. For quantitative analysis several methods were used to separate magnetic grains from – 31 –
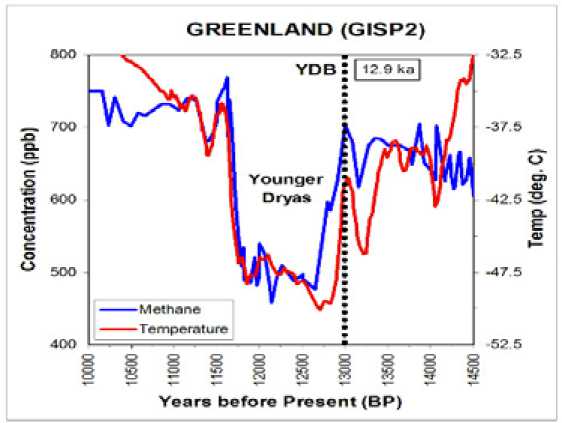
Fig. 1. Haynes, in Taylor, et al. (1996)1, correlated the end of Clovis cultural adaptations with the onset of Younger Dryas cooling and provided end-Clovis 14C dates that have been calibrated to 12.92 ka for Murray Springs and 12.98 ka for Blackwater Draw, two of the sites we analyzed. This graph displays a corresponding date of 12.9 ka for the onset of the YD in Greenland GISP2 ice core data based on paleotemperature analyses (Alley, 20002, in red) and changes in methane concentrations (Brook, et al.,20003, in blue). The onset of the YD was marked by a dramatic 8 °C drop in Greenland temperature in less than 150 years with an associated abrupt decrease in atmospheric methane concentrations. We propose that these climatic changes were triggered by the YD event at ~ 12.9 ka sediment, depending upon the type of sediment. For large-scale processing, the following basic procedures were used with automated equipment and a bank of magnets, which were placed in a moving stream of either wet or dry sediment. Small samples were processed manually.
For loose or sandy sediment about 500-1000 g of friable sand or silt was first dehydrated at room temperature and weighed. Then the samples were put into a container and any lumps were broken up. All processing was done with non-metallic tools to avoid contaminating the sample with foreign metal. The magnet was placed in a 4-mil plastic bag to prevent grains from adhering directly to the magnet. Sediment sample was poured over the tightly bagged magnet into an empty container. Magnetic grains sticking to the magnet were collected in a separate container when the magnet was removed from the bag. This process was repeated until all of the magnetic grains were recovered. In order to remove dust and debris still adhering to the magnetic grains and spherules the magnetic fraction was placed in a beaker of water. The bagged magnet was gently agitated in the beaker to attract the magnetic grains which were then deposited on to a dry laboratory dish after the magnet was removed from the bag. After drying, the samples were weighed, catalogued, and examined microscopically.
For sediment that was sticky or clayey and difficult to pulverize about 4 liters of water were added to each 500-1000 g of sediment and homogenized it into slurry. The bagged magnet was used to extract magnetic grains from the fluidized mixture and the magnetic grains were then released from the magnet into a separate container of water and then retrieved onto a laboratory dish as discussed above.
-
1 Taylor R.E., Haynes, C.V., and Stuiver M. (1996) Antiquity 70, 515-525.
-
2 Alley R.B. (2000) Quaternary Science Reviews 19:213-226.
-
3 Brook E. J., Harder, S., Severinghaus J., Steig E.J., and Sucher, C. M. (2000) Global Biogeochem. Cycles , 14 (2), 559–572.
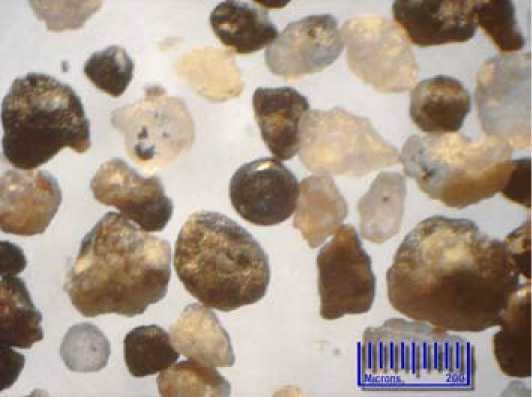
Fig. 2. Representative sample of magnetic grains and microspherules extracted from the YDB layer at Blackwater Draw. Grains very from rounded to subrounded to highly angular and colors range from mostly white quartz to metallic black. Magnetic grains were found in all sediment layers but peaked sharply in the YDB
Although sonication is a common way of separating magnetic grains from sediment, this process was not used here because that procedure typically collects only the smallest most highly magnetized grains missing up to 90 % of the remainder, including many of the most interesting items such as the titanium-rich microspherules. Fig. 2 shows a representative collection of magnetic grains and microspherules collected at the Blackwater Draw site. The magnetic grains have a continuum of shapes ranging from sub-round to highly angular and very in color from white to black.
Extraction of magnetic microspherules
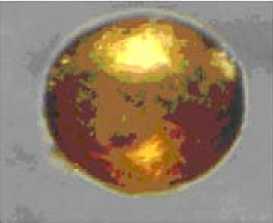
The magnetic fraction was extracted from a weighed sediment sample as discussed above. The concentration of microspherules in bulk sediment is low and it was often necessary to search nearly the entire magnetic fraction to find them. Approximately 100 mg aliquots of the magnetic fraction were weighed, deposited sparsely across a microscope slide, and scanned microscopically. Microspherules, typically ranging from 10-100 µ m, were counted, and their abundance extrapolated to quantity per kg. Selected microspherules were manually removed from the magnetic fraction with a moistened probe and placed onto either an SEM mount or double-sided tape on a microscope slide. The spherules were either left whole or sectioned and given a microprobe polish for analysis by laser ablation or X-ray fluorescence (SEM/XRF). Representative microspherules from various sites are shown in Fig. 3.
Extraction of carbon spherules, glass-like carbon, and charcoal
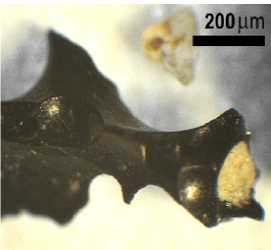
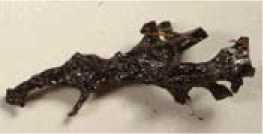
Low density carbon spherules were separated by floatation in water. Typically one kg samples were added to about 4 liters of water and agitated. The floating fraction was collected with a 150- µ m sieve. A second carbon fraction with specific gravity slightly greater than water was manually removed from the surface of the wet sediment. After drying the carbon spherules at low temperatures they were collected either manually or gravimetrically by vibrating the dried sample on an inclined, polished surface. Glass-like carbon and charcoal, in the samples were extracted manually and weighed. Typical samples of carbon spherules, glass-like carbon, and charcoal are shown in Fig. 4.
Murray Springs Chobot Lommel Arlington Springs
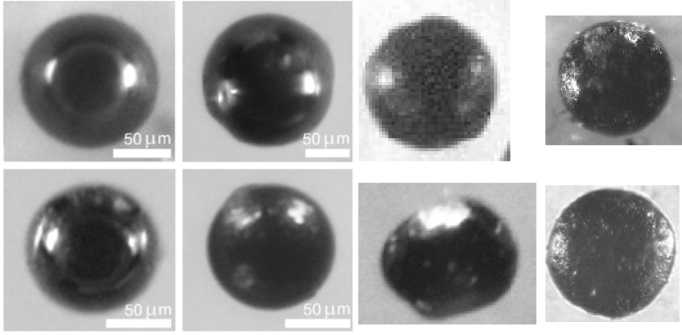
Gainey Topper Blackwater Draw Carolina Bay
Fig. 3. Titanium rich magnetic microspherules were only found in the YDB at Clovis-age sites
Research site descriptions
The distribution of YDB markers found at research sites described below is summarized in Table 2.
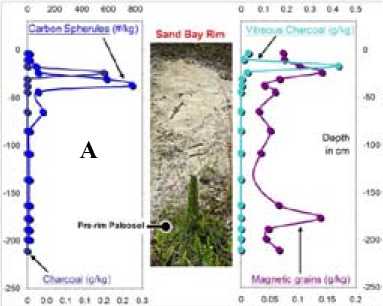
Murray Springs , near Sierra Vista, Arizona, is one of several local Clovis mammoth kill-sites associated with a chain of end-Pleistocene ponds at 12.9 ka. Sediments from the YDB layer are mostly fine to coarse fluvial or lacustrine sand. A distinctive black mat, most likely of algal origin, drapes conformably over the bones of butchered mammoths, and a thin layer (<2 cm) that contains YDB markers lies at the base of the black mat and immediately overlies the bones [23]. The upper surfaces of some Clovis-butchered mammoth bones, which were in direct contact with the YDB and the black mat, exhibit slightly higher radioactivity and magnetic susceptibility than the lower surfaces. Fig. 5A shows that the distribution of magnetic grains and spherules, carbon spherules, charcoal, iridium and nickel peaks in a narrow layer immediately beneath the black mat.
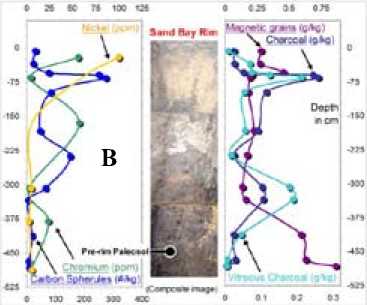
Blackwater Draw in New Mexico is southwest of the town of Clovis, which gave its name to the type of projectile points first found there. It was a PaleoAmerican hunting site on the bank of a spring-fed waterhole, where the black mat was found draped over bones of butchered mammoths and Clovis artifacts. YDB markers are concentrated in a ~2-cm layer of fine-grained fluvial or lacustrine sediment that lies at the base of the black mat in the uppermost stratigraphic horizon containing in situ mammal bones and Clovis artifacts. The upper surfaces of some mammal bones were in direct contact with the YDB or the black mat and exhibited very high levels of radioactivity. We sampled a 2-meter stratigraphic sequence spanning the YDB down into the deep gravels that date to >40 ka and possibly to 1.6 Ma [23]. ET markers peaked only in the YDB. Fig. 5B shows that the distribution of magnetic grains and spherules, glass-like carbon, and iridium peaks in a narrow layer immediately beneath the black mat.
Lake Hind in Manitoba, Canada, was an end-Pleistocene proglacial lake. Various analyses by Matthew Boyd, et al., show that at ~12.76 ka, the ice dams on the lake failed catastrophically as part of a regional pattern of glacial lake drainages. At the YDB, the failure rapidly transformed the lake from deep to shallow water [7], as shown by pollen analysis and the start of peat accumulation. The sample – 34 –
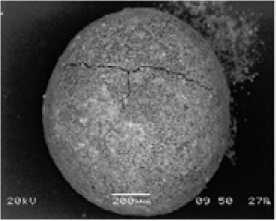
Vesicular carbon spherules and a copal spherule from the Carolina
Gainey, MI
Topper, SC
Murray Springs, AZ
Glasslike carbon particles
Charcoal from Chobot
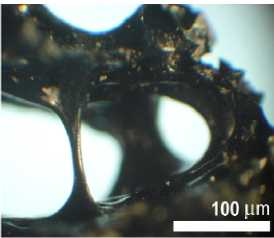
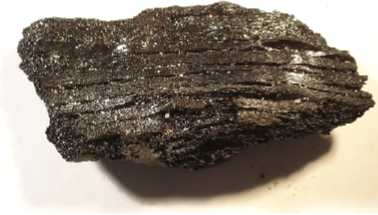
Fig. 4. Vesicular carbon spherules, copal (amber) s pherules, glass like carbon, and charcoal were abundant in the YDB layer. Some carbon spherules can be produced in high temperature forest fires. Many carbon spherules contained nanodiamonds which are clear evidence of production during an impact. The association of carbon spherules and copal spherules suggests that they have a common origin, perhaps in different temperatures regimes of fires following the impact. Glass-like carbon and charcoal may have been produced by the burning of forests under reduced oxygen conditions caused by the atmospheric shockwave emanating from the impact site
Table 2. Summary of the distribution of YDB markers found at the sites as discussed in this paper
|
is |
^ о о М ОО о о1 ^ ^ Н m ni ^ |
о о о Z СП z |
о - Z - Z |
—, о о о о cxi Z Z Z Z |
|||||
|
а |
о |
о о о о > > Z > Z Z Z |
о о О (8 > > > > |
о о о о Z Z Z Z |
о о о о о Z Z Z Z Z |
||||
|
й а о S 5 со & и — |
04 |
ОО . z z । <м ! ; । |
ООО Z Z Z \ |
04 40 04 । । । |
о г 1 1 1 1 |
||||
|
щ а |
ОО |
^ ОО ^ X х д сп । । <м । : |
о X оо 1 ! |
оГ оо 40 X оЗ ^ оо ! ! ! 1 |
|||||
|
О 01) £ ^ я ^ О |
|> |
СП 04 Сх) 40 О —; —; О ОО О О О О 1 Z Z |
сл сл сП 40 W ^ о >^ > о О |
сп сп П1 О С^ ■—. <1_> о о И > |
о о у CS у > > > о ^ |
||||
|
й О ” л *. U Ри “ ю |
40 |
С-1 о g о й Z ^ ^ Z 1 <м 1 |
^ § z - |
, оо О Ох о оо ^ ^ Z |
3 > > ^ > |
||||
|
Д О 60 ^ ^ 5 |
М^ |
g ^ g g оо |
ш П1 40 ш м П1 о 0_> > о о ^ |
о S о о |
40 2^ 2^ ! -н > >Й о О |
||||
|
у й 60 р а а 2 В |
^ |
ОО ОО 04 40 г- ^н о , г- Г- Ш DI —1 40 1 04 |
^ Z ^ s |
О 40 Cxi . Cxi СП Cxi 1 |
cxi ; । хг ; |
||||
|
о Д '5b Д Д Д s ° |
сп |
о М О' М Qx,,—1 К) —. o-c-l xo ^у- о- cxi ^‘ сп cxi S о ^‘ |
и м > o^ >”* О О 04. |
2 ОО ОО Cxi ^ cxi о —; —< |
ур йо |
||||
|
д Т5 д |
сч |
оЗ гД ^ |
сп g ^ ^ 2 ^ ю 40 L? _ Тй о К) с-1 оо о о СО Г- П1 ^ ^ 04 04 2 ^ $ ^ ^ оо ^ 3 z z ^ ^ Й" ^ ОО ^ СП Д" Ю й й 04 ^ °° У4 Й С- 04 СП g 2? о о С-1 04 04 ID СП О О д- cxi ni ^2 04 сп сп |
^ ^ ^: g So ш ^ Р1 ОХ О 2 о S 2 Р1 о м. П й Z Z z а о о m о г- оо .Г) g 04 Ю ОО о хг и, ^ ^' 04 ^н‘ ^н‘ |
S' Д о "о о А гД |
§ S % 5х
m 40 ^ О 40 г- Щ Cxi Г- ^ 40 ^ $ ^ |
S оЗ "о 'оЗ Д О хН |
- 1 i В i 2° m ох о So ? Cl g S о оо oo ^$ ^2 Д^ z z 5 & 5; a1 xd OO —1 CH 04 40 OO —। О 04 id OO OO OO r~; r~; |
|
|
Й н й со > О О |
2 Z N „ | 5 м- < а а 2 и <® н н а „ ,goi:
-у ^ ^ (Z) CQ ^ о ^ й £ Й & & а о и S > а а |
й н й й > О о |
< ^ 5 о а < ^ ™ -S и ч а тс 75" m g S щ g ^ 5 я о S а а а 2 |
а < g б |
S а 2 2 . к J и a z а <х С "Д У Д ^ ^ а 2 к а |
а < g g б |
СП Д- Cxi CH Dl CH 2 2 5 cn , , । CQ g о о и Л :
4 z о о O V оЗ оЗ оЗ
a a a a g (L> (1_> (L> V2 Д "ta "ta "ta S 2 2 2 S a |
Table 2 continued
|
о о о о о о Z Z Z Z Z Z |
||
|
о |
о о о о о о Z Z Z Z Z Z |
|
|
04 |
04 04 |
|
|
ОО |
r? HI HI Й .g. 04 |
|
|
|> |
от от от 3 £ CD CD CD О CD > > > ^ 0 > |
04 |
|
40 |
W CD CD C^ ° > > > 2 2 z |
04 OO |
|
■П |
от от от O1 ^ СП CD CD CD 0 '— '—1 >- >- >- —'0—: |
04 04 |
|
04 OO |
||
|
СП |
04 । |
О |
|
с^ |
9* 9* rO ^^ g S Г g S ?° ° В 2 ^ 0 § p 3 5 00 g m g ox ox 00 00 ^ z z g z § z g В § s i в ^_ OO 04 О ^4 OO |
|
|
S m Й 6 J J J 2 О О О Л ш z z Z g 7 1 0 г 5 -e -e g у « У Д CD СЗ
U U J 2 |
GO Pi |
I
СУ
О
sediments are fine-grained lacustrine silt and peat. Fig. 5C shows that the distributions of magnetic grains, carbon spherules, iridium and nickel peak in the Clovis layer.
Chobot is southwest of Edmonton, Alberta, Canada. In Clovis times, it was located along the shore of a proglacial lake, where a supply of quality flint attracted hunter-gatherers. The presence of Clovis artifacts [11] dates this level to an interval of ~200 years ending at 12,925 cal B.P. [50]. The Clovis level is capped by the YDB layer, above which there is a black mat similar to other sites. The YDB sediment samples are mostly fine-grained and colluvial. Fig. 5D shows that the distributions of magnetic grains and spherules, carbon spherules, glass-like carbon and charcoal peak in the Clovis layer.
Topper , located on a high bank of the Savannah River near Allendale, South Carolina, was a Clovis-age flint quarry containing thousands of artifacts. Sediments are eolian, fluvial, colluvial, and alluvial in origin and are comprised mostly of coarse to medium quartz sand. YDB markers occur within a ~5-cm interval immediately in and above a distinct layer of Clovis artifacts. Lower sediments in the sequence have been dated to >55 ka [21], and no ET markers appear in the stratigraphic sections above or below the YDB. There is no black mat at this site. Fig. 5E shows that the distributions of magnetic grains and spherules and carbon spherules peak in the Clovis layer. At a new excavation the neodymium magnet and a magnetic susceptibility meter were used to help identify the YD layer based on the high iron content. Shortly afterward, the excavators recovered part of a Clovis point immediately beneath the YD layer (Fig. 6), illustrating the usefulness of the YDB markers for locating the Clovis horizon in new locations.
Morley is a non-archaeological site west of Calgary in Alberta, Canada. The site is on a raised drumlin, a sub-glacial erosional landform that formed at the end of the Pleistocene during deglaciation [6]. The largest drumlin field near Ontario (5000 km2) contains 3,000 drumlins that date to shortly after 13 ka, and the age of the Morley drumlin field appears to be similar. Later, the ice sheet melted away leaving atop the drumlin glacial debris containing numerous YDB markers. Samples are mostly gravel grading down through coarse and medium sand. Fig. 5F shows that the distributions of magnetic grains and spherules peak in the Clovis layer.
Gainey , north of Detroit, Michigan, was a PaleoAmerican campsite located tens of kilometers from the southern margin of the Laurentide Ice Sheet at 12.9 ka. Sediments containing YDB markers are mostly fine alluvial sand and glacial silt. The Gainey site has been closed and hence inaccessible for many years, and only archived samples from the ~5-cm YDB layer were available for analysis. No black mat was observed. Fig. 5G shows that the distribution of magnetic grains and spherules peaks in the Clovis layer.
Wally’s Beach at St. Mary Reservoir, southwestern Alberta, Canada, was a stream-fed valley that, at 12.9 ka, supported many species of now-extinct megafauna, including mammoths, camels, and horses. Hundreds of their footprints were found there during prior excavations. A sediment sample of fine-grained and silty alluvium was provided to us by Dr. Brian Kooyman from the brain cavity of a horse skull found (Fig. 7) in the YDB layer amidst Clovis points that tested positive for horse protein, providing some of the first evidence that Clovis peoples hunted horses [31].
Daisy Cave is a cave/rockshelter on San Miguel Island, one of the Channel Islands off the Southern California coast. This cave does not appear to have been occupied until about 11.5 ka, but a Clovis-age human skeleton was found on nearby Santa Rosa Island, demonstrating that the PaleoAmericans had boats capable of reaching the islands [29]. Several markers were found, but others, including Ir, were – 38 –
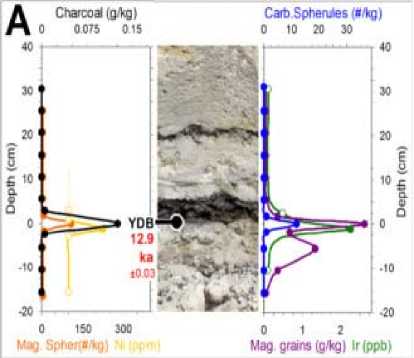
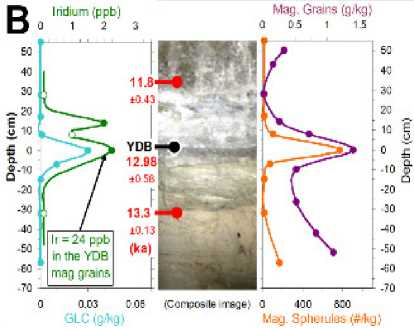
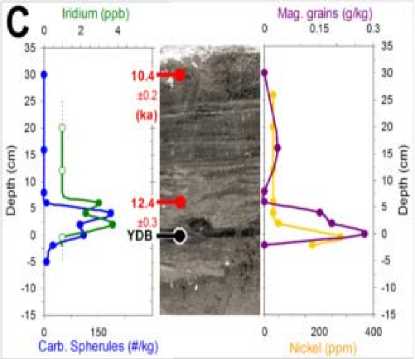
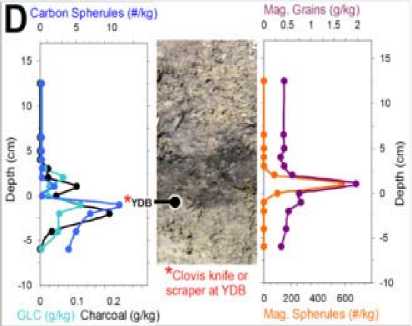
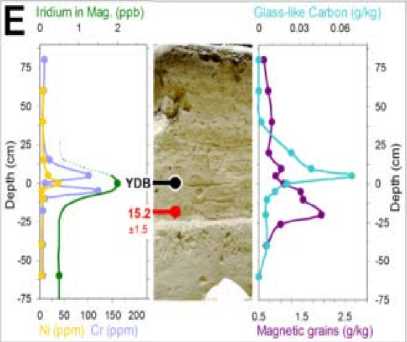
Fig. 5. Sediment profiles for the A) Murray Springs, B) Blackwater Draw, C) Lake Hind, D) Chobot, E) Topper, F) Morley drumlin, and G) Gainey sites. Magnetic grains peak in the YDB at all sites and magnetic microspherules are only found in or near the YDB. Carbon spherules, glass-like carbon, charcoal, and iridium also peak in the YDB. The Blackwater Draw image is a composite of three photos and there is no photo for Gainey
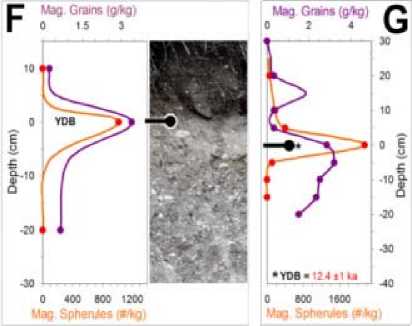
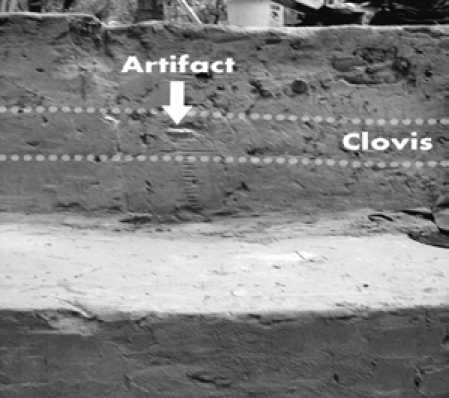
Fig. 6. In a new excavation at the Topper site the Clovis layer was identified with the Nd magnet and a magnetic susceptibility meter. Subsequently a Clovis point (arrow) was uncovered at that location. This demonstrates that the magnetic properties can be used to identify the YDB layer at many undated sites
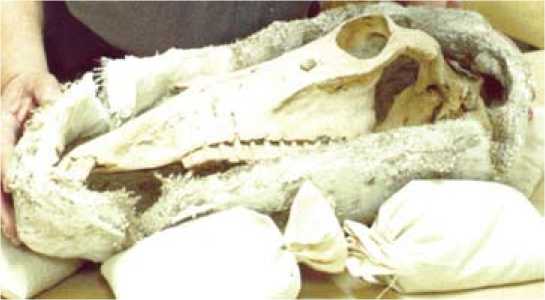
Fig. 7. Horse skull uncovered among Mammoth footprints and Clovis artifacts at the Wally’s Beach (St. Mary Reservoir) site in Alberta, Canada. Sediment retrieved from this skull was unusually enriched in magnetic grains (7.5 g per kg sediment) and iridium (51 ppb). Few magnetic microspherules were found inside the skull suggesting it was buried before the microspherules were deposited not found, possibly because the protected cave shelter prevented accretion. The sediment with YDB markers dates to ~13.09 ka [15] and varies from fine sand to silt.
Lommel is in northern Belgium, near the border with the Netherlands. At 12.94 ka [45], this site was a large late Glacial sand ridge, covered by open forest at the northern edge of a marsh. More than 50 archaeological sites in this area indicate frequent visits by the late Magdalenians, hunter-gatherers who were contemporaries of the Clovis culture in North America [46]. Throughout the Bölling-Allerod, eolian sediments known as the Coversands blanketed the Lommel area. Fig. 8 shows that the distributions of magnetic grains and spherules, charcoal, iridium, and rare earth elements peak beneath the Usselo layer, the European analog to the black mat.
Carolina Bays are a group of ≈500,000 highly elliptical and often overlapping depressions scattered throughout the Atlantic Coastal Plain from New Jersey to Alabama (see Fig. 9). They range from ~50 m to ~10 km in length [37] and are up to ~15 m deep with their parallel long axes oriented predominately – 40 –
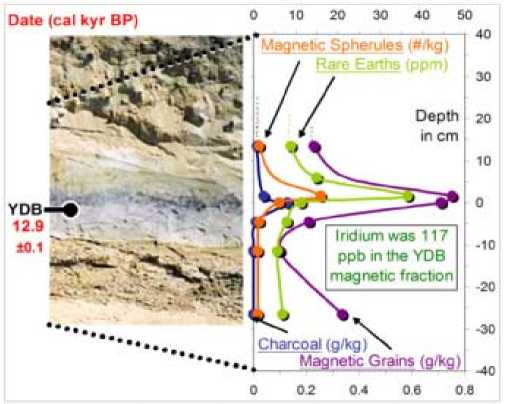
Fig. 8. Sediment profile from the Lommel, Belgium site. Numerous YDB markers peak beneath the Usselo layer the European analog to the black mat. Lommel magnetic grains contained the highest concentration of iridium (117 ppb) found at an site
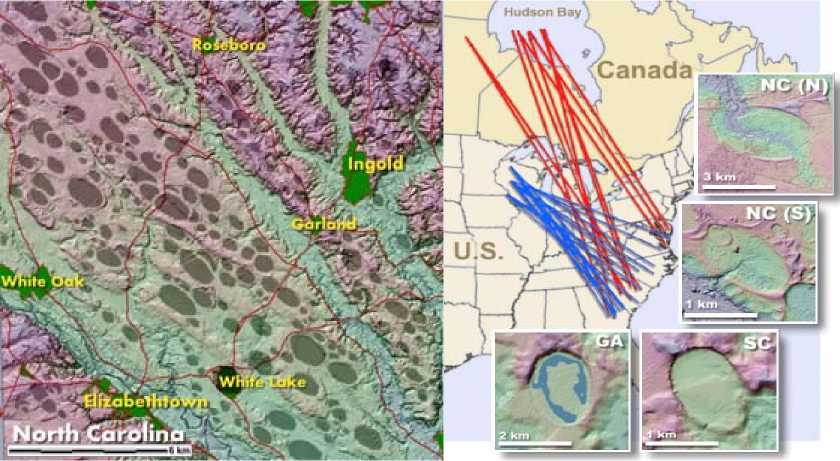
Fig. 9. DEM (digital elevation model) image of hundreds of Carolina Bays in Bladen County, NC (left). Like impact craters, many bays overlap other bays, while keeping rims intact. The DEM is color-coded by elevation and is vertically exaggerated for clarity. The orientation of the major axes of the Carolina Bays (right) points towards the Great Lakes and Hudson Bay
B
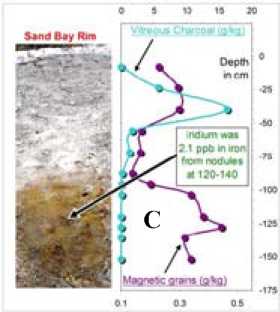
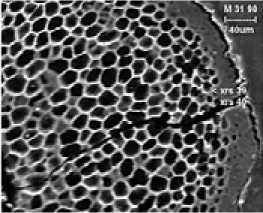
Fig. 10. Sediment profiles for Carolina Bays A) B14, B) M31, and C) M33. YDB markers, which are distributed in a narrow layer at most Clovis-age sites, are found throughout the rims of the Carolina Bays. The similar composition of markers found in the Bays suggests a common origin, but it remains unclear whether the Bays were formed by the shockwave following the YDB impact or by later Aeolian forces to the northwest. The bays have poorly stratified, sandy, elevated rims (up to 7 m) that often are higher to the southeast. All of the Bay rims examined were found to have, throughout their entire 1.5-5-m sandy rims, a typical assemblage of YDB markers (magnetic grains, magnetic microspherules, iridium, charcoal, soot, glass-like carbon, nanodiamonds, carbon spherules, and fullerenes with helium-3). In Howard Bay, markers were concentrated throughout the rim, as well as in a discrete layer (15 cm thick) located 4 meters deep at the base of the basin fill and containing peaks in magnetic microspherules and magnetic grains that are enriched in Ir (15 ppb), along with peaks in charcoal, carbon spherules, and glass-like carbon. In two Bay-lakes, Mattamuskeet and Phelps, glass-like carbon and peaks in magnetic grains (16-17 g/kg) were found about 4 meters below the water surface and 3 m deep in sediment that is younger than a marine shell hash that dates to the ocean highstand of the previous interglacial. Fig. 10 shows how various YDB markers are distributed throughout Carolina Bays near Elizabethtown NC (B14), Myrtle Beach SC (M31), and Marion SC (M33).
Modern fire sites. Four recent modern sites were surface-sampled. Two were taken from forest underbrush fires in North Carolina that burned near Holly Grove in 2006 and Ft. Bragg in 2007. Trees mainly were yellow pine mixed with oak. There was no evidence of carbon spherules and only limited evidence of glass-like carbon, which usually was fused onto much larger pieces of charcoal. The glasslike carbon did not form on oak charcoal, being visible only on pine charcoal, where it appears to have formed by combustion of highly flammable pine resin.
Two surface samples also were taken from recent modern fires in Arizona; they were the Walker fire, which was a forest underbrush fire in 2007 and the Indian Creek Fire near Prescott in 2002, which
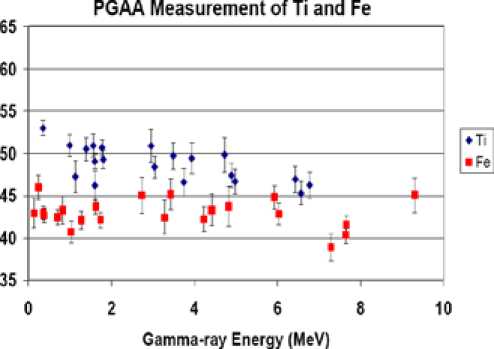
Fig. 11. Prompt Gamma-ray Activation Analysis (PGAA) analysis of a typical magnetic grain sample from the Topper site. The sample was placed in the guided neutron beam at the Budapest Reactor where the induced prompt gamma-ray spectrum was measured with an Compton-suppressed HPGe detector. Each point represents a separate simultaneous determination of the elemental concentration based on a different gamma ray observed in the PGAA spectrum. The results are then averaged giving 49±1 % TiO2 and 43±1 % FeO. PGAA is a complimentary method to Instrumental Neutron Activation Analysis with the advantage that it is sensitive to all elements and provides more rapid results was an intense crown fire. Trees mainly were Ponderosa pine and other species of yellow pine. Only the crown fire produced carbon spherules, which were abundant (~200 per kg of surface sediment) and appeared indistinguishable from those at Clovis sample sites. Both sites produced glass-like carbon fused onto pine charcoal.
Methods of elemental analysis of the YDB layer samples
Sediments, magnetic grains and microspherules, carbon spherules, and glass-like carbon were analyzed by Instrumental and Prompt Gamma-ray Neutron Activation Analysis (INAA/PGAA), Scanning Electron Microscope X-ray Fluorescence (SEM/XRF), Induced Coupled Plasma Mass Spectroscopy (ICP/MS), low-background gamma ray counting, and Thermal Ionization Mass Spectroscopy (TIMS). These methods are described below.
Prompt Gamma-ray Activation Analysis (PGAA) of samples from many sites was performed at the Department of Nuclear Research, Institute of Isotopes in Hungary. PGAA is a non-destructive technique [17, 36] using neutron beams to excite the samples producing gamma-ray spectra unique to each element. Typically, several gamma-rays are excited for each element, which can be used for analysis as shown in Fig. 11. PGAA is sensitive to all of the principal sample constituents, except oxygen, and many trace elements. Concentrations are typically normalized to the total sample composition assuming standard oxidation states.
Bulk samples of magnetic grains and microspherules, ranging in size from 9 mg to 13 g, were analyzed with PGAA for H, B, F, Na, Al, S, Si, Mg, Cl, K, Ca, Sc, Ti, V, Cr, Mn, Fe, Co, Ni, Cu, Cd, Sm, Eu, and Gd.
Instrumental Neutron Activation Analysis (INAA) of samples from many sites was performed at Becquerel and Activation Laboratories in Canada and at the Department of Nuclear Research, Institute of Isotopes in Hungary. NAA was used to analyze trace element concentrations in bulk magnetic grain – 43 – samples and these results are complimentary to the PGAA measurements. Bulk magnetic grain and sediment samples were analyzed by NAA for Be, Na, Si, Ca, Sc, Cr, Fe, Co, Zn, As, Se, Br, Rb, Zr, Mo, Ag, Cd, Sn, Sb, Te, Cs, Ba, Ce, La, Nd, Sm, Eu, Tb, Yb, Lu, Hf, Ta, W, Ir, Au, Hg, Th, and U.
X-ray Fluorescence (XRF) analyses of magnetic microspherules were done with a Scanning Electron Microscopes (SEM) at Cannon Microprobe and the USGS in Menlo Park. Representative microspherules were sliced, polished, and mounted for analysis. The grains were examined using energy dispersive x-ray detector (EDS). Elements with atomic number >10 were detected at Cannon Microprobe and with atomic number >5 at the USGS. Different regions of the microspherules were randomly analyzed to obtain average elemental concentrations.
Inductively Coupled Plasma Mass Spectrometry (ICP-MS) Analysis . The isotopes 52,53Cr, 58,60,61,62,64Ni and 191,193Ir were analyzed by ICP-MS. This analysis process involved digestion with concentrated Fisher OPTIMA nitric acid (HNO 3 ) followed by concentrated Fisher OPTIMA hydrofluoric acid (HF) with evaporation of the hydrofluoric acid before ICP-MS analysis in 5 % (v/v) HNO 3 . All vessels and containers were acid washed in 10 % nitric acid overnight, rinsed with ASTM I water, and dried beforehand. Initially, large sample weights of about 100 g were used to screen the various isotope ratio changes to detect changes in uranium (U) isotopes. A method blank and a positive control (NIST Buffalo River Sediment SRM 8704) were analyzed in parallel.
Low background gamma-ray counting techniques were used at the Lawrence Berkeley National Laboratory to measure the concentration of the natural radioactive isotopes 40K, 232Th, and 235,238U. Gamma rays from the decays of these isotopes were measured with HPGe detectors.
Thermal Ionization Mass Spectrometry (TIMS) analysis of 234,235,238U was performed using the USGS-Stanford Finnegan-Mat 262 TIMS to collect and isolate the uranium isotopic ratios. Chemical separation of uranium from the sample was accomplished using acid dissolution and then processed using anion exchange resins. The Finnegan-Mat262 Thermal Ionization Mass Spectrometer (TIMS) utilizes a surface ionization technique in which nitrates of uranium are placed on a source filament. Upon heating, positive ion emission occurs. The ions are then accelerated and focused into a beam which passes through a curved magnetic field dispersing the ions by mass. Faraday cups and/or an ion counter capture the ions and allow for quantitative analysis of the various isotopes.
Results of the sediment, magnetic grain and microspherule analysis
Results of the elemental analysis of bulk sediment profiles at various Clovis-age sites by PGAA, INAA and ICP-MS are summarized in Table 3. At most sites there is little difference between the YDB impact layer and adjacent sediment layers because the impact was deposited as a thin layer of ejecta at each site and was later diluted by turbation. This is a fundamental difference between the YDB impact layer that is distributed within a few centimeters of sediment and the K-T boundary layer that is often over a meter thick. At the Lommel, Belgium site background trace element concentrations were unusually low and significant increases in the concentrations of Sc, V, Co, Zn, Br, Sr, Y, Zr, Ba, rare earth elements (REE), Hf, Ta, Th, and U were observed.
Magnetic microspherules were only found in the YD impact layer. SEM/XRF analysis of 14 microspherules is shown in Table 4. Ten microspherule s from Gainey, Morley drumlin, Blackwater Draw, and Lommel are highly enriched in TiO 2 , averaging 34 wt. %, and FeO, averaging 44 wt. % resulting in an usually high average ratio TiO 2 /FeO=0.77. Four microspherules from Gainey and – 44 –
Table 3. PGAA/INAA analysis of bulk sediment from Clovis-age sites. The YDB layer is indicated in green
|
s р а а я § н » . -Q а |
О ОО сП oi oi oi МП 40 OO МП OO МП 2 2 2 |
04 ^н 40 xf 2 2 |
ОО 2 |
СП 04 ОО xt СП 40 04 04 40 ^ 2 О V |
CO ^ 40 oi xr мп OO MH Xt 2 V ^ |
04 V |
00 in 5 о a ^ 04 "^ |
a a a a V 2 |
V |
04 CO 2 V |
04 V |
04 V |
2 2 2 |
о |
|
о to О я 2 О О о н о о ° о ^ to ^ О Ж О 1 о м 2 О Z о щ |
oi cn oi о о ° о 2 2 а о о V V со ОО ^ 04 ОО |
Г^ 40 oi а 04 g xt °^ 40 ОО мп oi |
40 cxi 40 ОО ОО ОО cxi 04 ОО |
a a а 8 40 40 ОО ^, 04 04 40 V V 04 40 40 04 04 |
OO 04 ООО a H C'l C'l ^0 V V О 2 40 04 V4 OO OO o oi о |
OO о 04 V 2 04 |
о о a a 04 04 V V 2 40 04 |
МП 04 04 04 V 04 g |
40 О |
04 MH 04 V О |
04 V |
04 8 a |
о g о 04 04 04 V V V ^ о ^ |
40 40 OO oi 8 oi |
|
It 5 S £ ы % |
Щ 8 -д s < И ^ 15 ^ 2 2 о о > |
об" 2? Xt 40 гч с^ N N < < 00 00 а а GO go 8 2 |
2 N < 00 ,й а GO 2 |
а xt ХГ 40 СЧ СЧ N N N
00 00 00 .s .s .s a a a G/D G/D G/D о о о 2 2 2 2 2 2 |
^ C^? 40х а об об 04 04 04 2 2 2 z z z s" g” g” WWW Q Q Q 2 2 2 о о о ^ ^ ^ 2 2 2 о о о s s s |
^ об 04 2 z § Q 55 a s |
об' O' xf 40 об a 04 04 2 2 z z a a 55 55 a a s s |
о о GH GH a a a a H H |
^z o GO a a S |
S МП О О GH GH a a a a H H |
4p ffl E E о |
oT E g go ffl E E о |
o' 8 8 8 .8 .8 .8 2p 2p 2p 15 15 15 m m m 15 15 15 8 8 8 8 8 8 2 2 2 |
я и ■E я о о a 51 |
Table 4. X-ray fluorescence (XRF) analysis of the YDB Microspherules shows that they are highly enriched in titanium and iron with a TiO 3 /FeO ratio comparable to YDB magnetic grains and very different than all terrestrial and meteoritic sources except for lunar KREEP
|
Site-sample |
Al 2 0 3 |
SiO 2 |
TiO 2 |
FeO |
MnO |
TiO 2 /FeO |
|
Blackwater-1 |
3.7 |
5.8 |
13 |
74 |
1.7 |
|
|
Blackwater-2 |
2.3 |
3.1 |
53 |
37 |
3.5 |
|
|
Gainey-1 |
2.7 |
5.1 |
0 |
92 |
||
|
Gainey-2 |
24.8 |
55 |
2 |
18 |
||
|
Gainey-3 |
2.9 |
4.0 |
68 |
25 |
0.1 |
|
|
Gainey-4 |
6.4 |
40.1 |
25 |
7 |
||
|
Gainey-5 |
1.9 |
3.7 |
29 |
64 |
1.0 |
|
|
Morley-1 |
2.7 |
4.5 |
47 |
44 |
1.7 |
|
|
Morley-2 |
3.0 |
4.6 |
40 |
50 |
||
|
Morley-3 |
1.7 |
1.9 |
0 |
84 |
||
|
Morley-4 |
3.4 |
11.5 |
0 |
84 |
||
|
Lommel-1 |
74 |
16 |
||||
|
Lommel-2 |
54 |
11 |
||||
|
Lommel-3 |
74 |
16 |
||||
|
Spherule Average |
5.0 |
12.7 |
34 |
44 |
0.7 |
0.77 |
|
Grain Average |
6.1 |
44 |
22 |
30 |
0.9 |
0.73 |
|
Crustal |
15 |
67 |
0.6 |
5 |
0.1 |
0.12 |
|
Ocean trench |
10 |
59 |
0.5 |
7.6 |
2.2 |
0.07 |
|
Laurentian Basalt |
15 |
50 |
2.2 |
13 |
0.2 |
0.17 |
|
Cretaceous Tertiary |
15 |
70 |
0.3 |
4.5 |
0.01 |
0.07 |
|
PT layer |
9 |
24 |
0.45 |
2.3 |
0.02 |
0.20 |
|
CI Chondrite |
1.6 |
23 |
0.07 |
24 |
0.3 |
0.003 |
|
KREEP |
9 |
14 |
12 |
19 |
0.14 |
0.63 |
■ Mkroxphenilrx#/em2(/2i «Mag. Grains DMXxJ) ■ H2(XxKHI| eSKHixLSi ■ ТЮ2
60 1
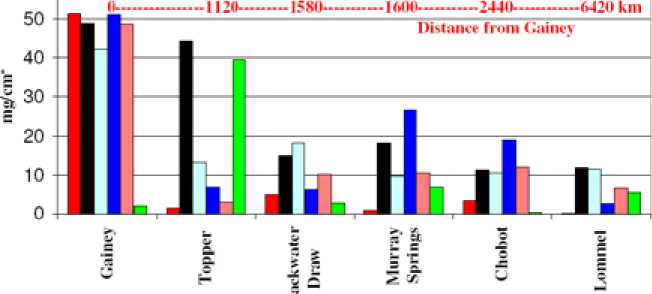
Fig. 12. Distribution of magnetic grains and microspherules, SiO 2 , TiO 2 , FeO, and H 2 O at Clovis-age sites as a function of distance from the Gainey site. All markers except TiO 2 are most abundant at Gainey indicating that the impact site was near Gainey and the projectile was unusually rich in TiO 2
Morley drumlin contained little or no titanium and may be micrometeorites from other sources that were redeposited by the melting glaciers.
Elemental analysis of magnetic grains from various Clovis-age sites by PGAA, NAA and ICP-MS are compared with various terrestrial, impact layer, meteoritic and lunar sources in Table 5. Magnetic grains extracted from the YDB at Gainey contain 14 wt. % FeO and 1.6 wt. % TiO 2 with a ratio TiO 2 / FeO=0.11 that is similar to the ratio TiO 2 /FeO=0.19 in adjacent sediment and nearly the crustal average ratio TiO 2 /FeO=0.13. This is consistent with a terrestrial, possibly local, origin for the Gainey magnetic grains. The five Gainey magnetic microspherules have an average ratio TiO 2 /FeO=0.55 suggesting a different origin than that for the magnetic grains. The average TiO 2 and FeO concentrations for magnetic grains from sites far from Gainey are 22 wt. % and 30 wt. % respectively with a ratio TiO 2 / FeO=0.73. This suggests that all magnetic microspherules and magnetic grains from all sites except Gainey may have a common origin. The high concentrations of TiO 2 in both microspherules and distant magnetic grains appear inconsistent with concentrations in all terrestrial, impact layer, and meteoritic sources except for lunar KREEP where a nearly identical ratio TiO 2 /FeO=0.73 was observed.
The geographical distribution of YDB ejecta is shown in Fig. 12. Most YDB impact markers, including the number of microspherules and the mass of magnetic grains, water, FeO, and SiO 2 , are far more enriched at Gainey than at other sites. This is consistent with an impact near the Great Lakes that deposited low-velocity terrestrial ejecta near the impact site. Microspherules and magnetic grains from sites far from Gainey are enriched in TiO 2 which is consistent with the deposition of high-velocity, titanium-rich ejecta from airburst of an unusual object far from the impact site. The TiO 2 distribution is also asymmetric with lower concentrations to the south and west (8-16 wt. %) and higher concentrations to the east (21-49 wt. %). That is consistent with a ballistic correction to the projectile ejecta motion due to Earth’s rotation [1] for an object approaching from the north. The distribution of FeO and SiO 2 is more symmetrical as expected if its origin is terrestrial.
The magnetic microspherules were presumably formed by impact ejecta launched above the atmosphere that melted upon reentry. Magnetic grains would include material melted by the impact and carried by an atmospheric shockwave spreading across the continent creating a wind-driven pattern of destruction across the landscape. Microspherules would continue to rain down long after the impact and the deposition of the magnetic grains. This scenario appears to have occurred at the Wally’s Beach site where magnetic grains were recovered from inside an extinct horse skull which had protected them from redeposition and postdepositional contamination. At Wally’s Beach the magnetic grain concentration is higher than at any other Clovis site (7.5 g/kg) with an unusually high iridium concentration (51 ppb). Conversely the number of microspherules in the horse skull is very low (0.02 per cm2) possibly because the shockwave buried the skull before many microspherules could fall into it.
Previous analyses of magnetic grains and microspherules found very different compositions. El Goresy [13] reported only one of 47 grains and spherules in Greenland ice that contained measurable Ti (29.7 wt. %). Gounelle et al analyzed 67 Antarctic micrometeorites [22] finding none with more than 0.2 wt. % TiO 2 . A single large magnetic microspherule containing 26 wt. % TiO 2 was found in the KT Maastrichtian bone bed [35] and one particle ascribed to the Tunguska impact was reported to contain 75 wt. % Ti [34]. Iyer et al [28] summarized the average Ti concentrations in 202 volcanic spherules from the Pacific Ocean (0.7-7 wt. %) and Central Indian Ocean Basin (0.3 %). The average – 47 –
Table 5. Comparison of PGAA/NAA analysis of YDB magnetic grains from Clovis age sites and Carolina Bays with terrestrial sources, impact ejecta layers, meteoritic and lunar sources. Ir concentrations designated with a * were measured in bulk sediment
|
р JS н |
о. О. о. О. О. О. |
п^ттят^мм,, V Й гч 5“ ^ ^ |
V ГЧ § ^ v ^ |
о VS °° m О о ^ о V ю ^ о о |
|
о £ о в S О и о н о « и о w СП о О СИ о о м S О Z о и |
©Л |
о о о о о |
||
|
1 ы |
ел |
я .s 1 а а ® ® 1 8 .S .S D Й и 5д<.ймидми_-< о о 2 о о Я Я Д Й Ь я ^ s 8 ^ s 1 Д 3 3 J |
§ § § S | | Sn Sn Sn Sn о о _ m m m m 5 5 co co co co > > .8 .8 .8 .8 ■g ’o ’o ’o § co co О О u u u u к к |
“ S' 8 я у .S ” g 3 U о а о о -£ я а S .2 в 5 ”2BS-SSh«S® .8 -S m д & & ® 3 у § ™ 1 8 " 3 $ о р а а с о y«Sgoo^2oo^S 0-0 Я 8 Н НН < О- О- 3 £ □ нд<2ди«<<ди |
Table 5 continued
|
сл ■о и N > сл М М 5 S о. о. 2 в N и > сл и М м |
° 3 V V V 6 v v Vvvv^^v^^ H^vvS^^vvS " n V V 7 V 2 V ^^^(N^'v^^i^icR V |
V V o V *v *v *v *v v *v V V V V |
§: й о ^ 2 Д 5 ю ^ ® 2g2^^> сч ^ |
|
s ы |
5 N 2 |
S u 2 z 2 5 Q й и и m V V S fl Й ЙО О. О. 5 2 и ^ S S m S^5 |
D g X X m mm § § § S | | >,>,>,>, о о _ m m m m 5 5 fl fl fl fl ^ ^ "o "o "o "o ^ ^ co co co co О О u u u u к к |
^ ^ ^ 41) 'Г О V Я о о Я со 2 -S m « ^ & 2 § « a § ™ § ^ 5 2 $ riO’fl CO fl Я fl ii 4) 4) 0-0 Я я н H НН < о- о- 3 г Эни<^р-исл<С<Си« |
Table 5 continued
|
я ■£ |
VvvvVv^^vV |
V V V V ^ |
2 - 5 § .So |
|
£ Н щ Ы Ы М 5 J > н ■о 8 О g 5 ы а ■5 Z и М и |
r4"v"v"vS^oooin"v3 ^V^^m^SSSS °v-v53°vv° S V V V» 6 ” V V ri - r'i ~ -r ~ - n ^ r ; m m v v v §П1Пу«МПууу |
v v 3 ?: V ^ V V ^ ^г v V v v н m V S V 2
V V V V |
0 a a 0 |
|
у сл S |
75 fl < m 5 ® ® — 8 о .я .8 Q bo bo -5 5 J й и и m оо2">.свсво<1><1>8 fl =1 Й Й о О- О- Я oSuSSSm^j |
X X сп mm § § § S | | _ m m m m 5 5 .8 .8 .8 .8 О O u u u u к к |
to ^ O' -1 ’"^ О U 3 5 « 0 я 8 5 q § § § ^ 55 f < ^ 8 rj Д 0 я Я д Q 4) 0-0 Я 9 H H < & & я
Dhu<^PhUw |
-
▲ YDB Mlcrospherutos
-
♦ YDB South East grains
YDB Gainey Choboi grains
Wally's Beach
2 +
* t
-
• Lunar meteorites
-
• Mars shergottite
-
• Chondrite
-
▲ Crustal Oceanic-Volcanic
-
▲ KT ‘PT Australasian layers
AI2O3 (%)
Fig. 13. Comparison of FeO+MgO and Al 2 O 3 concentrations. Microspherules and magnetic grains from sites south and east of Gainey have very different FeO+MgO/Al 2 O 3 ratios than Gainey or terrestrial sources but are very similar to extraterrestrial material. This figure is adapted from Fig. 4 in R.L. Korotev, Invited review Lunar geochemistry as told by lunar meteorites, Chemie der Erde 65, 297-346 (2005)
TiO 2 concentration observed in YDB microspherules and distant magnetic grains greatly exceeds concentrations in nearly all previously studied ET and volcanic spherules.
TiO 2 /Zr ratios in YDB magnetic grains ratios are comparable to lunar KREEP and higher than all terrestrial and impact layer sources except Laurentian Ocean Island basalt (LOIB). High TiO 2 /Zr ratios are also observed in chondrites, shergottites, and lunar feldspathic meteorites, although SAU-169 has a very low TiO 2 /Zr ratio.
H 2 O content in magnetic grains was measured by PGAA which is unusually sensitive to hydrogen in small samples. The concentration is high at all sites ranging up to 28 at. % H at Murray Springs. At Gainey the magnetic grains contain 18 at. % H compared to 5 at. % H in the adjacent sediment. Tektites and ET sources typically contain little H 2 O so it is likely that this excess must have a terrestrial origin. It appears that this water is trapped in the magnetic grains because they often will explode in a microwave oven. Large amounts of water ( ≤ 20 wt. %) have also been observed in granite silicate melt inclusions [43] suggesting that the water may have been trapped in the ejecta at the time of impact. This would be consistent with an impact into the Laurentide Ice Sheet north of Gainey combining ejecta with stream from the ice explosion.
Al 2 O 3 and FeO+MgO concentrations for magnetic grains, microspherules, terrestrial and ET sources are compared in Fig. 13. Microspherules and magnetic grains from the distant sites have Al 2 O 3 / FeO+MgO ratios similar to CI chondrites, shergottites, and lunar meteorites [33]. Magnetic grains from Gainey have Al 2 O 3 /FeO+MgO ratios comparable to crustal, oceanic, volcanic, and terrestrial impact layer values. The Al 2 O 3 /FeO+MgO ratios at Gainey are consistent with terrestrial composition from a nearby impact site, and the ratios at distant sites are consistent with an ET projectile composition.
CaO/Al 2 O 3 at Gainey (0.20) is comparable to crustal (0.24) and ocean trench (0.21) values. At distant sites, CaO/Al 2 O 3 values vary widely and are terrestrial at Topper (0.18) and Blackwater Draw
(0.23) At Wally’s Beach (0.51), Murray Springs (0.57), and Lommel (0.93) the CaO/Al 2 O 3 ratios are comparable to Lunar PKT (0.75), SAU-169 (0.65), and CI chondrite (0.81) values. However, total CaO and Al 2 O 3 concentrations at all sites are well below crustal or lunar abundance, possibly due to the magnetic selection, and the ratios may be contaminated by local sources. The CaO/Al 2 O 3 ratios are consistent with an ET origin at three of five sites.
SiO 2 concentration in magnetic grains is comparable at Gainey (60 wt. %) to the continental crust (67 wt. %) and ocean trenches (59 wt. %). At distant sites, except for Topper, SiO 2 concentrations vary from 34-51 % which is comparable to lunar meteorites (43-48 wt. %) [32], PKT (53 wt. %), and shergottites (49 wt. %). Topper values (5 wt. %) are much lower possibly indicating significant postimpact alteration of the magnetic grains at this site. Lower SiO 2 concentrations at some sites may also be an artifact of magnetic separation and no strong conclusions can be drawn from the SiO 2 concentration.
Na 2 O concentration is 3 wt. % at Gainey, which is similar to shergottites (2 wt. %), crustal (3.3 wt. %) and ocean trench (4 wt. %) values. At distant sites Na 2 O concentration varies from 0.1-0.8 wt. %, which is comparable to ET value in the lunar PKT (0.7 wt. %), SAU-169 (1.2 wt. %), lunar meteorites (0.3-0.5 wt. %), and CI chondrites (0.9 wt. %).
K 2 O concentration is 2.0 wt. % at Gainey, which is similar to crustal (2.8 wt. %) and ocean trench (2.1 wt. %) values. At distant sites, the K 2 O concentration varies from 0.2-1.1 wt. %, which is comparable to ET values in the lunar PKT (0.4 wt. %), SAU-169 (0.7 wt. %), and lunar meteorites (0.11.0 wt. %). Shergottites contain far less K 2 O (0.03 wt. %).
Cr 2 O 3 concentration is 0.06 wt. % at Gainey, which is slightly above the crustal (0.01 wt. %) and ocean trench (0.03 wt. %) values. At the distant sites, Cr 2 O 3 averages 0.25 wt. %, which is comparable to ET values in the lunar PKT (0.34 wt. %), SAU-169 (0.12 wt. %), lunar meteorites (0.1-1.0 wt. %), and CI chondrites (0.4 wt. %).
FeO/MnO ratios vary widely ranging from 34 at Gainey to 10-25 at distant sites. These ratios are lower than in the continental crust (50), CI chondrites (80), shergottites (38) and SAU-169 (38) and higher than in ocean trenches (3.5). Enrichment of MnO has been observed in Bahaman sediments following the previous four glaciations [5, 48] and MnO increased suddenly, from 0.3 wt.. % to 1.2 wt. %, in Pacific sediments at the onset of the YD [4]. YDB microspherules have a much higher average FeO/MnO ratio (75) that is comparable to the average (71.5) for a wide range of lunar meteorites [32].
Rare Earth Element (REE) concentrations normalized to volatile-free CI chondrite [3] as suggested by Korotev [32] are shown in Fig. 14 for YDB magnetic grains. YDB magnetic grains, lunar PKT, and lunar KREEP REE concentrations range between crustal and oceanic values.
Gainey magnetic grains have REE abundance ratios that are comparable to crustal and oceanic values. Unlike terrestrial sources, distant magnetic grains have a negative Eu signature comparable to lunar KREEP-rich brecchia [32]. Lunar feldspathic meteorites are very different with a positive Eu signature. Shergottites have REE chondrite ratios similar to chondrites.
Iridium is found in high concentrations in YDB magnetic grains and/or sediments at ten sites; Lake Hind (3 ppb), Murray Springs (2 ppb), Blackwater Draw (24 ppb), St. Mary (51 ppb), Topper (2 ppb), Carolina Bay T13 (4 ppb), Carolina Bay M31 (4 ppb), Carolina Bay M33 (2 ppb), Howard Bay (15 ppb) and Lommel (117 ppb). Iridium is below INAA detectable limits (~1 ppb) in 41 sediment samples taken – 52 –
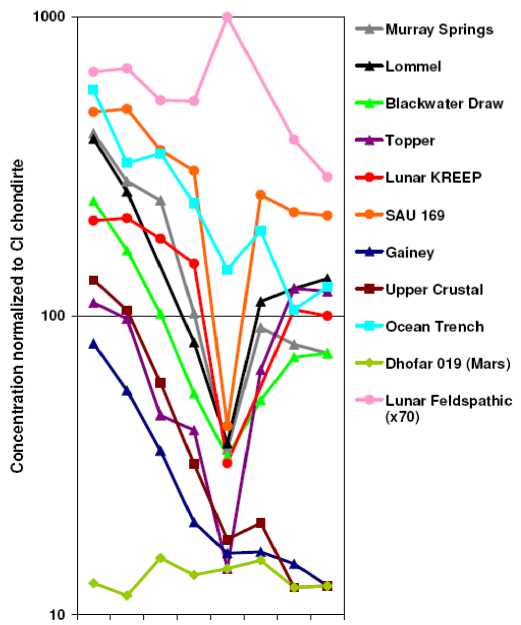
La Ce Nd Sm Eu Gd Yb Lu
Fig. 14. CI chondrite normalized rare earth (REE) concentrations at Murray Springs, Lommel, Blackwater Draw, and Topper have a negative Eu anomaly similar to that observed in lunar KREEP and SAU 169. Gainey and terrestrial crustal or oceanic sources have no Eu anomaly, lunar feldspathic basalts have a positive Eu anomaly, and Martian basalt meteorites have REE concentrations similar to CI Chondrites from above or below the YDB at various sites. Crustal iridium concentration is 0.02 ppb, although higher concentrations (0.5 ppb) have been observed in volcanic ash [27]. Iridium concentrations in the magnetic grains are lower than in CI chondrites (481 ppb) but comparable to that in the KTB (64 ppb) and lunar meteorites (≤25 ppb) [33]. High iridium concentrations in the YDB magnetic grains from many sites are classic evidence [2] that they are from an impact event.
Ni and Co concentrations only slightly exceed crustal abundance at most sites and Ni concentrations are much lower than in chondrite values. The Ni and Co concentrations are comparable to both the lunar meteorites and in shergottites.
Trace element concentrations in magnetic grains and SAU-169, normalized to crustal abundance, are shown in Fig. 15 . Heavy element (Hf, Ta, W, Th, and U) concentrations are terrestrial at Gainey and significantly exceed crustal values elsewhere.
They are comparable to SAU-169 for the distant sites. K 2 O/Th ratios for magnetic grains (Table 6) from Gainey (2200) are comparable to crustal values (2800), but much lower at distant sites (400) and comparable to values in the PKT (440), SAU-169 (410), and most lunar sediments (360) [42].
As and Sb concentrations at all YDB sites significantly exceed terrestrial and ET values but are similar to the KT and PT boundary layers. The reason for the enrichment of As and Sb in magnetic grains is unknown.
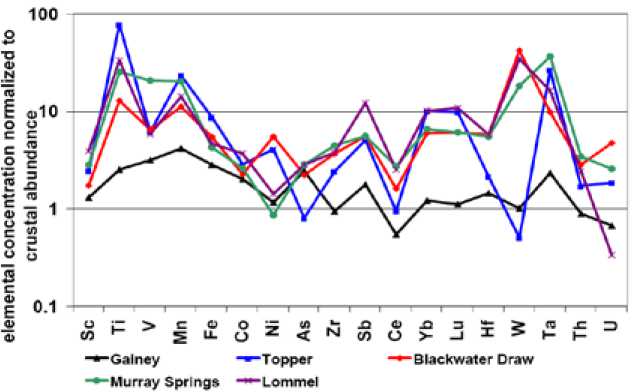
Fig. 15. Comparison of trace elemental concentrations normalized to crustal abundance for magnetic grains from various Clovis-age sites. Magnetic grains from Topper, Blackwater Draw, Murray Springs, and Lommel are very different from terrestrial sources but similar to each other. Gainey magnetic grains have trace elemental abundances similar to terrestrial values
Isotopic abundance ratios
Fe, Ti, and U isotopic ratios were analyzed by ICP-MS and TIMS. Samples were digested in high purity HNO 3 and HF with evaporation before analysis in 5 % (v/v) HNO 3 . All vessels and containers were acid washed in 10 % nitric acid overnight, rinsed with ASTM I water, and dried beforehand. 50Ti/48Ti ratios were determined by PGAA/INAA. Isotope abundance ratios 54,56,57,58Fe, 46,47,48.49,50Ti, and 238U/235U in YDP magnetic grains and sediments are consistent with normal solar system values (Table 6). The 234U/235U ratio is terrestrial at Wally’s Beach, but 234U is enriched by 50 % compared to equilibrium concentrations at Lommel and by 130 % at Murray Springs. 234U is often enriched by up to 15 % in seawater [12] and up to 50 % in river sediment [25], but 234U/235U enrichment in relict glacial lakes can exceed 500 %. The large 234U enrichment at Murray Springs may result from an airburst over a 234U-rich glacial lake near the Laurentide Ice Sheet.
40K/39,41K ratios in Clovis-age cherts and sediments were measured by gamma ray counting (40K), PGAA (39K), and INAA (41K). These cherts, found in fire pits at several Clovis sites, have a high density of impact pits and particle tracks on only one side as if they were bombarded from above [18]. 40 K abundance is enriched by a factor of «2 in samples with lowest total potassium concentration and the enrichment decreases with increasing potassium concentration. No 40K anomalies were observed in control sediments and cherts. Voshage [47] has shown that 40K abundance is enriched in iron meteorites by spallation up to 2000 x terrestrial abundance (0.012 %). Similar enrichments in 40K were also observed in cosmic rays [8]. Shimamura et al [38] reported a 40-70 % 40K enrichment in magnetic microspherules from South Pacific sediments. Analysis of lunar PKT sediment indicates that potassium concentration measured by the Lunar Prospector Gamma-ray Spectrometer (GRS) (40K) is consistently 50-100 % higher than «ground-truth» data (39K) [19]. Although this was attributed to GRS calibration error, it is also consistent with 40K enrichment. Addition of a small amount of highly enriched 40K to the YDB could notably increase the 40K/39,41K ratio, especially where the total potassium concentration is low. Anomalous 40K/39,41K ratios in the YDB layer are only consistent with an ET source.
Table 6. Fe, Ti, U, and K Isotope ratios. Uncertainties in the least significant digits are given in parenthesis
|
Iron |
54Fe/56Fe |
57Fe/56Fe |
58Fe/56Fe |
|
|
Terrestrial |
6.37 |
2.31 |
0.307 |
|
|
Gainey |
6.7(2) |
2.39(7) |
0.314(9) |
|
|
Murray Springs |
6.6(2) |
2.40(7) |
0.269(8) |
|
|
Wally’s Beach |
6.8(2) |
2.38(7) |
||
|
Morley drumlin |
6.7(2) |
2.39(7) |
||
|
Lommel-Maatheide |
6.6(2) |
2.38(7) |
||
|
Titanium |
46Ti/48Ti |
47Ti/48Ti |
49Ti/48Ti |
50Ti/48Ti |
|
Terrestrial |
11.04 |
9.95 |
7.24 |
6.93 |
|
Gainey |
11.1(3) |
10.0(3) |
7.1(5) |
6.5(22) |
|
Murray Springs |
10.9(3) |
9.8(3) |
7.5(5) |
6.6(6) |
|
Uranium |
238U/235U |
234U/235U |
||
|
Terrestrial |
137.88 |
0.0076 |
||
|
Wally’s Beach |
138.01(26) |
0.00760(11) |
||
|
Lommel-Maatheide |
138.03(12) |
0.01744(3) |
||
|
Murray Springs |
138.05(9) |
0.011353(12) |
||
|
NIST Standard |
137.8(5) |
0.00742(20) |
||
|
Potassium |
%K |
40K/39K |
40K/41K |
Ratio† |
|
Terrestrial |
2.09 |
0.000125 |
0.00174 |
1.00 |
|
Chert |
||||
|
Upper Mercer |
0.058 |
0.00024(8) |
1.9(6) |
|
|
Bayport |
0.061 |
0.000188(25) |
1.5(2) |
|
|
Sediment |
||||
|
Bay T13 |
0.075 |
0.0030(6) |
1.7(3) |
|
|
Murray Springs -1 |
0.18 |
0.0039(6) |
2.2(3) |
|
|
Topper-2U |
0.35 |
0.0020(2) |
1.2(1) |
|
|
Topper-2L |
0.36 |
0.0023(2) |
1.3(1) |
|
|
Topper-2L |
0.38 |
0.0023(2) |
1.3(1) |
|
|
Lommel |
0.57 |
0.0018(2) |
1.0(1) |
|
|
Bay M31 |
0.82 |
0.023(2) |
1.3(1) |
|
|
Lake Hind |
1.12 |
0.0015(2) |
0.9(1) |
|
|
Blackwater Draw - 1 |
1.30 |
0.0019(2) |
1.1(1) |
|
|
Wally’s Beach |
1.44 |
0.0023(2) |
1.3(1) |
|
|
Gainey |
1.75 |
0.000143(9) |
1.14(7) |
|
|
Murray Springs -2 |
2.30 |
0.0019(2) |
1.1(1) |
|
|
Murray Springs - 3 |
2.80 |
0.0018(2) |
1.0(1) |
|
|
Blackwater Draw-2 |
3.05 |
0.0016(2) |
0.9(1) |
|
|
Controls |
||||
|
Fossil Hill (Chert) |
0.045 |
0.000113(25) |
0.95(21) |
|
|
Onondaga (Chert) |
0.061 |
0.000119(10) |
0.90(8) |
|
|
Loomis-O (Sed) |
1.16 |
0.000124(4) |
0.99(3) |
|
|
Loomis-A (Sed) |
1.12 |
0.000129(4) |
1.03(3) |
|
|
Loomis-B (Sed) |
1.19 |
0.000124(4) |
0.99(3) |
|
|
Loomis-C (Sed) |
1.29 |
0.000124(4) |
0.99(3) |
|
† Ratio of measured 40K abundance to the terrestrial value
Analysis of carbon spherules and glass-like carbon
Table 7 shows the PGAA bulk analysis of carbon spherules from a Carolina Bay. As expected the carbon spherules are mostly carbon (82 ± 12 wt. %) but they contain a substantial amount of hydrogen (5.3 ± 0.8 wt. %), nitrogen (6.8 ± 1.1 wt. %), Al 2 O 3 (2.0 ± 0.4 wt. %), SiO 2 (2.2 ± 0.4 wt. %), and several other impurities with <1 wt. %. The high atomic ratio of hydrogen to carbon C 10 H 8 in carbon spherules is slightly less than C 12 H 20 for copal (amber) spherules usually found with the carbon spherules. Carbon spherules can be formed from tree sap in high temperature forest fires suggesting that these spherules were formed in fires following the YD impact. Kennett et al [30] have reported the presence of nanodiamonds inside of some carbon spherules. Nanodiamonds cannot be produced by forest fires indicating that some carbon spherules were produced directly by the impact. It is likely that both impact and forest fire carbon spherules were produced during the YD impact event. The high concentration of nitrogen impurity is consistent with formation of the carbon spherules in an airburst, and the high TiO 2 (0.09 wt. %) and FeO (0.2 wt. %) concentrations are consistent with the magnetic grain chemistry suggesting that the carbon spherules formed amidst the exploding impact ejecta.
Table 8 shows the PGAA bulk analysis of glass-like carbon from a Carolina Bay. The glass-like carbon is also mostly carbon (90 ± 1 wt. %), with significant amounts of hydrogen (3.0 ± 0.1 wt. %), and SiO 2 (4.8 ± 0.1 wt. %). The hydrogen to carbon ratio C 10 H 4 is lower than for carbon spherules and consistent with the formulation expected for burning wood in the absence of air. This formulation is not very different from charcoal C 7 H 4 O which should also be produced at the same time. Unlike carbon spherules glass-like carbon lacks significant nitrogen content suggesting that it was formed from trees burning under anaerobic conditions in the shockwave from the impact. This is consistent with a sample that we found where glass-like carbon on one side of sample graded into yellow pine on the other side suggesting that a very hot wind had passed through the sample. Significant amounts of SiO 2 and TiO 2 (0.067 wt. %) may have been carried into the sample by the shockwave.
Discussion
The geographical distribution and composition of the magnetic grains are consistent with an airburst 12.9 ka ago near the Great Lakes of an object unusually enriched in titanium and other incompatible elements. Terrestrial-like ejecta fell close to an impact site near Gainey while projectile-rich ejecta fell farther away. High water content in the ejecta favors an airburst over the Laurentide Ice Sheet north of Gainey. This is also consistent with the thinness of the YDB impact layer suggesting that relatively little terrestrial ejecta were created due to shielding of the airburst from the ground by the ice sheet. Microspherules from various sites including Gainey and magnetic grains from Wally’s Beach, Murray Springs, Blackwater Draw, Topper, and Lommel sites were unusually enriched in TiO 2 with TiO 2 /FeO, TiO 2 /Zr, REE/chondrite, Al 2 O 3 /FeO+MGO, CaO/Al 2 O 3 , K/Th, FeO/MnO, and 40K/K ratios and SiO 2 , Na 2 O, K 2 O, Cr 2 O 3 , Ni, Co, Ir, and trace element abundances that are comparable to lunar KREEP and inconsistent with other terrestrial or meteoritic sources except for meteorite SAU-169 whose KREEP-like composition is attributed to a lunar Procellarum KREEP Terrane origin. The unusual KREEP-like composition of the object that impacted Earth 12.9 ka ago has never been observed in meteorites before. It seems unlikely to have come directly from the moon however it is coincidental that SAU-169 fell in Oman near the time of the YD impact [20].
Table 7. PGAA analysis of Carolina Bay carbon spherules
|
Element |
Wt. % or ppm |
|
H 2 |
5.3 % |
|
B |
61 ppm |
|
C |
82 % |
|
N |
6.8 % |
|
Al 2 O 3 |
2.0 % |
|
SiO 2 |
2.2 % |
|
S |
0.39 % |
|
Cl |
0.073 % |
|
K 2 O |
0.12 % |
|
CaO |
0.5 % |
|
TiO 2 |
0.09 % |
|
FeO |
0.2 % |
|
Cu |
0.06 % |
|
Cd |
0.8 ppm |
|
Sm |
0.8 ppm |
|
Gd |
0.9 ppm |
Table 8. PGAA analysis of Carolina Bay glass-like carbon
|
Element |
Wt. % or ppm |
|
H 2 |
3.0 % |
|
B |
10.2 ppm |
|
C |
90 % |
|
N |
0.66 % |
|
Al 2 O 3 |
0.97 % |
|
SiO 2 |
4.8 % |
|
Cl |
181 ppm |
|
K 2 O |
120 ppm |
|
CaO |
0.49 % |
|
TiO 2 |
0.067 % |
|
Cd |
0.22 ppm |
|
Sm |
0.19 ppm |
|
Gd |
0.22 ppm |
Analysis of carbon spherules found in the YDB layer at many sites indicates that they were likely formed both from the impact and from extensive hot forest fires ignited by the ensuing atmospheric shockwave and falling hot debris. Evidence of nanodiamonds in carbon spherules which is only consistent with an impact event will be discussed in later papers. High concentrations of soot, evidence of very high temperature burning following the impact, were found in the YDB at several sites [16] and will be discussed elsewhere. Similarities in the bulk composition of carbon spherules and associated copal (amber) spherules suggest that these spherules were produced by the high temperature burning of tree sap. Glass-like carbon and charcoal found in the YDB at many sites appears to have been produced by the burning of trees under low oxygen conditions as the YD impact atmospheric shockwave raced across North America. The black mat which overlays the YDB layer at many sites, marking the point above which no megafauna fossils or Clovis points are found, was not formed by the impact but instead appears to consist mainly of algal material produced by dying organic matter and burned material. It is likely that the YD impact caused the failure of the Laurentide Ice Sheet sending large quantities of ice into the North Sea, shutting down the thermohaline ocean circulation, and initiating 1300 years of Younger Dryas cooling. This was accompanied by the injection of dust and water into the upper atmosphere blocking sunlight for an extended period of time and lowering temperatures suddenly. The impact event followed by extensive fires and sudden climate change likely contributed together to the rapid extinction of the megafauna and many other animals.
No impact crater has yet been identified with the YD impact. Toon et al . [44] suggest that it requires an airburst with energy of 107 megatons, a>4 km-wide comet, to cause continent-wide destruction on a scale observed at the YDB. Such an object undoubtedly would have left a significant crater. We have speculated that multiple 2-km objects struck the 2-km thick Laurentide Ice Sheet at a low angle leaving negligible traces after deglaciation. A problem with this argument is that it would require at least eight – 57 –
Abort .Seo
Bt/on i IB?1
Seton Sia XlertfAMl
Ab«rt 56» Ltrd56ti
About sw LeveJoar haqoro ГоПа /М "fh^ ^t^^'
Death Valley282’
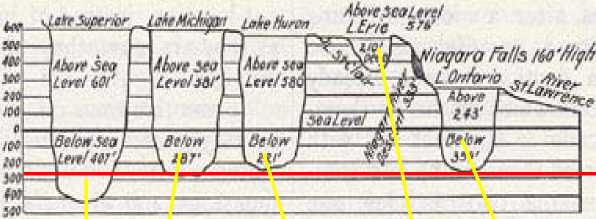
Chosh Skctiox or Great Lakkh
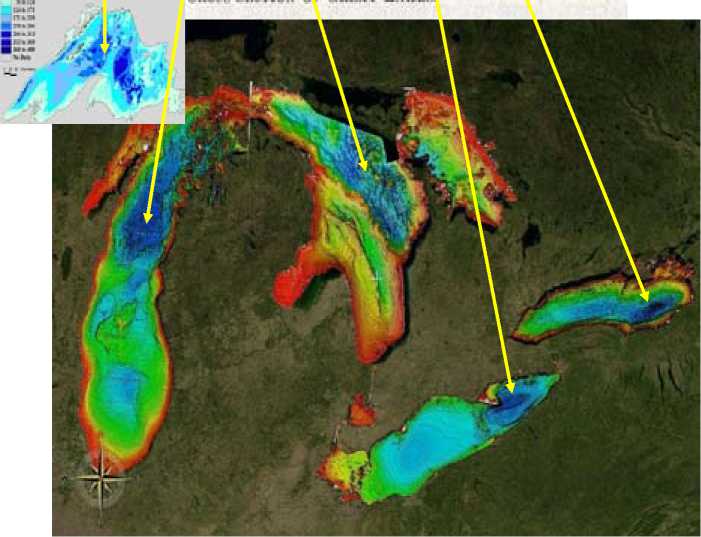
Fig. 16. NOAA bathymetry maps of the Great Lakes indicate four deep holes in the Lakes Superior, Michigan, Huron, and Ontario that may be YD impact craters. Three of these holes are the lowest points in North America, deeper than Death Valley. The origin of these holes in unknown and they are unlikely to have been formed by glacial action
such objects and it seems unlikely that none of these would leave a lasting mark on the planet. Another possibility is that the impact left craters that have yet to be recognized. Fig. 16 shows a depth profile of the Great Lakes where it has long been known that four of the deepest holes in North America exist in Lakes Superior, Michigan, Huron and Ontario. Three of these holes are deeper than Death Valley. They are unlikely to have been caused by the action of glaciers or moving water [10]. The Finger Lakes region of New York radiate out from the hole in Lake Ontario as if they were formed by the force of the impact pushing water and ice to the south. Charity Shoal, shown in Fig. 17, has been identified as a smaller, 1-km crater in Lake Ontario of approximately the correct age to be associated with the YD impact event [26]. Further research is necessary to prove that these Great Lake basins are the craters from the YD impact event.
Toon et al [44] also noted that the impact of a >4 km-wide comet is expected to occur only once every few million years. This estimate is based largely on solar system cratering rates and has little – 58 –
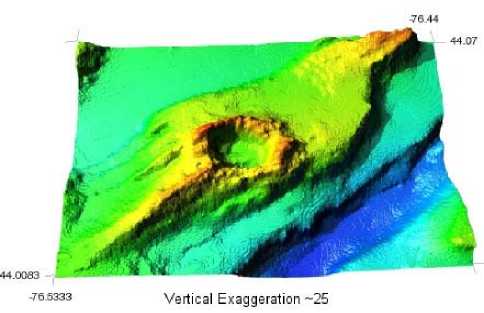
Fig. 17. NOAA bathymetry image of Charity Shoal, a 1-km diameter crater, in Lake Ontario. It dates approximately to the time of the YD impact and sits directly above a magnetic anomaly relevance to the timing of the YD impact. Culler et al [9] determined the ages of lunar microspherules, many enriched in TiO2, by 40Ar/39Ar dating and found that lunar impacts began increasing dramatically 400 Ma years ago and peaked very recently. These results were not corrected for lunar 40K/K ratios which would make this increase even more recent and dramatic. It appears that Toon et al’s estimate could be off an order of magnitude too high.
Acknowledgements
This work was supported, in part, by the U.S. Department of Energy under contract DE-AC02-05CH11231. The authors thank C. Vance Haynes (University of Arizona), B. Kooyman and colleagues (University of Calgary), Jane Pike-Childress (BLM), M. Boyd and colleagues (Lakehead University), G. Howard, D. Kimbel, and W. Newell for providing samples, helpful comments, and/or access to their research sites. We especially thank Jim Bischoff (USGS) and Ross Williams (LLNL) for analysis of the uranium isotopic abundances. M. Gifford is thanked for help with ICP-MS analyses. We thank Henry Wright (University of Michigan) and Denise Henry and Terrence Rettig (NSF) for their encouragement early in this project. J. Talbot (K/T GeoServices, Inc.), B. Cannon (Cannon Microprobe), J. Edwards (Process NMR Assoc., LLC), E. Hoffman (Activation Laboratories. Ltd.), J. Feathers and J. Johnson (Luminescence Dating Lab, University of Washington), S. Simpson (Becquerel Laboratories), and J. Southon (Keck Carbon Cycle AMS Facility) were very helpful analyzing research sample.
