Analysis of using of energy resources by educational institutions of Nizhny Novgorod region

Author: Sbitnev E.A., Osokin V.L., Mikhaylova O.V.
Journal: Вестник аграрной науки @vestnikogau
Article in issue: 2 (47), 2014.
Free access
In work the analysis of use of energy resources is carried out. Object of research were educational institutions of the Nizhny Novgorod Region. Result of research is the revealed potential of irrationally used volume of energy resources in the form of thermal energy, the electric power, firm and liquid types of fuel, motor fuel, and also water. Capital costs of energy saving actions will make about 239,644 million rubles, with a payback period is about 3.64 years. These figures show the enormous potential which can be used in educational institutions having aimed it at the development of material base for the purpose of improvement of quality of rendered educational services.
Energy efficiency, energy audit, energy carriers, protection device, region, economic potential, efficiency
Short address: https://sciup.org/147124540
IDR: 147124540 | UDC: 338.28
Text of the scientific article Analysis of using of energy resources by educational institutions of Nizhny Novgorod region
The state program of the Russian Federation «Energy-saving and increasing of energy efficiency for the period till 2020» (in edition of Resolutions of the Government of the Russian Federation from 18.08.2011 N 688) is defined that the main aim of economic and social development of the country is essential decrease in the share of energy cost, decrease in loading on payment of services on the budgetary system and enhance the competitiveness and financial stability of the Russian economy, providing the population with high-quality power services at reasonable prices [1].
Due to the above it is extremely important to study the influence of technical solutions during operation of urban, regional and other kinds of energy systems and complexes, their financial, economic and investment indicators and regional economy. For the evaluation of such impact the staff of the Center of energy audit of the Nizhny Novgorod state engineering-economic institute investigated energy efficiency of educational institutions of the Nizhny Novgorod Region.
The survey was carried out in 138 institutions of various forms of education: professional schools; technical schools; colleges; institutions of additional education; boarding schools; orphanages. The complete list of institutions that received energy survey is given in the report on research work № 1/01201279101 [2].
Rules for conducting an energy survey imply that as fiscal (basic) year you select the last full calendar year before the date of preparation of energy passports, in accordance with the Decree the Ministry of energy of Russia № 182 from April 19, 2010 « On approval of the requirements to the energy passport, compiled on the results of mandatory energy audit and energy passport composed on the basis of the project documents and rules of sending a copy energy certificate based on the results of mandatory energy survey» [3].
During the preparation of energy passports the following systems were analyzed: power supply, heat supply, water supply, and consumption of motor fuel and gas. As an example, the characteristics of energy and water consumption of «Nizhny Novgorod pedagogical college after the name of K.D. Ushinsky» are given.
Table 1 - Energy and water consumption in 2011
|
Year |
Electric energy |
Heat energy |
Househ ol d and dr i n king w at er |
|||
|
K.W.H |
thousand rubles |
Gcal |
thousand rubles |
m3 |
thousand rubles |
|
|
2011 |
98024 |
419,8 |
1057 |
907 |
2196 |
84,5 |
On Figure 1 the percentage ratio of expenditure on e ne rgy a n d w a te r co n su m e d in 2011 is clearly shown.
Heat energy 64,3%
Household and drinking water 6,0%
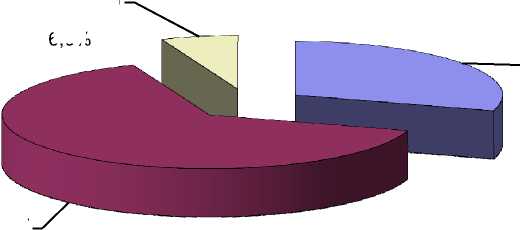
E l ect r i c energy 29,7%
Figure 1 - t h e Ratio of expend it ure on energy and water in 201 1
B a se d o n a su r v ey o f e d u ca tio n a l in stitu tio n s of Niz h ny Nov go r o d r egio n , th e f o llo win g conclusions were made:
-
- in educational inst itu tio n s of a v e r ag e 5 g r o u p s of e le ctr icity co n su m e rs a r e p r e v a ile d : lighting (50-70 %); consumers with electric motors (10- 3 0 %); hea ting in sta lla tio n ( 1 0-20 %); office equipment and laboratory stands (10 %).
-
- Registration of energy consumption is mad e by u sin g m ete r s of a c tiv e e n e rgy .
-
- Electric e nergy s up p ly of co n sum e r s : fro m it s TA are 1 2 o bj e cts , fr om TA , w h ich is o n the b a la n ce of p o w e r sup p lie r s a r e 1 0 3 o bj e ct s an d co m b in e d m eth o d ar e 5 o bj e ct s.
The results of energy audits and the analysis of th e r e ce iv e d da ta helped to rank ins titu tio ns a cco r d ing t o th e fo llo win g cr ite r i a : sp e ci f ic e n e rgy co n su m p tio n, sp e ci f ic consumption of heat energy, specific consumption of water and specific fu e l con s um p tio n b y boiler-houses.
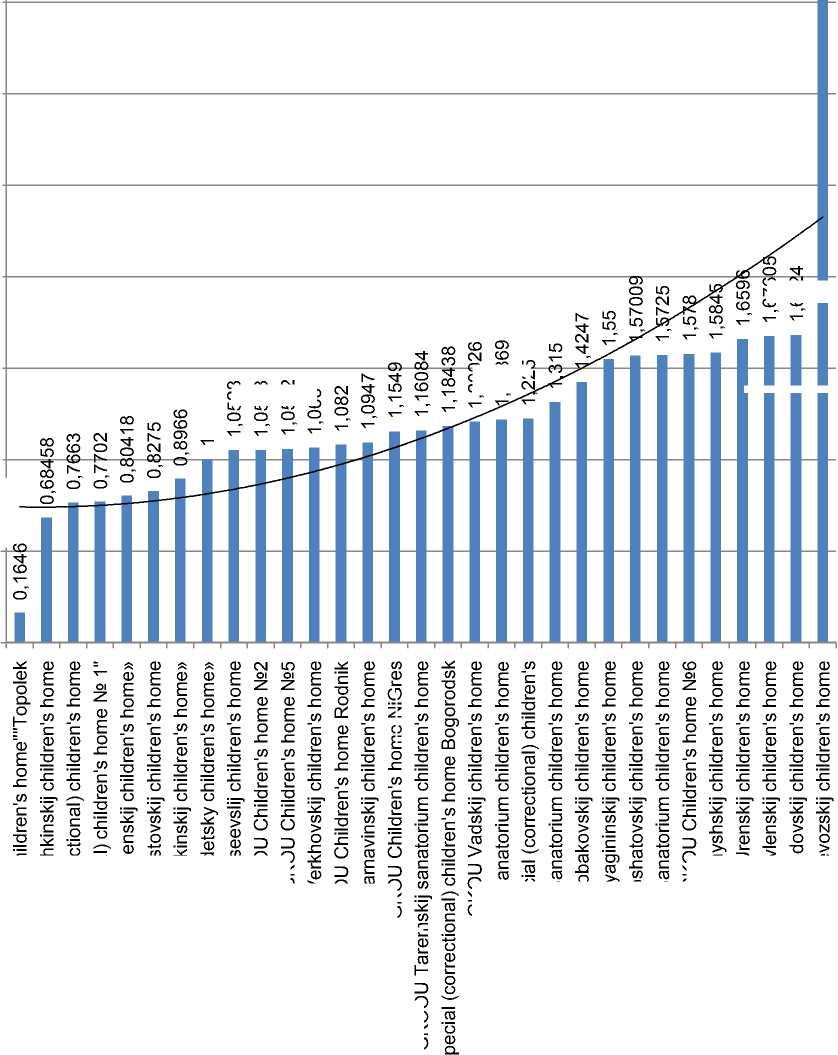
As an example, the data for r a nk ing of ch ild r e n' s h om es acco r d ing to th e sp e ci f ic consumption of electric energy is given (Fig. 2). I f y o u ta k e a lo n ger p e r io d , f o r e x a m p le for f iv e y e a r s, y o u ca n fo llo w th e d y n am ic s of co n sum pti on a n d e n e rgy costs a n d w a te r .
Table 2 - Energy and water consumption in 2007-2 0 11 G K O U «G oro det sky ch il dr en's hom e»
|
Name |
Unit of measurement |
Anal y z ed peri od |
||||
|
2007 |
2008 |
2009 |
2010 |
2011 |
||
|
Energy power |
||||||
|
Consumption |
thousand K.W.H |
93,918 |
107,118 |
88,875 |
89,040 |
68,000 |
|
Costs with VAT |
thousand rubles |
236 |
268,1 |
288,3 |
336,3 |
280,7 |
|
POL |
||||||
|
Consumption |
Thousand L |
5,994 |
8,9125 |
11,5357 |
10,7209 |
8,14696 |
|
Costs with VAT |
thousand rubles |
95,017 |
169,36 |
200,184 |
217,189 |
190,544 |
|
Heat energy |
||||||
|
Consumption |
Gcal |
658 |
660 |
587 |
935 |
715 |
|
Costs with VAT |
thousand rubles |
617,6 |
750,2 |
755,6 |
1328,4 |
1152,5 |
|
Cold water and wastewater |
||||||
|
Water consumption |
thousand m3 |
1,977 |
2,765 |
2,102 |
2,529 |
2,981 |
|
Amount of wastewater |
thousand m3 |
2,193 |
2,976 |
5,077 |
5,076 |
4,296 |
|
Costs with VAT of cold water |
thousand rubles |
23,8 |
39,8 |
38,3 |
51,0 |
68,8 |
|
Costs with VAT of wastewater |
thousand rubles |
36,1 |
57,9 |
118,8 |
133,3 |
129,6 |
|
Total costs |
thousand rubles |
1008,517 |
1285,36 |
1401,184 |
2066,189 |
1822,144 |
4,5
сч
y = 0,0019x2 - 0,0066x + 0,747 R² = 0,6165
3,5
2,5
1,5
0,5
О
Е ф Е со см г- оо со со
Е
О)
т
О
CD
О)
V)
со
О)
V)
О)
СО
V)
со
О)
т
V)
СО
Q
ф
о
о
о
о
о
о
о
о
о
о
о
о
о
о
о
о
о
о
о
о
о
о
о
о
о
N
Ф N Q
Е ф
Е ф tn
О
оо оо см см см о> со со со со со
сп 00 со о X— СМ
OI OI
о о
о о
о о
о
о
о
Figure 2
-
Data for ranking of children's homes according to the specific consumption of electric energy
Analyzing the data fr o m all ob j e cts we can co n cl u de t ha t 63 % of th e costs n e ce ssar y for h eat e n ergy , 1 5 % fo r e le ctr icity, 1 1% fo r c old w a te r a n d w a ste w a te r , 11 .5 % f or fu e ls a nd lub r ic an ts. Figur e 3 sh o w s th e a na ly s is of th e to ta l co st of e n ergy a n d w at er fo r 20 0 7 -2011.
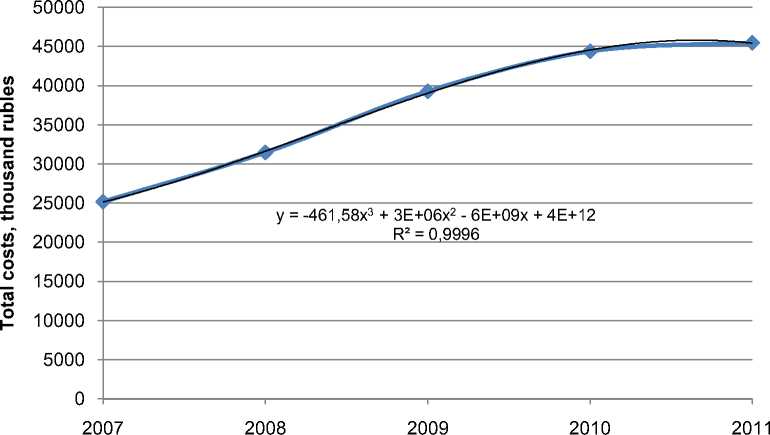
Figure 3 - Analy si s of t h e tot al c ost of energy and water duri ng the accou nt i ng pe riod (2 007-2011)
On th e g r a p h y o u ca n s e e th e th e or e tica lly co n str u c te d s m o o th ing a p p r ox im a te cu r v e described by polynomial equation with the size of reliability and a p proxi m ation. We also analyzed the costs of energy and water of in stitut io n s o f o n e k in d . A s a n e x a m p le, the costs of children's homes are given. Du r ing th e a cco u n t ing p er io d w e ca n se e i n cr e a sing in e n e rgy costs. In 2011, compared with 2007, expenses in th e a mo u nt in cr e ase d o n 5 5 .33 %. Inc r e a sing in en e rgy co sts ass oc iat ed pr im a r ily with th e g r o w th o f ta r i ffs a n d th e ir ir r a tio n a l using.
C ha n ging in th e v o lum e of con sum ptio n of h e a t e n e rgy b y in stitu tio n s is ch arac ter iz e d by duration of heating period and th e a v e r a g e o u t sid e te m p e r atu r e d ur in g th e h e a ting p e r io d . Th e v a lu e of a n n u a l h e a t e n e rgy co n su m ptio n d ir e ctly d e p e n d s o n w e a th er con d itio n s d u r i ng the y e a r , a s w e ll a s th e sta te of th e e n clo sin g s tru ctu r e s . In th e p er io d fr om 2 0 0 7 -2009 costs increased du e to th e gro w th of th e ta r i ff fo r h e a t e n ergy , a s w e ll a s w ith in cr e a se d con s um ptio n in th e a n a lyz e d p e r io d d u e to th e h e a t lo ss th r o ugh th e d e st ru ctio n of e n clo su r e in the p r o ce ss of e x p lo ita tio n. In 2 01 1 , th e red uctio n in co n su m ptio n is d e te rm in e d b y th e pa r ti al r e pa ir of b u ild in gs a n d co n s tr u c tio n s in th e in stitu tio n s a n d a lso b y in d ivid u a l sta r ting in some institutions by their own boiler rooms using as fuel - n a tur a l gas. In f i gu r e s 4-5 the typical heat loss through the building enclosure is illustrated.
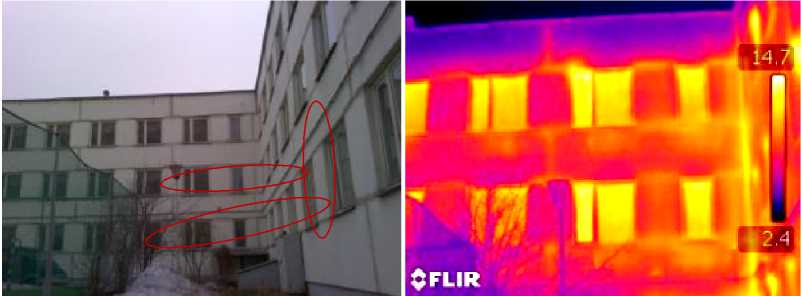
Figure 4 - The rm ov ision sh oot i ng of enclosure of educ at io na l bu il di ng
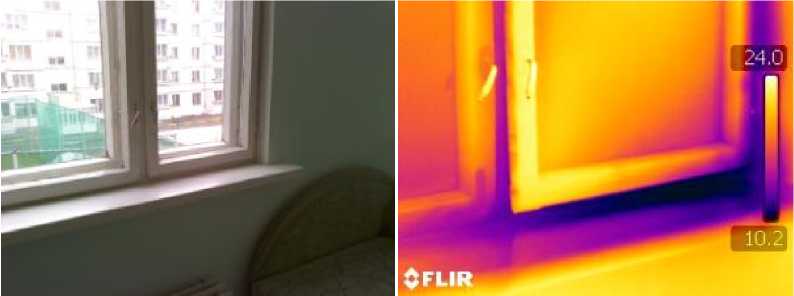
Figure 5 - Thermovision shooting of window opening of educational building
Consumption and costs of natural gas also in dynamics of the period under consideration grow.
Table 3 - Energy and water consumption of children's homes in 2007-2011
|
Name |
Unit of measurement |
Analyzed period |
||||
|
2007 |
2008 |
2009 |
2010 |
2011 |
||
|
Electrical energy |
||||||
|
Consumption |
thousand K.W.H |
3452,149 |
3359,604 |
3251,850 |
3282,048 |
3414,297 |
|
Costs with VAT |
thousand rubles |
7456,385 |
9011,151 |
10786,829 |
12988,679 |
14755,122 |
|
Natural gas |
||||||
|
Consumption |
Thousand m3 |
173,530 |
464,941 |
473,934 |
593,277 |
615,485 |
|
Costs with VAT |
thousand rubles |
359,173 |
1438,134 |
1430,188 |
2334,490 |
2367,670 |
|
Heat energy |
||||||
|
Consumption |
Gcal |
10528,338 |
11304,410 |
12607,930 |
12516,687 |
11794,476 |
|
Costs with VAT |
thousand rubles |
9864,860 |
12258,440 |
16932,421 |
18157,912 |
16230,072 |
|
Consumption (subabonents) |
Gcal |
707,000 |
707,000 |
707,000 |
738,000 |
0,000 |
|
Costs with VAT (subabonents) |
thousand rubles |
0,000 |
897,012 |
939,727 |
1011,692 |
1184,166 |
|
Hot water supply |
||||||
|
Consumption |
Gcal |
0,000 |
32,922 |
65,608 |
86,229 |
91,898 |
|
Costs with VAT |
thousand rubles |
0,000 |
18,870 |
38,700 |
29,230 |
130,240 |
|
Coal |
||||||
|
Consumption |
ton |
448,660 |
397,300 |
518,035 |
574,655 |
595,480 |
|
Costs with VAT |
thousand rubles |
1208,916 |
1079,227 |
1378,260 |
1365,190 |
1698,120 |
|
Consumption (firewood) |
ton |
32,000 |
34,000 |
65,000 |
52,000 |
50,000 |
|
Costs with VAT (firewood) |
thousand rubles |
13,000 |
14,300 |
35,750 |
28,600 |
27,500 |
|
POL |
||||||
|
Petrol |
l |
189245,7 |
198182,78 |
206879,24 |
204912,33 |
188739,178 |
|
Diesel oil |
l |
659 |
636 |
732 |
273 |
532 |
|
Costs with VAT |
thousand rubles |
3200,39142 |
3949,60166 |
3991,92841 |
4301,40577 |
4803,64035 |
|
Cold water and waterwaste |
||||||
|
Water consumption |
thousand m3 |
2523,1056 |
2174,3322 |
2524,1724 |
3481,5138 |
1256,5083 |
|
Costs with VAT of wastewater |
thousand rubles |
3042,439 |
3673,35 |
4648,467 |
5155,88 |
5430,479 |
|
Total cost |
thousand rubles |
25145,164 |
31443,073 |
39242,543 |
44361,387 |
45442,843 |
Consumption and costs of natural gas also had grown in dynamics of this period. In dynamics of 2007-2011 the consumption of cold water decreased and increased, and then in 2011, there was a sharp decline due to the reduction of the indwelling children. The cost on cold water had increased because of increasing of tariff on cold water.
In the consumption and the cost of fuel in the analyzed period there was a growth in 2007-2009, then consumption began to reduce in 2009-2011. This process is connected with reduction of quantity of pupils and visits in accordance with the curriculum of institutions. The increasing of costs is directly proportional to the increasing of motor fuel cost.
In the balance of cost of institutions on energy and water the b as ic share is fitted on heat energy (35.72 %), then electricity (32.47 %), cold water (11. 9 5 %) , POL (10.57 %), natural gas (to 5.21 %), coal (3.74 %), water (0,29 %) and firewood (0.0 6 %) .
R ed u ctio n o f e le ct r i city c o n su m p tio n in th e p eriod f r o m 2 00 7 to 2 0 1 1 is determined by reduction of children and using of energy saving lighting lamps.
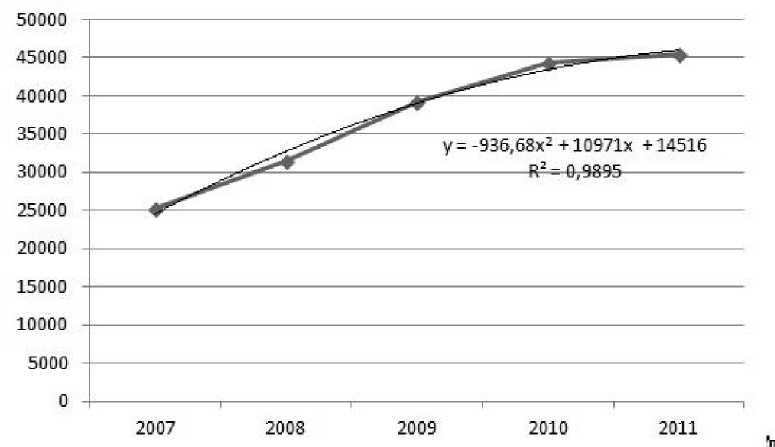
Figure 6 - Analysis of the total energy and water cost of the children's homes duri ng t he analyzed period (2007-2011)
Having analyzed the schedule of the total cost on Fig . 3 a n d Fi g. 6 it i s p o ssib le to make conclusion about steady increasing.
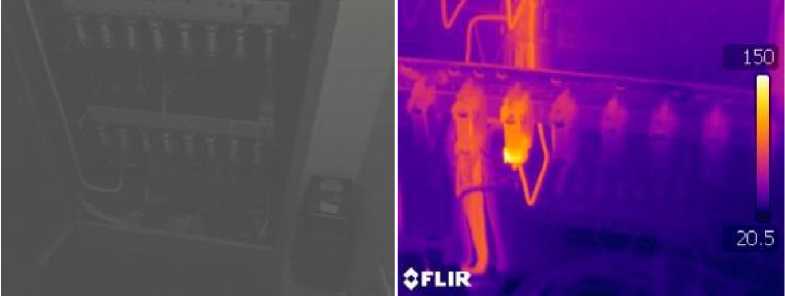
Figure 7 - The results of thermography RU-0.4 K.W.H
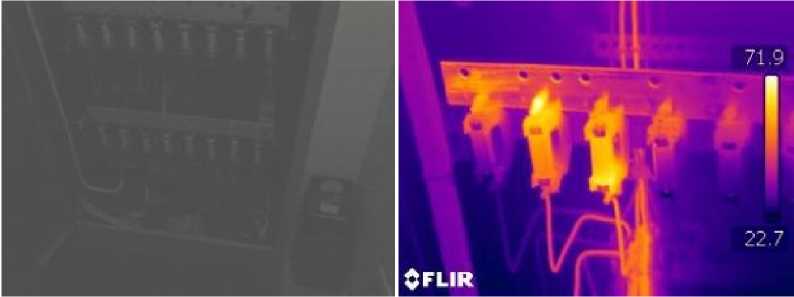
Figure 8 - The results of thermography RU-0.4 K.W.H
Energy audit of institutions allows revealing the factors determining the level and dynamics of the economic process, and also during the energy survey, the main aim is to identify potential energy-saving by reducing the consumption of resources without prejudice to the sanitary regulations and quality of educational services.
Deviations of protective devices were revealed during the occasional heat engineering measurements by portable devices and thermography. On Figures 7-8 the typical surfaces and the results of thermography RU-0.4 K.W.H are shown.
There is known protective device designed for protection from short circuit and large over-current, containing two motionlessly fixed contact sponges and fuse with a fusible insert ended at the ends of two round pins that are inserted into a motionless enshrined sponge. We developed and declared in FIPS issue of the patent of the Russian Federation on useful model (registration No.2012126479 from 25.06.2012), the protective device. The construction of offered protective device is given in fig. 9.
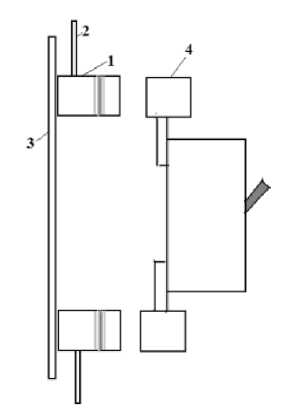
Figure 9 – Construction of the proposed protective device:
1 - contact sponges; 2 - power pins; 3 - fasteners of protective device; 4 - round contacts
This construction is created on the basis of the switching device of manual control, capable of including, carrying and breaking currents in electric circuits with voltage up to 400 V, frequency 50 Hz, in normal operating conditions, in the conditions of work overload, and briefly hold supercurrents of short circuits.
Technical and economic effect of the offered device is that the modernization occurs almost without interruption of power, because the removable part of the device with automatic breaker mounted in advance and the whole process of modernization is reduced to removing of safety devices and insert of automatic breaker. Moreover the maintenance of the device is simplified. It should also be noted that unlike a fuse, the offered device is ready for the next use after cooling plate.
Let's consider the economic part using this device on the example of GBOU VPO NGIEI.The cost of a fusible insert of a safety device of PPNI-37, dimension 2, 40A IEK of DPP40-040 is from 152 to 213 rub/pieces, and cost of automatic breaker AE 2044 50A is 110 rub/pieces [5]. Costs are accepted in the amount of 30-40%, and the overhead costs - 1015% from price, respectively we receive 117000 rubles. Capital investments in the new technical will make 84700 rub. During transition, in process of failure of the known fuse, on the offered protective device we will receive economy of 32.3 thousand rubles.
Economic effect in a general view (rub) will make:
E= C1-C2=32.3, where C1 – costs in the first variant, rub; C2 – costs in offered variant, rub.
Production effect in a general view (rub):
Epr= ∆Dpr+Ec=18405+5522=23927, where ∆Dpr – the size of the reduced (probabilistic) material damage from application of technical solution, rub; Ec – economy costs for operation of electric networks (on transport costs, reduction of losses of electric power, etc.), rub.
Probabilistic size of reduction of material damage (rub):
∆Dpr = Dsp⋅ (CLb– CLp) ⋅ Ld= 18405, where Dsp – specific probabilistic damage from breaks in electricity supply, rub/K.W.H. (∆Dpr = 4, rub/K.W.H.); CLb и CLp – the annual duration of clearings in all elements respectively in basic and project variants; Ld– design load, K.W.H. Average design load is 45 K.W.H.
One of the results of the conducted energy survey is revealed potential of irrationally used size of energy resources in the form of heat energy, electricity, liquid and solid fuels, motor fuel and also water.
On each resource institutions offered actions for reduction of their use. In general institutions of education have the potential to reduce the consumption of electric energy amounted in – 5021,844 thousand K.W.H.; heat energy – 23338,112 Gcal; natural gas – 469,579 thousand m3; liquid and solid fuels – 824,402 tons; motor fuel – 335,02 thousand liters; waters – 115,41 thousand m3, worth in monetary terms - 65,885 million rubles.
Capital costs of energy saving actions will make about 239,644 million rubles, with a payback period is about 3.64 years. These figures show the enormous potential which can be used in educational institutions having aimed it at the development of material base for the purpose of improvement of quality of rendered educational services.
References Analysis of using of energy resources by educational institutions of Nizhny Novgorod region
- The state program of the Russian Federation «Energy-saving and increasing of energy efficiency for the period till 2020». It is approved by Resolutions of the Government of the Russian Federation from 27.12.2010 №. 2446-r.
- Report on research work № 1/01201279101»Monitoring of using energy resources and development of offers on energy saving educational institutions of Nizhny Novgorod Region». Knyaginino, GBOU VPO NGIEI, 2013. -332 pages.
- Methodology for conducting energy surveys of educational institutions. N.Novgorod, NGTU, 2009 -189 pages.
- The decision on issue of patent for useful model 28.03.2013, application № 2012126479/07(040871) from 25.06.2012.
- Electronic source: http://perm.pulscen.ru/products.
