Analytical and experimental research of structural organization of heat-insulating construction materials

Author: Shaumarov Said S., Adilhodjayev Anvar I.
Journal: Журнал Сибирского федерального университета. Серия: Техника и технологии @technologies-sfu
Article in issue: 8 т.12, 2019.
Free access
The article is devoted to the determination of the fractal dimension of the porous surface and further finding the relationship of the fractal dimension with the porosity of cellular concrete. A numerical experiment was carried out aimed at determining the fractal dimension of the structure of cellular concrete in order to clarify the relationship of the latter with its porous structure. An approach has been developed to assess the properties of cellular concrete based on the analysis of its image.
Fractal dimension, cellular concrete, structural simulation, porosity
Short address: https://sciup.org/146281404
IDR: 146281404 | UDC: 691.33 | DOI: 10.17516/1999-494X-0191
Аналитическое и экспериментальное исследование структурной организации конструктивно-теплоизоляционных строительных материалов
Статья посвещена определению фрактальной размерности пористой поверхности и дальнейшего нахождения связи фрактальной размерности с пористостью ячеистого бетона. Выполнен численный эксперимент, направленный на определение фрактальной размерности структуры ячеистых бетонов с целью выяснения связи последней с его пористой структурой. Разработан подход к оценке свойств ячеистого бетона на основании анализа его изображения.
Text of the scientific article Analytical and experimental research of structural organization of heat-insulating construction materials
Improving energy efficiency and energy saving of buildings and structures is a priority in the energy policy of Uzbekistan. In this regard, the production on an industrial scale of energy-efficient, inexpensive and environmentally friendly structurally-insulating building materials is one of the urgent problems of construction science [1-3].
Successful implementation of such tasks in the field of civil engineering urgently requires the development of a new methodological approach to the creation of building materials for external enclosing structures with specified sets of properties. To develop a technique for modeling properties, a material was chosen that has a developed porous structure – cellular concrete, represented by various types of pores: capillary, large, conditionally closed, and gel. When implementing this task, an assumption was introduced that cellular concrete is represented as a quasi-homogeneous medium, as a set of packed particles and with integral physical characteristics [4-6].
The properties of building materials, including heat insulating materials, are determined both by the state of the structure of substances from which they are produced and by the macrostructure formed as a result of technological conversion. According to [7], the optimal structure corresponds to the complex of the most favorable indicators of the building and operational properties of the conglomerate. On this basis, the optimal structures of cellular concrete include those that are characterized by maximum values of porosity with a uniform distribution of pores and aggregate by volume [8, 9].
In the study of the properties of cellular concrete being developed, the main objects are a quasi-homogeneous medium, as an aggregate of a multitude of packed particles and its integral physical characteristics [10, 11]. Theoretically, any set of particles can be quite fully described by the corresponding matrix consisting of elements in the form of descriptions of the individual properties of each of the particles, including their individual phase coordinates – the physical parameters of the state. The defining elements of such a matrix are the parameters of the macrostructure of cellular concrete, which characterize the connection with their strength and heat engineering properties.
The search for the optimal structure of thermal insulation materials was carried out by A.P. Merkin, Yu.P. Gorlov, A.A. Brushkov [12, 13]. Questions of complex studies of the structure of materials are considered in the fundamental and fundamental works of V.A. Pinsker [14], as well as A.N. Kharkhardin [15], in which the main focus was on studying the mechanism of formation of the diameter of cellular pores and the formation of interpore partitions.
The theoretical rationale for the relationship between the macrostructure of cellular concrete and their strength was studied by G.I. Loginov and A.P. Filin [16, 17]. The researchers, on the basis of mathematical models characterizing the occupancy of a unit of volume by spherical bodies, derived fairly strict regularities describing the “ideal” structure of cellular concrete.
Analysis of research materials [1-17] showed that for the formation of the necessary strength and thermal characteristics of aerated concrete, it is necessary to implement a multifunctional task by varying a large number of variable factors.
Experimental studies of the cellular concrete macrostructure
Taking into account the geometric features of the structure of cellular concrete, which is distinguished by high porosity, the theory of fractal geometry was adopted as a mathematical tool for the analytical description of the structure of cellular concrete [18].
In accordance with the methodology for the formation of fractal objects, a numerical experiment was carried out aimed at determining the fractal dimension of the structure of cellular concrete to determine the relationship of the latter with its porous structure. For this, the first step was to build a physical model of cellular concrete with hexagonal, cubic and rhombic packages.
This physical model involves the formation of a spatial framework as a result of successive filling of the volume with pores of a given size [1, 7-11]. At the same time, extremely tight pore laying is achieved due to spontaneous spatial restructuring of the lattice and its compaction with a stepwise increase in the total porosity. Capillary and air-entrained pores form a given (hexagonal, cubic or rhombic) interporous material lattice.
The mathematical model of the physical organization of the porous structure of cellular concrete presented above was built on the basis of the prescribed laws of probability density distribution of pores along their section radii for all the above types of packaging so that the porosity of the lattice with the thickness of partitions of 20-60 μm varied from 10% to 90%.
Then, a method based on image analysis of a cellular concrete sample obtained using an Neophot-21 optical microscope was developed to determine the fractal dimension of the porous surface and further determine the relationship between the fractal dimension and the porosity of cellular concrete (Fig. 1).
Image processing was carried out according to a specially developed algorithm, on the basis of which a software package was built, including image input, determining the type of packaging (its proximity to one of three types – hexagonal, cubic or rhombic), searching for boundaries between the pore space and the material (matrix, various types of inclusions, etc.). In addition, one of the main
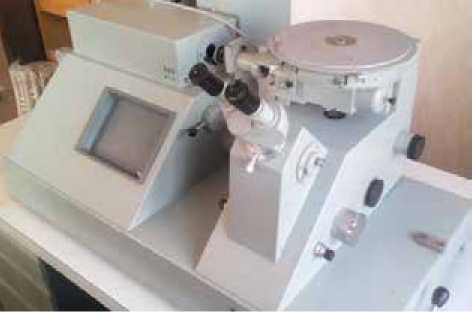
Fig. 1. General view of the optical microscope "Neophot-21"
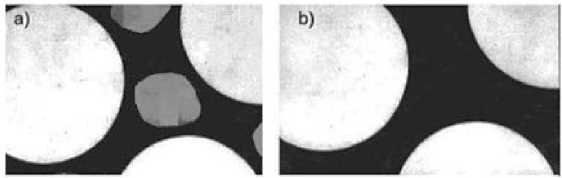
Fig. 2. Micrograph of cellular concrete: a – light color – air bubbles; black color – matrix; gray color – placeholder; b – the same image in binary form (quantized into two levels)
blocks in the program is a block of “quantizing” an image into a given number of levels with the construction for each level of a histogram of the sample’s probability density distribution by brightness levels. The last level represents the binary distribution (black – material, white – porosity). To clearly represent the objects subjected to machine image analysis in Fig. 2 shows a micrograph of a fragment of the structure of cellular concrete.
Before proceeding directly to the definition of the fractal dimension of the structure of cellular concrete, consider the possibilities of studying its properties based on image processing. For this we turn to Fig. 3, which shows the results of quantization of the original image of the structure of cellular concrete into 8 levels and the corresponding histograms. Let’s start with the original image (Fig. 3a) and its histograms.
As can be seen from the histogram, which shows the features of the structure of cellular concrete, the frequency distribution of brightness levels has a two-modal character: the first mode is associated with the matrix and various inclusions (material), the second mode – with porosity. Based on the presented histogram, we estimate the degree of sample porosity using the formula:
P M + Ptn + РП = 1 , (1)
where P м is the probability (empirical frequency) of the image tone of the sample matrix material (image brightness level around the black area), P tn is the image tone probability associated with inclusions (image brightness level near the gray area), is the tone probability of the image of partitions (borders) material – porous structure (brightness level around the neighborhood of white).
From (1) we determine the percentage of porosity of cellular concrete:
Pn (%) = 100% - (1 - PM + Ptn) .100% = 100% - Pn/. (2)
For our sample on the basis of the histogram (Fig. 3a), we have P п = 80%. This estimate is made to within 2.54% of the sample documentation.
Since the technology of obtaining the image is not unambiguous, the image is characterized by noise (noise), distorting the true picture of the sample structure. Therefore, in order to filter out this kind of interference, a quantization procedure is included in the image processing software package – averaging the gradation levels in specified ranges over gradations.
In other words, this procedure allows you to bring the image to some average standard conditions. In essence, the number of task levels can be arbitrary, but a necessary condition is
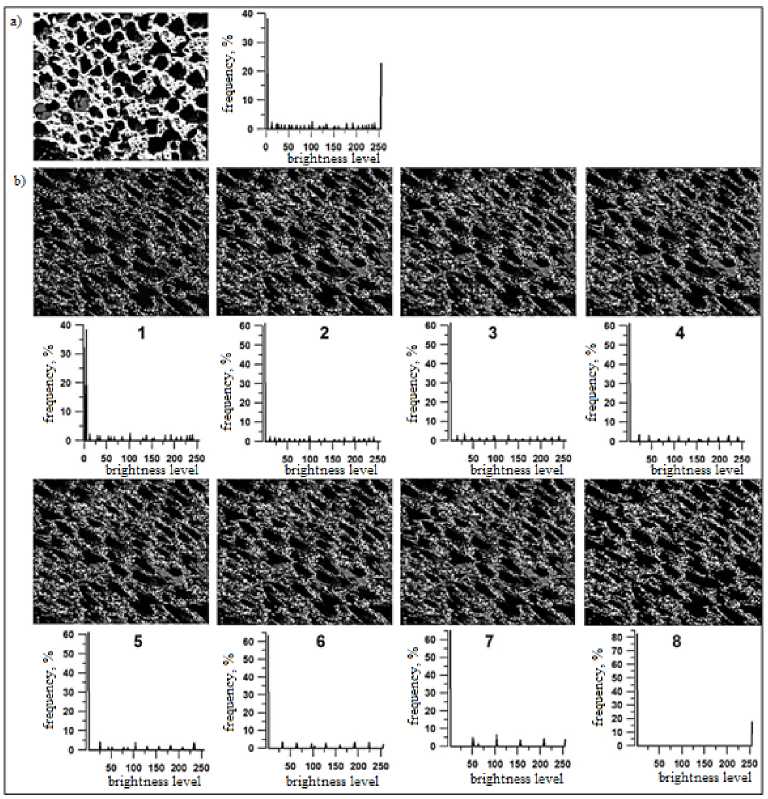
Fig. 3. Results of processing the image of the structure of cellular concrete: a – the original image of cellular concrete and its histogram (right); b – quantized images from the 1st to the 8th levels and their histograms (bottom) for the corresponding level (numbers from 1 to 8)
the task of the last level, as a binary one. This condition is necessary because, ultimately, we are interested in two objects – the material and the pores. In the language of image processing, these are two gradations (in our case, black and white). In Fig. 3b shows the results of quantization of the image shown in Fig. 3a. It turned out that the filtering, which leads to the image of some average shooting conditions, performs an extremely important function related to the characteristic of the structure of the sample as a whole (Fig. 3b). It is seen that the latter shows the geometry of the formation of the structure of the sample as a whole, which is anisotropic in nature, determined by the orientation of the macrostructure in the preferred direction. Moreover, with an increase in the level of quantization, this feature of the macrostructure is manifested to a greater degree. The above explains where the magnified image of the binary level is shown (Fig. 3b-8) with the predominant direction of the formed macrostructure as a whole (the direction is indicated by the arrow).
Algorithm for constructing the image of cellular concrete of a given structure and its fractal dimension
Let m * n be the given matrix (base) of a sample of cellular concrete, where m is the width, n is the height of the matrix, respectively. This area will be packed with spherical pores (a circle on a plane), using two types of packaging – hexagonal and cubic. These two types of packaging are chosen, generally speaking, from obvious prerequisites, since the greatest value of porosity with a spherical shape of pores is achieved in the conditions of their geometrically correct packing (packing), to which, cubic and hexagonal belong.
Further, we denote the matrix and the components of concrete with black color of the image, and the pores with white. Then, the description of the structure of cellular concrete in terms of the formation of its image will be expressed in the form of pixels (the minimum element of the raster image) of black and white color – a binary image. Thus, the minimum unit of the pore radius is a pixel uniquely determined by the metric system of units in fractions of a centimeter. As a result, specifying the type of styling by building a system of polygons of a given type, place the pores (white pixels) at the vertices of this polygon. Then, algorithmically recognizing the “material – pores” border on an image is reduced to a simple procedure for determining the brightness level: black is material, white is pores. This is the main goal of the image quantization method introduced in the work to the i -th number of levels, of which the last, binary level, in fact, automatically determines the border of porosity in the sample. Now it remains only to calculate the percentage occupied by white pixels of the total area of the image, and we obtain the degree of porosity of the sample. On the basis of the developed method, the reverse formulation of the problem is also possible: on the basis of a given percentage of material porosity, obtain the most optimal pore arrangement (type of packaging) that meets the specified parameters of strength and thermal conductivity of cellular concrete. Having a specific type of image of cellular concrete, obtained as a result of modeling, otherwise, a specific type of package of pores of certain dimensions that meets the required (specified) parameters, further, we can set the technological task of obtaining it. Here it is necessary to note the following: the method described in this article is focused on a flat image, that is, a volume projection of the sample onto the plane is considered. Since we, when building the optical model of the image of cellular concrete, we operate with circles with given radii displayed on the plane, distortions about its three-dimensional image when calculating the porosity of the model “flat” image, for obvious reasons, occur. However, the application of the method to real samples showed that the magnitude of the errors does not exceed 3%. Moreover, in our opinion, there are no principal difficulties in applying the proposed method to volume realization, for example, the consideration of stereographic or holographic images.
Further, using formula (3), we calculate D – the parameter of the fractal dimension of the structure of cellular concrete using the modified Peano algorithm – the “Box Counting” method [19]. According to this method of calculating the fractal dimension D is determined by the expression:
D = -nN, , (3)
1J where 5 is a square grid cell with the size 5x5 covering the binary image, N is the number of square cells where the points (with coordinates xi, yj, i=1, m, j=1, k) are located on the image “material – pores”.
Next, the dependence of D on the number of squares covering the fractal is plotted in a double logarithmic scale. As will be shown below, this dependence is well approximated by a straight line (linear regression)
Y = kx + b. (4)
The slope k of the line determines the fractal dimension
D = -k. (5)
The accuracy of this method was tested using the Koch curve [20], the theoretical fractal dimension of which is D = 1.262 . For this curve in our test version, based on the method described above, the dimension of this curve was D = 1.250. Thus, the error of the “Box Counting” algorithm used does not exceed 1%.
Numerical model experimental studies of the cellular concrete macrostructure
Numerical experiments were carried out aimed at identifying features of the connection of the fractal structure, as a function of the type of laying, cellular concrete with its porosity, and therefore with the strength and heat engineering properties. Pore sizes in modeling the structure of cellular concrete, in accordance with [21], were set in the range of pore radii from 0.2 to 2 mm with a step of 0.2 mm. Thus, the range of porosity ranging from 10 to 90% was considered. The variation of the percentage of porosity was carried out by changing the distance between the pores of a fixed radius, representing the nodes of the hexagonal and cubic lattice.
In Fig. 4 shows a modeled (within the framework of the developed software complex) image of cellular concrete with perfect hexagonal and cubic packs with a grid with squares superimposed on the image, which were used to determine the fractal dimension of the model samples according to the algorithm. The results of the calculations are presented in Table 1.
The relationship of porosity of cellular concrete with various types of laying with its fractal dimension is presented in Table 2.
In Fig. 5, which shows the dependence of the fractal dimension of the pore structure of cellular concrete on the magnitude of the porosity for the hexagonal and cubic types of laying.
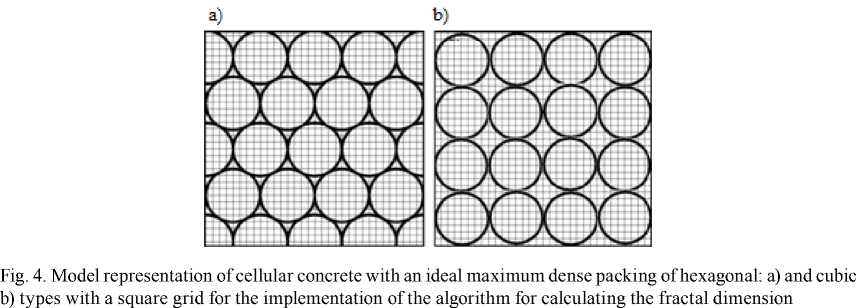
Table 1. Сalculation results of the fractal dimension of cellular concrete with different pore radii with hexagonal packaging
|
S ( R п ), % |
R п , мм |
1 log 2R п |
logS ( R п ) |
D |
|
10 |
0,2 |
0.998 |
1.000 |
1,874 |
|
20 |
0,4 |
0.698 |
1.301 |
1,540 |
|
30 |
0,6 |
0.521 |
1.477 |
1,355 |
|
40 |
0,8 |
0.396 |
1.602 |
1,235 |
|
50 |
1,0 |
0.299 |
1.699 |
1,150 |
|
60 |
1,2 |
0.219 |
1.778 |
1,105 |
|
70 |
1,4 |
0.153 |
1.845 |
1,065 |
|
80 |
1,6 |
0.094 |
1.903 |
1,020 |
|
85 |
1,8 |
0.044 |
1.929 |
0,995 |
|
90 |
2,0 |
0.0060 |
1.954 |
0,965 |
Note: R п – pore radius; S (R п ) – area occupied by pores; D is the fractal dimension.
Table 2. Connection of porosity of cellular concrete with various types of laying with its fractal dimension
|
P, % |
Type of laying |
||
|
Hexagonal |
Cubic |
«Random» |
|
|
D |
D |
D |
|
|
10 |
1,283 |
1,321 |
1,546 |
|
20 |
1,525 |
1,407 |
1,587 |
|
30 |
1,775 |
1,497 |
1,632 |
|
40 |
1,817 |
1,511 |
1,659 |
|
50 |
1,833 |
1,523 |
1,671 |
|
60 |
1,847 |
1,541 |
1,682 |
|
70 |
1,852 |
1,582 |
1,694 |
|
80 |
1,638 |
1,525 |
1,546 |
|
85 |
1,541 |
1,461 |
1,482 |
|
90 |
1,431 |
1,432 |
1,383 |
One can see the presence of three sections: with an increase in porosity in the range of ≈10–35%, the fractal dimension linearly increases; in the range of ≈ 30–70%, the linear growth of the fractal dimension is insignificant; in the range of ≈ 68–90%, the fractal dimension linearly decreases. At the same time, the rates of growth and reduction of the fractal dimension of the structure of cellular concrete are different for the types of laying considered. So, for hexagonal type of laying:
-
> on the interval of 10-33%, a noticeable increase is approximated by a straight line
D = 0,02498 P + 1,0166;
-
> in the range of 33-70% slight growth - direct
D = 0,00144 P + 1,777;
-
> in the range of 70-90% linear reduction - direct
D = –0,02236 P + 3,444.
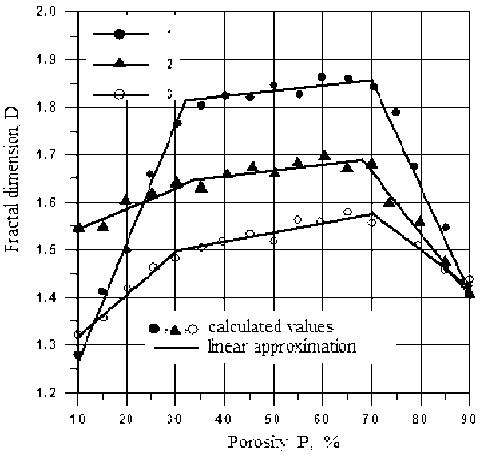
Fig. 5. The relationship between the fractal dimension D and the porosity P (%) in cellular concrete with hexagonal (1), cubic (3) and random (using a random number generator) types of laying (2) with a given percentage of porosity
For cubic styling we have:
-
> on the interval of 10-30%, a noticeable growth is approximated by a straight line
D = 0,0893 P + 1,2277;
-
> in the range of 30-70% slight growth - direct
D = 0,00195 P + 1,454;
-
> in the range of 70-90% linear reduction - direct
D = –0,00786 P + 2,128.
As can be seen from the presented results, the changes in the fractal dimension described by a straight line at the corresponding intervals are unequal for the hexagonal and cubic packings: the slope of the straight line, which characterizes the rate of increase (decrease) of the function, for the hexagonal pack has larger values than for the cubic one. These two types of ideal structure of cellular concrete can be considered as limiting types of packages from the point of view of the upper and lower limits of the rate of change of the fractal dimension of the structure of a porous material.
A rather nontrivial change in the fractal dimension of the structure of cellular concrete, associated with the nature of the change in the pore structure, directly indicates the features of the organization of the structure of cellular concrete itself, namely:
-
> the first interval ( « 10-35%) - is the transition of the pore structure from isolated spherical pores to interconnected pore clusters, where the spherical pores merge and form pore clusters with branched boundaries, which causes an increase in fractal dimension;
-
> in the second interval ( « 30-70%) with an increase in the pore space, where the fractal dimension changes (increases) slightly (slope coefficient – k ≈ 10 – 4), the geometrical configuration of the pore boundaries does not change, but only their length;
-
> in the third interval ( « 70-90%), in which the fractal dimension decreases, very large pores formed, as a result of which the boundaries are geometrically smooth, and their irregularity decreases, which determines the decrease in the fractal dimension.
It seems to us that this behavior of the fractal dimension is related to the percolation thresholds known in porous materials [22, 23].
Thus, on the basis of the developed method for analyzing the surface of the porous structure of cellular concrete, it was possible, in addition to its fractal nature itself, to obtain a correlation with known features in the behavior of porous materials. However, these results were obtained on simulated samples with an ideal structure, which cannot be obtained technologically in practical production work.
Therefore, it is to be expected that, when applying the appropriate technologies, only to one degree or another can approach the model obtained in this article and possibly occupy an intermediate position in terms of their fractal characteristics. In this connection, a numerical experiment was performed in which the structure of cellular concrete was modeled to conditions close to real samples. To do this, using a random number generator for specified ranges of sizes of spherical pores and a given percentage of porosity, the structure of cellular concrete was modeled. The simulation results were analyzed on the basis of the constructed histograms for a given pore content in the entire considered range (from 10 to 90%). The results of model calculations were approximated by Gauss curves (the normal law of probability distribution) and Cauchy – Lorentz curves [24, 25].
In Fig. 6, as an example, a histogram of the model calculation of the structure of cellular concrete using a random number generator for a pore space of 50% in the range of pore sizes with a radius of 0,2 to 2 mm, approximated by the Gauss function:
G ( Δ R п , σ ) ≅ ex p([ Δ R п ] 2 / σ 2 ) (6)
where σ is the standard deviation, and the Cauchy – Lorentz function:
P ( Δ R п , R п , b )
1 ⋅ b
π ( R п - R п ) 2 + b 2
where R п – is the radius of pores, is the average value from the specified range, b is the scale parameter of half-width at half-height. The Gaussian function modeled the distribution function describes very roughly, while the Cauchy-Lorentz function describes it with sufficient accuracy (Fig. 6).
Conclusion
The results of calculations of the fractal dimension for the structure of cellular concrete modeled in a “random” manner are shown in Fig. 6 (curve 2). As was to be expected, the position of this fractal curve, or straight lines in three sections, occupies some intermediate position between the fractal curves with perfect hexagonal and cubic layouts. It is important that the ranges of variability practically coincide with those calculated by the model with ideal packaging. Therefore, the obtained conclusions based on the analysis of the fractal structure of cellular concrete with theoretically ideal – 925 –
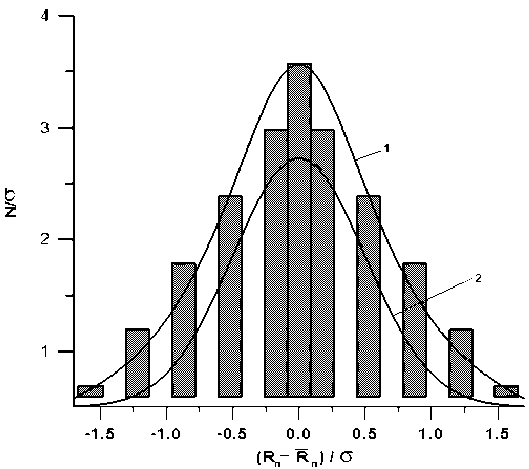
Fig. 6. A histogram of the probability density distribution of pores in size, normalized to the standard deviation and its approximation by the Cauchy – Lorentz functions (1) and Gauss (2) (Note: N is the percentage number of pores of a given radius from the specified range, is the standard deviation)
packaging fully apply to the model, which in its structural organization approaches the real, that is, technologically secured.
Based on the proposed simulation technique, a quantitative assessment of the fractal dimension of the cellular concrete structure was made, which describes the mechanical, thermal and geometric properties of porous materials, correlated with such important parameters as bulk density, strength, porosity, and thermal conductivity. As a result, the responses of the system (matrix-components-pores) to variations in the geometry of the structure were obtained and their analysis was performed. On the basis of a rational combination of probabilistic and deterministic descriptions of the studied structures of cellular concrete, the connection of the structure with the properties of the composite material is obtained.
It has been established that the anisotropy of the macrostructure of cellular concrete reduces the average strength of cellular concrete depending on the angle of inclination of the vector of the preferred organization of the structure to the horizontal axis.
References Analytical and experimental research of structural organization of heat-insulating construction materials
- Адилходжаев А.И., Махаматалиев И.М., Шаумаров С.С. Теоретические аспекты структурно-имитационного моделирования макроструктуры композиционных строительных материалов. Научно-технический вестник Брянского государственного университета, 2018, 3 312-320
- Адилходжаев А.И., Шаумаров С.С. К исследованию вопроса повышения энергоэффективности зданий на железнодорожном транспорте. Современные проблемы транспортного комплекса России, 2018, 1, 4-11
- Шаумаров С.С. Моделирование процесса формирования температурного поля наружного ограждения зданий на железнодорожном транспорте. Научно-технический вестник Брянского государственного университета, 2018, 3, 338-346
- Шаумаров С.С., Щипачева Ю.А. Комплексный подход к проблеме термообновления стен панельных зданий. "TRANS-MECH-ART-CHEM": Материалы VII Международной научно-практической конференции. Москва: МИИТ, 2010, 239-241
- Adylhodzayev A.I., Shaumarov S.S. The issue of thermal renovation of infrastructure of railway transport is evaluated. X International Scientific Conference "Transport Problems - 2018". Wisla, Katowice, Poland, 13-18.
- Shaumarov S.S. Оn the issue of increasing energetic efficiency of buildings in railway transport. VIII International Scientific Conference "Transport Problems - 2016", Katowice, Poland. 522-532.
- Рыбьев И.А. Закономерности в структурно-механических свойствах асфальтового бетона. Труды ВЗИСИ, 1957, 1, 3-18
- Abina A., Puc U., Jeglič A., Zidanšek А. Structural characterization of thermal insulation building materials using terahertz spectroscopy and terahertz pulsed imaging. Journal "NDT & E International", 2016, 77, 11-18.
- Bouvard D., Chaix J.M., Dendievel R., Fazekas A., Létang J.M., Peix G., Quenard D. Characterization and simulation of lightweight concrete. Cement and Concrete Research, 2007, 37(12), 1666-1673.
- She Wei, Chen Yiqiang, Zhang Yunsheng, Jones M.R. Characterization and foamed concrete. Construction and Building Materials, 2013, 47, 1278-1291.
- Kim H.K., Jeon J.H., Lee H.K Workability, and mechanical, acoustic and thermal properties of lightweight aggregate concrete with a high volume of entrained air. Journal of Construction and Building Materials, 2012, 29, 193-200.
- Брюшков А.А. Газо- и пенобетоны. М.: ОНТИ, 1930. 180 c.
- Меркин А.П., Горлов Ю.П., Устенко А.А. Технология теплоизоляционных материалов.. Москва: Стройиздат, 1980. 399 с.
- Пинскер В.А. Некоторые вопросы физики ячеистого бетона. Жилые дома из ячеистого бетона. Л.: Стройиздат, 1963, 123-145
- Хархардин А.Н. Теория прочности и структуры твердых пористых тел. Вестник БГТУ им. В.Г. Шухова. Пенобетон. Белгород: БГТУ им. В.Г. Шухова, 2003, 4, 42-53
- Левин Н.И. Основные механические и упругие свойства ячеистых бетонов. Исследования по каменным конструкциям, 1957, 12-26
- Меркин А.П., Филин А.П., Земцов Д.Г. Формирование макроструктуры ячеистых бетонов. Строительные материалы, 1963, 12, 9-21
- Mandelbrot B.B. The Fractal Geometry of Nature. New York, W.H. Freeman and Company, 1983, 240 p.
- Falconer K.J. The Geometry of Fractal Sets. Cambridge, Cambridge University Press, 1985, 190 p.
- Mandelbrot B.B. The Fractal Geometry of Nature. New York, W.H. Freeman and Company, 1983, 240 p.
- Королев А.С., Волошин Е.А., Трофимов Б.Я. Оптимизация состава и структуры конструкционно-теплоизоляционного ячеистого бетона. Строительные материалы, 2004, 3, 30-32
- Sahimi M. Application of percolation theory. L., Taylor & Fransis, 1994, 320 p.
- Guyon E., Mitescu K., Yulen S.R. Fractals and percolation in a porous medium. Journal UFN, 1991, 161(10), 121-128.
- Spiegel M.R. Theory and the probability of statistics. New York, McGraw-Hill, 1992, 114 p.
- Budaev V.P., Khimchenko L.N. Fractal growth, Physica A, 2007, 382, 359-377.
