Analyzing defects of solar panels under natural atmospheric conditions with thermal image processing

Author: Akash Singh Chaudhary, D.K.Chaturvedi
Journal: International Journal of Image, Graphics and Signal Processing @ijigsp
Article in issue: 6 vol.10, 2018.
Free access
Sun is an ultimate source of energy, which is clean, inexhaustible and safe for environment. The energy obtained from sun is known as solar energy. When solar radiations fall on earth surface solar cells convert these solar radiations into electrical energy. Solar cells are one of the important components of solar panels. Many solar cells combine in series or in parallel to form solar module and solar panels. A solar photovoltaic array is a combination of solar panels and is installed in open atmospheric condition. The natural conditions such as dust and dirt, shade of tree affect operation of solar panels. These natural conditions cannot be avoided but can be analyzed using visual inspection and thermal camera. The visual inspection approach is useful only when the defects are visible by naked human eye but when defects cannot be visualized by naked human eye thermo-graphical approach is used. This paper discusses the identification of various defects in solar panels by applying image processing technique applied for thermal images under natural atmospheric conditions for visual inspection, shading effect of tree, dust and dirt deposition effects on solar panels using thermal imaging camera.
Bird Deposits, Dust and Dirt, Shading Effect, Solar Panels, Thermal Image Processing
Short address: https://sciup.org/15015968
IDR: 15015968 | DOI: 10.5815/ijigsp.2018.06.02
Text of the scientific article Analyzing defects of solar panels under natural atmospheric conditions with thermal image processing
Published Online June 2018 in MECS DOI: 10.5815/ijigsp.2018.06.02
Energy is the basic requirement today and is obtained by sources of energy. The use of conventional sources for generating energy is responsible for green house gas effect and global warming. Non-conventional sources of energy like sun, wind, water, etc are clean and non-polluting for environment. Sun radiate its energy in the form of solar radiations, which are converted into useful electrical energy by solar cells [1]-[2]. This electrical energy obtained from sun has many applications like industrial, medical, defense, engineering, irrigation etc [3]-[4].
The solar energy radiations obtain by India in a day and in a year is approximately 4 — 7 kWh/m 2 and 5 x10¹⁵ kWh respectively [5]-[6]. The earth and environment receive Total Radiation approximately
3.6x1024 Joules / year [7]. The solar photovoltaic panels are normally installed in an open atmospheric condition, so affected by natural disturbances. These natural disturbances include bird deposition effects, cement position effects, dirt and dust deposits mainly soil on solar panel surface, shading effects of tree branches and leaves, degradation, discoloration of solar panels, different types of fault in solar panels. Therefore health condition of solar photovoltaic panels improves not only performance but increases the efficiency of power generation [8]-[9]. The thermo-graphical approach plays a vital role in performing thermal analysis of various defects occurring in solar photovoltaic array by capturing thermal images. These thermal images are captured using thermal imaging camera and represent a temperature distribution in a colored form known as thermo-grams [10].
II. Solar Cell and Solar Panels
The solar radiations emitted by sun are converted into electrical energy by solar cells. These solar cells are the smallest element of solar module. The equivalent circuit diagram of a solar cell is given below in fig. 1.
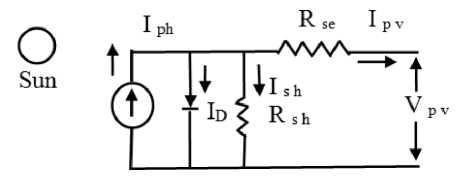
Fig.1. Equivalent circuit diagram of a solar cell
The output parameters of a solar cell are output current IPV output voltage V p v. The basic output equation of a solar cell can be written as:
I pv = IPh - I O

- 1
—
V pv + I pv R se
Rsh
Where, V p v is output voltage of photovoltaic cell, I ph is current produced by Incident light, I 0 is diode reverse saturation current, I D is diode current, V D is voltage drop across diode, R se is series resistance, R s h is shunt resistance, VT is thermal voltage (KT/q), K is Boltzmann constant, T is cell’s operating temperature in Kelvin, q is charge of an electron, ɳ is panel quality factor.
Mainly two technologies are used in solar photovoltaic first is Crystalline silicon type and second is Thin film type. The Crystalline Silicon photovoltaic panels are subdivided into Mono-Crystalline photovoltaic panels and Poly-Crystalline photovoltaic panels. Thin film photovoltaic panels can be Cd Te (Cadmium Telluride) photovoltaic panels, CIGS (Copper Indium Gallium Selenide) photovoltaic panels, and a-Si (Amorphous Silicon) photovoltaic panels [11]. A Mono crystalline solar photovoltaic module with 72 solar cells is shown in fig. 2. All cells are connected in series combination to get the desired output rating of solar module.
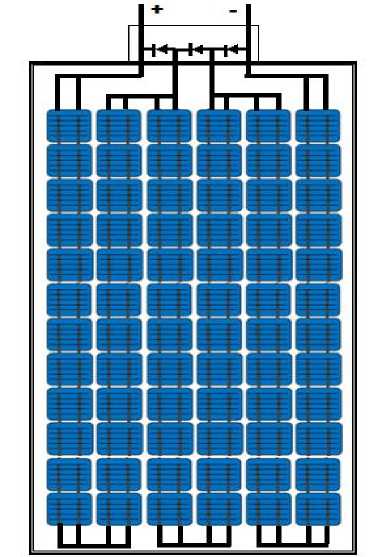
Fig.2. Mono-Crystalline Solar Photovoltaic Module
-
III. History of Infra Red Thermography
Every object emit energy in the form of heat above absolute zero (-273°C). This heat emitted is in the form of electromagnetic radiations and are known as thermal energy. The Infrared radiations are those portions of electromagnetic radiations which are not visible by naked eye. Infra red THERMOGRAPHY is a technique of converting infrared radiations into thermal images known as thermo-gram.
These infrared radiations were first discovered by Frederick William Herschel, a German Astronomer (1738-1822) in 1800 [12]. The spectrum of Electromagnetic spectrum is shown below representing the range of infrared radiations in fig. 3.
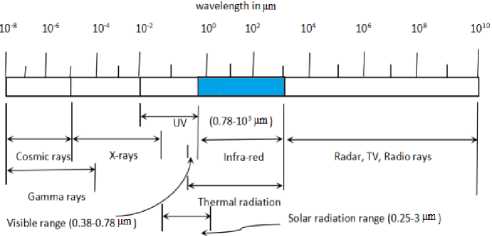
Fig.3. Infra red electromagnetic spectrum
The word THERMOGRAPHY means ‘ writing with heat ’. Infrared THERMOGRAPHY is a technique to convert the Infra-red radiations (Infrared energy) into thermograph without making any physical contact with the object used for measurement.
THERMOGRAPHY works on two laws given below:
-
1. Total radiation law: It states that the total incident energy is equal to the sum of absorbed energy, reflected energy and transmitted energy.
-
2. Stefan–Boltzmann law: It states that ‘total radiant heat of a body is proportional to the emissivity and fourth power of temperature’.
W= σεT4
Where,
W= Total radiant energy of an object (W/m2)
σ= Stefan’s Boltzmann constant (5.6697×10⁻⁸ W/m2 K4)
Ɛ= Emissivity of object
T= Absolute temperature of object.
Therefore the radiant energy emitted by an object is proportional to its temperature.
Basically the technique of THERMOGRAPHY can be classified into following types:
-
- Infra-red THERMOGRAPHY
-
- Pulse THERMOGRAPHY
-
- Lock-in THERMOGRAPHY [13]
A thermal camera is a device to capture the thermal images. The thermal images show temperature variation of the object in terms of colorful patterns. The bright color shows hot portions while dark color shows cold portions in thermal images [14].
-
IV. Review of Defect Analysis in Solar Panels under Natural Atmospheric Conditions
The natural environmental condition has direct impact on the operation of solar panels. As the time passes some defects evolve in solar panels [15]-[16]. The defects like corrosion of frame of solar panel, different degradation defects (cracks in the Encapsulant surface, yellowing, browning of cells, Delamination of cells, Discoloration of cells), open circuit, short circuit, Debridging, bubble and ruptures at back surface sheet of solar panels are visible by naked eye. These visible defects can be identified by applying visual approach.
Table 1. Common defect in solar photovoltaic panel
|
Components of solar panel |
Possible reason for common defects of solar panel |
Ref. No. |
|
Frame of solar panel |
Ageing, detachment of panel components and frame are reasons for DEFRAMING. Corrosion is due to atmospheric effect. These defects affect the life of solar panels. |
[34] |
|
Transparent glass surface |
Cracks in transparent glass surface are due to many reasons like temperature, rain, wind etc. Soil depositions also depend on atmospheric conditions. The overall effect of these cracks in transparent glass surface is degradation of ARC (Discoloration, Delamination etc), corrosion of cells, and reduction in generated power. |
[33], [32] |
|
EVA Encapsulant |
The increase in temperature, UV and water, affects the adhesive material between solar cell and transparent glass, so give rise to problem of yellowing. It also reduces generation of solar power. |
[34] |
|
Solar cells and bus bars |
The use of poor quality of EVA, oxidize ARC and increase temperature, which result in discoloration of solar cell from purple to blue. Burn marks of bus bars occur due to heating problem. Both these effect reduce the generation of energy. |
[32], [34], [35] |
|
Back sheet surface of solar module |
Bubbles are formed when heat is released from back sheet of solar module at high temperature while Ruptures are observed during heating or during transportation. Deposition of chalking power because of sing poor quality material at back sheet and thermal degradation. Both defect can reduce panel life and generation of power. |
[34], [35] |
|
Junction box |
The defects in junction box are due to moisture, heat and mishandling in maintenance. They decease the life of junction box components. |
[31], [36] |
There are some defects like shadow of tree branches, shadow of tree leaves, shadow of building, snow deposition, deposition of dirt, dust and soil etc on solar panel surface which are not visible by naked eye there THERMOGRAPHICAL approach is used. These depositions and shadow effects give rise to several other problems like hotspots, loss of power generation, affecting performance of solar panel [17]-[18].
Now-a-days solar panels has many application areas in which health monitoring is must for increasing efficiency and reliability of the complete system [19]-[30].
The table 1 shows some common defects generally occur in solar photovoltaic panels with their possible reasons. The table 1 focuses on the problem of corrosion and Deframing of solar panel frame, cracks in transparent glass surface, Delamination, Discoloration and (Ethylene vinyl acetate) of EVA (Ethylene vinyl acetate) Encapsulatant, problems of yellowing, soil and other depositions, corrosion of cells, burn marks in solar cells and bus bars, back sheet surface of solar module defects like bubbles, ruptures, deposits of chalking powder, moisture and corrosion defects in junction box [31]-[36].
-
V. Theory of Thermal Image Processing
The THERMOGRAPHICAL approach involves capturing thermal images by thermal imaging camera to identify defects which are not visible by naked eye. A Thermal imaging camera detects the radiant heat energy emitted by any object, whose temperature is above absolute zero (-273°C) and develops a detailed temperature patterns known as thermo-gram on the screen of thermal imaging camera. Thermo-grams represent the variation of different colors in terms of the temperature of the object. The dark color shows coder area while bright color shows the hotter area in thermo-gram. When digital image processing is applied to thermal images, the desired hot regions of bird and cement deposits are segmented easily for better visualization. It is also useful in analyzing heated regions in solar batteries [37]-[38].
A KUSAM MECO Thermal imaging camera Model TE-P shown below in fig. 4 which was used in the experiment and its specifications are listed in table 2.
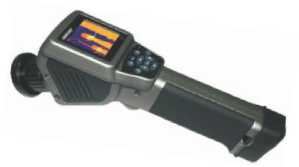
Fig.4. KUSAM MECO Thermal Imaging Camera Model TE-P
Table 2. Specifications of KUSAM MECO Thermal Imaging Camera Model TE-P
|
Thermal Camera Info. |
Value |
|
Type of Detector |
Un-cooled FPA Micro-bolometer |
|
Min. Focus distance |
0.3m |
|
Spectral range |
8-14μm |
|
Measurement Temp. |
-20 °C to +350° C |
|
Environment oper. Temp |
-15 °C to +50 °C |
|
Environment humidity |
≤ 90 % Non-condensing |
|
Accuracy |
± 2°C |
|
Thermal sensitivity |
≤ 0.1C @ 30 °C |
|
Color palette |
11 Changeable |
|
Laser pointer |
Class 2, 1mw/635 nm (red) |
-
VI. Experimental Work for Analyzing Defects in Solar Panels Under Natural Atmospheric Condition
Location and setup for the experiment:
The solar panels were installed at the roof of a building with facing towards south in the campus of faculty of engineering, DEI, Agra. The building was surrounded by trees in plenty on eastern side and few on western side and there was a building on north side. The following fig. 5 shows the location of complete solar array and building roof with normally captured photograph.
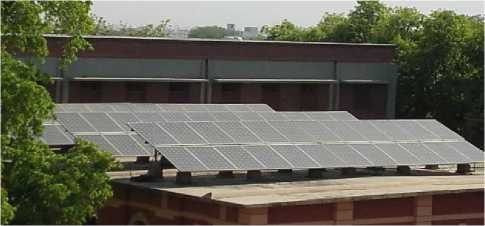
Fig.5. Normal Camera Photograph of Complete Solar Array
The solar photovoltaic array consists of four strings i.e., string 1, 2, 3, 4. All these strings were connected in parallel with 18 modules in each. The following table 3 shows the number of solar modules in solar array.
Table 3. Number of Solar Modules in Solar Array
|
No. of Strings (S1, S2, S3, S4) |
No. of Solar Modules |
|
String 1(a +b +c) |
6+6+6=18 |
|
String 2 |
18 |
|
String 3 |
18 |
|
String 4 |
18 |
|
Solar Array (All 4 strings) |
72 |
The measurements on solar panels were done under dust, dirt, soil and shading effect of tree. During measurements the load remains connected to solar array. The measurements were taken from a KUSAM MECO clamp-meter with a thermocouple for current, voltage, temperature, KUSAM MECO thermal imaging camera for capturing thermal images, and digital solar PYRANOMETER for solar irradiance. The other parameters were measured using weather software from android phone with internet connectivity. The experimental work done for analyzing solar panels under naturally operating conditions was divided into three parts:
Part A: Identification of defects in solar panels by visual inspection approach
Part B: Analyzing effect of natural conditions in solar panels by using thermal camera
Part C: Thermal image processing for better visualization of defects in solar panels
Part A: Identification Of Defects In Solar Panels By Visual Inspection Approach
Frame of solar panels:
The frame of solar panels being exposed to direct contact of atmosphere develops corrosion, Deframing etc. Deframing occurs when frame of solar panels are detached due to ageing and other atmospheric conditions.
These defects in frame of solar panels are identified visually and are shown in fig. 6 and fig.7. Fig. 6 shows the corrosion at the connecting joints of solar module. Fig. 7 shows the de-framing of solar panel frame.
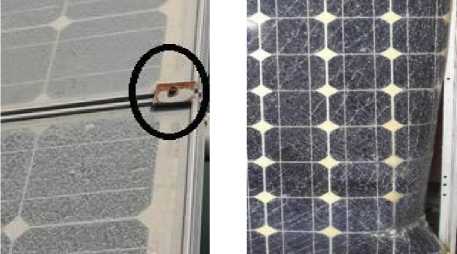
Fig. 6 Fig. 7
Fig.6. Corrosion at joints of Solar Panels, fig. 7 De-framing of Solar Panel Frame
Cracks, Degradation of ARC, Dust and Dirt deposition on transparent Glass Surface of Solar Panels:
Cracks on transparent glass surface can be due to weather conditions as well as due to heating effect. Cracks allow moisture, dust and dirt to enter into the cell and affect the anti-reflective coating, bus bars of solar panels. The cracks on transparent glass surface are shown in the fig 8 and fig. 9. Burning effect of bus bars due to cracking of a solar cell can be seen in fig. 8. The fig. 9 shows the cracking of the complete glass surface. The soil and bird deposits are also identified easily on solar panel surface. The fig. 10 and fig. 11 shows soil and bird deposits on the solar panel surface.
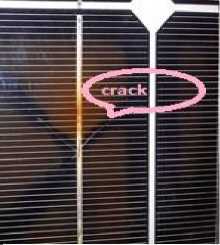
Fig. 8
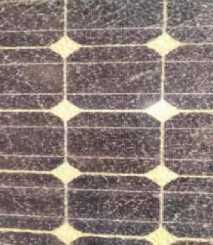
Fig. 9
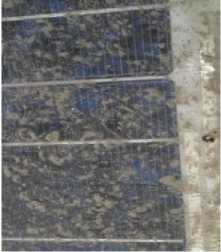
Fig. 10
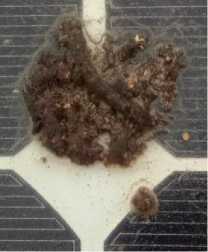
Fig. 11
Fig.8. Crack and its effect on Bus Bar on a small part of Transparent Glass Surface, fig. 9 Cracking of the Complete Glass, Fig. 10 and fig.
11 Soil and Bird Deposition on the Solar Panel Surface
Defects in EVA (Ethylene Vinyl Acetate) Encapsulant of Solar Panels:
When poor quality material used in solar panels gets affected by temperature and other atmospheric conditions different problem arises. When the adhesive between solar cells and transparent glass surface is affected it is known as yellowing. The Fig. 12 shows yellowing of the panels due to the degradation of EVA (ethylene vinyl acetate).
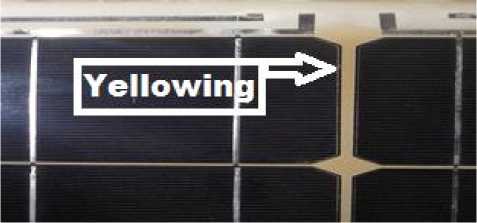
Fig.12. Yellowing of Solar Panel Surface
Discoloration of solar cells and burn marks of bus bars in solar panels:
Discoloration of solar cell occurs when ARC (anti-Reflective Coating) starts 5 oxidize at high temperature and the color of the solar cell changes in solar panels. The color of solar cell becomes blue from purple due to which less amount of solar irradiance is received by a solar cell. The de-coloring results into reduction of energy generated by a solar cell. Burn masks on bus bar occur when the temperature of a particular part in solar cell becomes very high. The bus bars get damaged due to excess heating.
Figure 13 shows the discoloration defect on the solar cell. The color of the left solar cell is less blue than the right solar cell which is dark blue. Burn masks on the bus bars are shown in fig. 14.
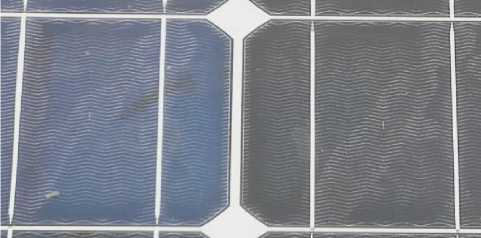
Fig.13. Discoloration of Solar Cell
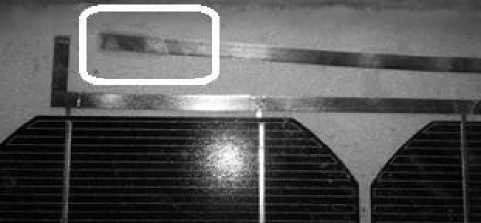
Fig 14 Burn Masks on the Bus Bars (in square)
Bubbles, Ruptures and Chalking at Back Sheet Surface of Solar Panels:
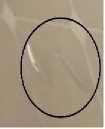
There are three common visual defects at the back sheet of solar panels. First is evolution of bubbles, which occurs when heat of the solar cells is dissipated from back sheet surface. Due to the chemical reaction of Encapsulant some gases are released during the heat dissipation and an air chamber is formed at the back sheet surface of solar panels. This air chamber is known as bubble. The temperature of nearby cells to the bubble becomes high because of less dissipation of heat. Rupture is due to high temperature and mishandling of solar panels when they are transported from one place to another. When back sheet surface of solar panels are not laminated or the quality of back sheet material is poor the problem of chalking powder arises. The thermal degradation or poor quality materials used at the back sheet of solar panels result into a white powder known as chalking powder. It can fail back sheet insulation and electrical shock. Therefore the back sheet surface of solar panels are laminated to get better finish, durability and safety against any kind of degradation defects as well as faults. The fig. 15 shows two bubbles (shown by black circle in figure) identified at the back sheet surface of solar panels and fig. 16 shows a rupture observed at the back sheet surface of solar panel (a close up of rupture is shown by an arrow in figure). The fig. 17 shows two solar panels with un-laminated and laminated back sheet surface along with chalking observed from un-laminated back sheet surface.
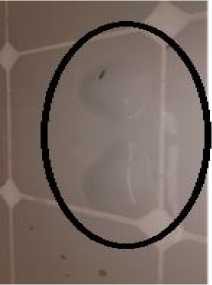
Fig. 15
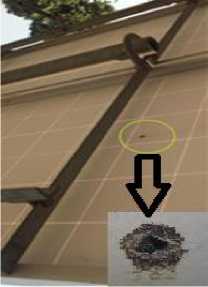
Fig. 16
Fig.15. Bubbles at the Back Sheet Surface of Solar Panel, fig. 16 Rupture at the Back Sheet Surface of Solar Panel
Panels (No Shade, Partial Shade and Complete Shade of Tree)
Case 2: Deposition Effect on Operation of Solar Panels (Soil, Cement and Bird Depositions)
Case 1: Shading Effect of Tree on Operation of Solar Panels (No Shade, Partial Shade and Complete Shade of Tree):
In this case no shade of tree covers the solar panels at 11.30 am but at 04.30 pm approximately 36 solar panels are under the shade of tree so term partial shade was formulated. At 06.00 pm all solar panels were under complete shade of tree.
The table 4 shows electrical and thermal parameters for shading effect of tree.
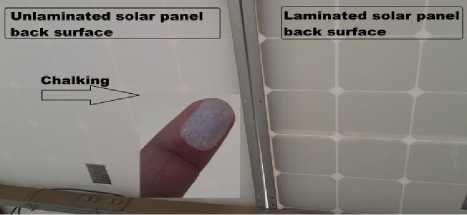
Fig.17. Chalking at the Back Sheet Surface of Un-laminated Solar panel
Defects due to Corrosion, Moisture and Less Maintenance in Junction Box of Solar Panels:
Junction box is placed at back sheet of solar panels. The problems are due to moisture, corrosion, heating of its components and lack in the maintenance.
Fig. 18 and fig. 19 shows corrosion in the junction box components and moisture at the cover of junction box respectively.
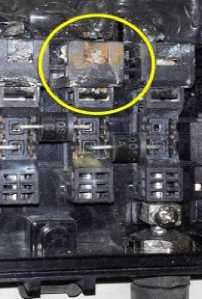
Fig. 18
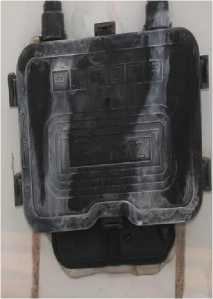
Fig. 19
Fig.18. Corrosion inside Components of Junction Box, fig. 19 showing Moisture at Junction Box respectively
Part B: Analyzing Effect of Natural Condition on Solar Panels Using Thermal Camera
The study the effect of natural conditions on solar panels in detail using thermal camera the experimental work done was divided into following cases:
Case 1: Shading Effect of Tree on Operation of Solar
Table 4. Shading Effect of Tree on Solar Panels
|
Parameters/ Conditions |
No shade on solar panels |
Partial shade on solar panels |
Complete shade on solar panels |
|
|
Date & Time |
20.03.17 11.30 am |
20.03.17 04.30 pm |
20.03.17 06.00 pm |
|
|
Soil deposit |
Thin layer of Soil on all panels |
Thin layer of Soil on all panels |
Thin layer of Soil on all panels |
|
|
Bird beat deposit |
Present on string 2, 3, 4 |
Present on string 2, 3, 4 |
Present on string 2, 3, 4 |
|
|
Cement deposits |
Few pellets on string 1, 2 |
Few pellets on string 1, 2 |
Few pellets on string 1, 2 |
|
|
Hot spots observed |
No |
String 1, 2 |
String 1, 2 |
|
|
T Ambient (ºC) |
32 |
30 |
30 |
|
|
T cement deposit (ºC) |
36 |
30 |
29 |
|
|
T bird beat (ºC) |
34 |
30 |
29 |
|
|
T bubble (ºC) |
39 |
29 |
29 |
|
|
Module operating Temp (ºC) |
T1 |
44 |
32 |
30 |
|
T2 |
41 |
31 |
30 |
|
|
T3 |
40 |
30 |
29 |
|
|
T4 |
41 |
30 |
29 |
|
|
Solar Irradianc e (W/m2) |
I1 |
142 |
32 |
10.3 |
|
I2 |
140 |
34 |
9.4 |
|
|
I3 |
132 |
35.7 |
13.4 |
|
|
I4 |
127 |
41.2 |
12.2 |
|
|
Weather status (dry/ wet/rain) |
Clear sky |
Clear sky |
Clear sky |
|
|
Humidity (%) |
72 |
24 |
25 |
|
|
Pressure (K pa) |
101.5 |
101.1 |
101.1 |
|
|
Wind speed (m/s) |
W 3.1 |
NW 4.6 |
NW 5.1 |
|
|
UV |
9 |
0 |
0 |
|
|
Visibility (km) |
6 |
6 |
6 |
|
|
I Output (A) |
6.99 |
1.68 |
0.35 |
|
|
V Output (V) |
545 |
461 |
492 |
|
|
P Output (k w) |
3.809 |
0.774 |
0.172 |
|
The above table 4 shows that the output current as well as output power of solar photovoltaic array reduces as solar panels come under the shade of tree. It also represents variation in temperature of bird beat, cement deposits, bubbles and other parameters. Presence of all these problems affects the solar power generation. The output current and output voltage was measured without disconnecting the load under the effect of shade of tree. The cement deposit, bird beat deposition, bubbles, heating due to junction box and formation of hot spots in solar panels were also observed in thermal images. Hotspots were noticed under shading effect, as the shade of tree falls on string 1 and string 2 daily after a certain time.
The fig. 20 to fig. 27 and fig. 28 to fig. 35 shows a comparison of normally captured photographs and thermal images with no shade and with complete shade on solar panels for string 1, 2, 3, 4 respectively.
showing low temperature represented by dark color. The fig. 36 shows variation of output power of solar panels under shade conditions of tree.
Shading Effect of Tree on Solar Panels with No Shade for String 1, 2, 3, 4 respectively
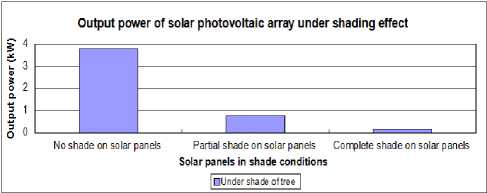
Fig.36. Variation of Output Power of Solar Photovoltaic Array under Shading Effect of Tree
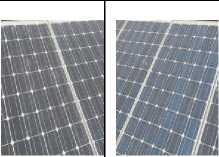
Fig. 20
Fig. 21
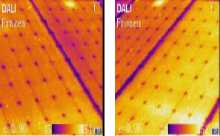
Fig. 25
Fig. 24
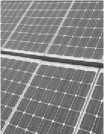
Fig. 22
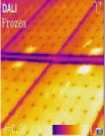
Fig. 26
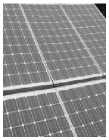
Fig. 23
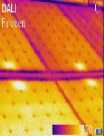
Fig. 27
Shading Effect of Tree on Solar Panels with Complete Shade for String 1, 2, 3, 4 respectively
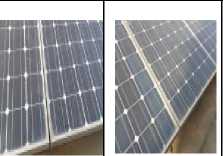
Fig. 28 Fig. 29
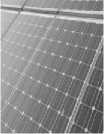
Fig. 30
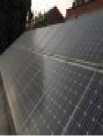
Fig. 31
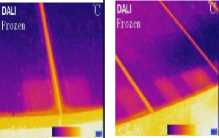
Fig. 33
Fig. 32
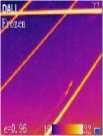
Fig. 34
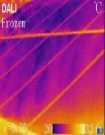
Fig. 35
Fig.20. to fig. 27 Shows Normally Captured Photographs for String 1, 2, 3, 4 respectively under No Shade of Tree, fig. 28 to 35 Shows Normally Captured Photographs for String 1, 2, 3, 4 respectively under Complete
Shade of Tree
The fig. 20, fig. 21, fig. 22, fig. 23 are the normal photographs of string 1, string 2, string 3, string 4 respectively under no shade of tree i.e., for case 1. The fig. 24, fig. 25, fig. 26, fig. 27 are the corresponding thermal images showing high temperature represented by bright color. The fig. 28, fig. 29, fig. 30, fig. 31 are the normal photographs of string 1, string 2, string 3, string 4 respectively under complete shade of tree. The fig. 32, fig. 33, fig. 34, fig. 35 are the corresponding thermal images
Case 2: Deposition effect on operation of solar panels (soil, cement and bird depositions):
In this case the solar photovoltaic panels were found to have soil deposition, small pallets of cement deposition, bird beat deposits and bubbles but shading of tree was common between all. Table 5 shows deposition effects mainly soil, bird beat, cement deposits with electrical and thermal parameters under no shade of tree. Table 6 shows deposition effects mainly soil, bird beat, cement deposits with electrical and thermal parameters under shade of tree. The table 5 and table 6 shows the effect of soil depositions, cement deposition and bird beat depositions on solar panels with no shade and with shade of tree. It has been noticed that output power decreases as the dust, depositions change according to the atmospheric conditions.
Table 5. Deposition Effect under No Shade of Tree
|
Dust & dirt |
No dust & no dirt |
Partial dust & dirt |
|
|
Date & Time |
23.02.17 10.30 am |
24.02.17 12.30 pm |
03.03.17 10.00 am |
|
Soil deposits status |
Thick layer of Soil on solar panels |
No soil on solar panels |
Thin layer of soil on solar panels |
|
Bird beat deposits status |
Few bird beat on solar panels |
No bird beat on solar panels |
No bird beat on solar panels |
|
Cement deposits status |
Few pellets of cement deposits on solar panels |
Few pellets of cement deposits on solar panels |
Few pellets of cement deposits on solar panels |
|
Shade status |
No shade on any solar panel surface |
No shade on any solar panel surface |
No shade on any solar panel surface |
|
T Ambient (ºC) |
16 |
23 |
19 |
|
Weather status (dry/ wet/rain) |
Clear sky |
Clear sky |
Cloudy sky |
|
Humidity (%) |
72 |
36 |
64 |
|
Wind speed (m/s) |
SW 2.1 |
W 5.1 |
NW 3.6 |
|
I Output (A) |
12.93 |
16.39 |
4.27 |
|
V Output (V) |
505 |
506 |
552 |
|
P Output (k w) |
6.529 |
8.293 |
2.357 |
Table 6. Deposition Effect under Shade of Tree
|
Parameters/ Conditions |
Dust & dirt |
No dust & no dirt |
Partial dust & dirt |
|
Date & Time |
23.02.17 04.30 pm |
24.02.17 04.30 pm |
03.03.17 04.30 pm |
|
Soil deposits status |
Thick layer of Soil on solar panels |
No soil on solar panels |
Thin layer of soil on solar panels |
|
Bird beat deposits status |
Few bird beat on solar panels |
No bird beat on solar panels |
No bird beat on solar panels |
|
Cement deposits status |
Few pellets of cement deposits on solar panels |
Few pellets of cement deposits on solar panels |
Few pellets of cement deposits on solar panels |
|
Shade status |
Shade on almost half solar panel surface |
Shade on almost half solar panel surface |
Shade on almost half solar panel surface |
|
T Ambient (ºC) |
25 |
23 |
27 |
|
Weather status (dry/ wet/rain) |
Clear sky |
Clear sky |
Cloudy sky |
|
Humidity (%) |
24 |
35 |
26 |
|
Wind speed (m/s) |
W 5.1 |
W 6.2 |
NW 5.7 |
|
I Output (A) |
2.88 |
3.67 |
2.80 |
|
V Output (V) |
490 |
504 |
576 |
|
P Output (k w) |
1.411 |
1.849 |
1.612 |
The fig. 37 to fig. 42 and fig. 43 to fig. 48 shows a comparison of normally captured photographs and thermal images for dust and dirt under no shade and shade of tree respectively.
In fig. 37 a thick layer of soil and bird beat is present on solar panel surface under no shading of tree, so its thermal image fig. 40 shows bright color representing high temperature due to these depositions.
In fig. 38 when there is no soil and no bird beat deposits on solar panel surface under no shading of tree, its corresponding thermal image fig. 41 shows a dark color representing a low temperature of panel surface.
In fig. 39 when there is partial dust i.e., a thin layer of soil is present on solar panel surface under no shading of tree, its thermal image fig. 42 shows a somewhat less blue color to represent the corresponding temperature.
The fig. 43, fig. 44 and fig. 45 show normally captured photographs of solar panels and fig. 46, fig. 47 and fig. 48 show thermal images for the deposition effects considered under shade of tree. Some hotspots were also observed during shading which are not visible in normally captured photographs but in thermal images.
The fig. 49 shows bar chart for the change in output power due to depositions under shade and under no shade of tree.
Part B:Thermal Image Processing for Better Visualization of Defects in Solar Panels
The part B of the research work shows that the output power of solar panels get reduced due to dust, dirt, shade of tree including bird deposits, cement deposits and formation of hotspots. These natural atmospheric conditions and depositions may cause severe defects in solar panels therefore their detailed analysis is important.
Normal and Thermal Images for Deposition Effect under No Shade of Tree for Solar Panels (String 1)
|
With Dust and Dirt |
With No Dust & No |
With Partial Dust & |
|
Dirt |
Dirt |
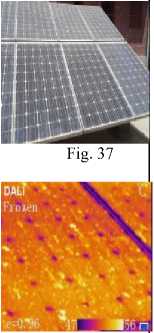
Fig. 37
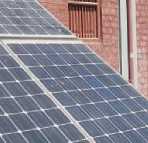
Fig. 38
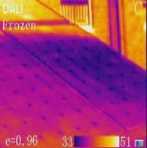
Fig. 41
Fig. 40
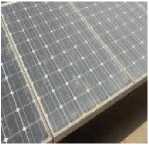
Fig. 39
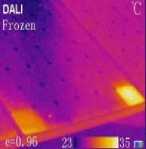
Fig. 42
Fig.37. to fig. 42 Shows Normally Captured Photographs and Thermal Images of Deposition Effects for Solar Panel String1under No Shade of Tree
Normal and Thermal Images for Deposition Effect under Shade of Tree for Solar Panels (String 1)
Dirt Dirt
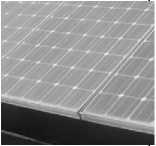
Fig. 43
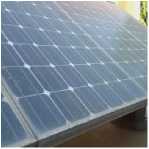
Fig. 44
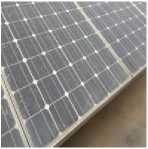
Fig. 45
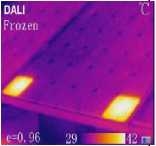
Fig. 46
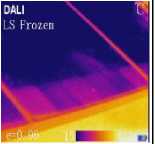
Fig. 47
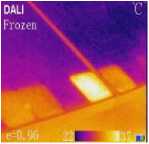
Fig. 48
Fig.43. to fig. 48 Shows Normally Captured Photographs and Thermal Images of Deposition Effects for Solar Panel String1under Shade of Tree
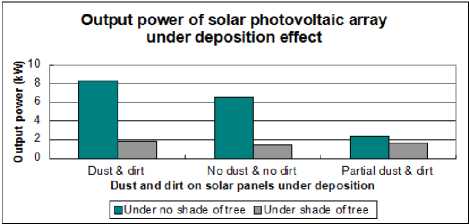
Fig.49. Bar Chart for the Change in Output Power due to Depositions under Shade and under No Shade of Tree
Thermal image processing is a technique to identify the heated regions in thermal images and perform a high level temperature analysis.
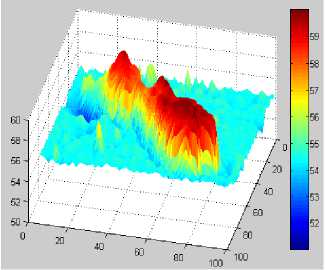
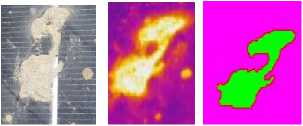
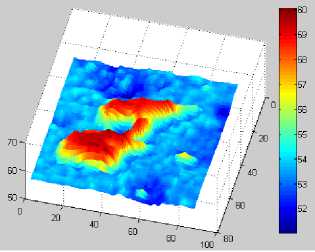
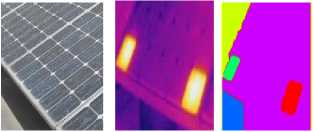
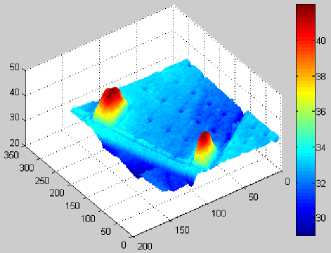
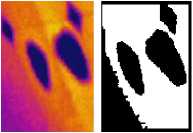
Table 7. Normally Captured Photographs, Thermal images, and 3D Contour of Bird Deposit, Cement Deposit and Hotspot found on the Surface of Solar Panels
Hotspot s on Solar Panel Surface
S.
No.
Name of Deposit/ Defect
Bird Deposit on Surface of Solar Panel
Cement Deposit on Surface of Solar Panel
Type of
(Normal/Thermal/Segmented/3D)
Image
Normal Image Thermal Image Segmented Image
3D Temperature Plot
Bubble s at the Back Sheet Surface of Solar Panel
Normal Image Thermal Image Segmented Image
3D Temperature Plot
Normal Image Thermal Image Segmented Image
3D Temperature Plot
Normal Image Thermal Image Segmented Image
3D Temperature Plot
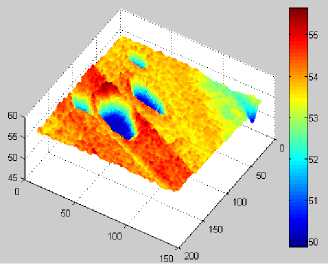
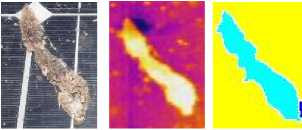
The table 7 shows the normally captured photographs, thermal images, and 3D temperature plot of bird deposit, cement deposit and hotspot found on the surface of solar panels. The image processing is helpful to get the temperature of different depositions (bird deposition, cement deposition) and defects (hotspots, bubbles) evolved in solar panels when operated under natural atmospheric conditions.
The thermal image shows heat emitted by the object on solar panel surface. When image segmentation is applied to thermal images, the desired hot portion is segmented from thermal image and shown with pseudo-colors.
The thermal image is analyzed further to obtain a 3D temperature plot of the desired segmented object using MATLAB image processing. 3D temperature plots for bird deposit, cement deposit, hot spots show high temperature regions with a temperature scale indicating the temperature of maximum points.
-
VII. Results and Discussion
The paper discusses a real time analysis to detect the defects in solar panels by physical inspection, thermal inspection and image processing technique. It also shows how the generated output power of solar photovoltaic panels vary due to the effect of tree shading and dust, dirt and other deposition effects.
The experimental work includes the identification of the defects by visual inspection as well as with thermal imaging camera. The effect of soil deposition, bird deposits and cement deposits increase the temperature of solar panel surface, which is not visible in the photographs captured by normal camera. Such heat effects can be detected by thermal imaging camera easily. Besides above defects some problems like bubble, rupture at back sheet of solar module, formation of hot spots and shading of tree on the solar panels are also visualized through thermal imaging camera. In the last part of work a 3D temperature plot of the depositions and defects are generated which shows the importance of image processing in the field of thermal imaging. The following table 8 and table 8 shows maximum temperature, minimum temperature obtained from thermal images for case 1 and case 2 to study how temperature variation occurs during tree shading and different deposition effects.
Table 8. Temperature Variations in String 1, 2, 3, 4 obtained from Thermal Images for Case 1
|
Panel /String |
No Shade |
Shade |
||||||
|
Str1 |
Str2 |
Str3 |
Str4 |
Str1 |
Str2 |
Str3 |
Str4 |
|
|
T max (ºC) |
54 |
51 |
51 |
50 |
35 |
39 |
32 |
32 |
|
T min (ºC) |
45 |
43 |
39 |
38 |
23 |
26 |
19 |
20 |
|
T amb (ºC) |
32 |
32 |
32 |
32 |
30 |
30 |
30 |
30 |
The table 8 shows how maximum and minimum temperature vary in solar panel string1, string 2, string 3, string 4 under the shading effect of tree. As there was no shade the temperature was high but as shade of tree falls on solar panel strings, the temperature of the shaded portion becomes low. The table 9 shows variation of maximum and minimum temperature for different types of depositions (soil deposits, bird beat deposits and cement deposits) under shading effect of tree. The temperature of solar panel for particular deposition becomes high under no shade of tree, but for deposits under shade of tree is low. The bright color of thermal image shows high temperature and dark color shows low temperature.
Table 9. Temperature Variation in String 1 obtained from Thermal Images for Case 2
|
Panel/ String1 |
Dust & Dirt |
No Dust & No Dirt |
Partial Dust & Dirt |
Dust & Dirt |
No Dust & No Dirt |
Partial Dust & Dirt |
||
|
No Shade of Tree |
Shade of Tree |
|||||||
|
T max (ºC) |
56 |
51 |
35 |
42 |
32 |
37 |
||
|
T min (ºC) |
47 |
33 |
23 |
29 |
15 |
22 |
||
|
T amb (ºC) |
16 |
23 |
19 |
25 |
23 |
27 |
||
-
VIII. Conclusion
The research paper presents a detail report on identification of various defects through visual inspection and infrared THERMOGRAPHY and MATLAB image processing technique under the influence of atmospheric conditions. The effect of dust, shade of tree leaves, dirt (bird deposits, cement deposits and soil) on the surface of solar panels, with hotspots and bubbles are detected and analyzed by thermal image processing approach. These depositions and natural conditions affect health condition of solar panels and cause a reduction in generating power of solar panels which are shows in tables, bar charts and 3D temperature plots.
References Analyzing defects of solar panels under natural atmospheric conditions with thermal image processing
- Redfield, D., “Solar energy and conversion”, Technology and Society, IEEE Journals and Magazines, vol. 6, no. 23, pp. 4-9, 1978.
- Biran, D., Braunstein, A., “Solar radiation and energy measurements”, IEEE Trans. Power Apparatus and Systems, vol. 95, no. 3, pp. 791-794, 1976.
- Al-Tabtabaei, J.A., “Studying the Factors Affecting the Solar Power Generation Systems Performance (SPGSP)”, Int. J. Engineering Research and Applications, vol. 4, no. 12, part-2, pp. 30-58, 2014.
- Al-Tabtabaei, J.A., “Reviewing the factors of the Energy systems for Improving the Energy Efficiency”, Int. J. Engineering Research and Applications, vol. 5, no. 8, part-4, pp. 57-64, 2015.
- Rizwan, M., Jamil, M., Kothari, D.P., “Generalized Neural Network Approach for Global Solar Energy Estimation in India”, IEEE Trans. on Sustainable Energy, vol. 3, no. 3, pp. 576-584, 2012.
- Pant, S., “Resources of Renewable Energy in India”, Int. J. Engineering Research and Applications, vol. 6, no. 8, part-3, pp. 60-64, 2016.
- Manchanda, H., Kumar, M., “A Comprehensive Decade Review and Analysis on Designs and Performance Parameters of Passive Solar Still”, J. Renewables: Wind, Water and Solar, Springer, vol. 2, no. 17, pp. 1-21, 2015.
- Hu, Y., Cao, W., Ma, J., “Identifying PV Module Mismatch Faults by a Thermography Based Temperature Distribution Analysis”, IEEE Trans. Device and Materials Reliability, vol. 14, no. 4, pp. 951-960, 2014.
- Akram, M.N., Lotfifard, S., “Modeling and Health Monitoring of DC Side of Photovoltaic Array”, IEEE Trans. Sustainable Energy, vol. 6, no. 4, pp. 1245-1253, 2015.
- Dorobantu, L., Popescu, M.O., Popescu, C.L., et al., “Depositions Effects and Losses Caused by Shading on Photovoltaic Panels”, IEEE Conf. Proceedings, 3rd Int. Youth Conf. on Energetics (IYCE), Leiria, pp. 1-5, 2011.
- “Hand Book for Solar Photovoltaics (PV) Systems” by Organisations-Solar Energy Research Institute of Singapore, Grenzone Pte Ltd, Phoenix Solar Pte Ltd, Singapore Polytechnic, SP Power Grid, Urban Redevelopment Authority, pp. 7-9.
- Rogalski, A., “History of Infrared Detectors”, Opto-Electronics Review, Springer, vol. 20, no. 3, pp. 279-308, 2012.
- Chaudhary, A.S., Chaturvedi, D.K., “Observing Hotspots and Power Loss in Solar Photovoltaic Array Under Shading Effects Using Thermal Imaging Camera”, Int. J. Electrical Machines and Drives, Journals Publications, vol. 3, no. 1, pp. 15-23, 2017.
- Barreira, E., de Freitas, V.P., Delgado, J.M.P.Q., et. al., “Thermography Applications in the Study of Buildings Hygrothermal Behaviour”, Dr. R. V. Prakash, (Ed), pp. 171-192, 2012.
- Lin, X., Wang, Y., Pedram, M., “Designing Fault-Tolerant Photovoltaic Systems”, IEEE Design and Test, Journals and Magazines, vol.31, no. 3, pp. 76-84, 2013.
- Spagnuolo, G., Xioa, W., Ceacati C., “Monitoring, Diagnosis, Prognosis, and Techniques for Increasing the Lifetime/Reliability of Photovoltaic Systems”, IEEE Trans. Industrial Electronics, vol. 65, no. 11, pp. 7226-7227, 2015.
- Davarifar, M., Rabhi, A., Hajjaji A.E., “Comprehensive Modulation and Classification of Faults and Analysis Their Effect in DC Side of Photovoltaic System”, J. Energy and Power Engineering, Scientific Research, vol. 5, pp. 230-236, 2013.
- Chaudhary, A.S., Yadav, A., “An Overview of Faults and Health Monitoring Estimation of Solar Photovoltaic Power Generation”, Int. J. Power Electronics Controllers and Converters, vol. 2, no. 2, pp. 19-23, 2016.
- Karthick, C., Idrissyedismail, S., Arunkailasam, E., et al., “A Novel Based on Soldier Tracking and Health Monitoring System Using Embedded Technology”, The Int. J. Science and Technoledge, vol. 3, no. 3, pp. 212-217, 2015.
- Bagyasri, C. K., Anto Merline, M., “Self Monitoring Vital Signs Measurement using Solar Power”, Int. J. Communication and Computer Technologies, vol. 2, no. 19, issue. 5, pp. 52-56, 2014.
- Voss, T. J., Subbian, V., Beyette, F. R., “Feasibility of Energy Harvesting Techniques for Wearable Medical Devices”, IEEE 36th Annual Int. Conf. Engineering in Medicine and Biology Society (EMBC), Chicago, ILLinois, USA, pp. 626-629, 2014.
- Rathore, A., Panwar, A., Kumari, D., et al., “A Review on Applications of GSM for Monitoring System”, Int. J. Recent Scientific Research, vol. 6, no. 5, pp. 3778-3780, 2015.
- Chae, M. J., Yoo, H. S., Kim, J. R., et al., “Bridge Condition Monitoring System using Wireless Network (CDMA and ZIGBEE)”, 23rd International Symposium on Automation and Robotics in Construction (ISARC), Tokyo, Japan, pp. 32-334, 2006.
- Park, G., Rosing, T., Todd, M. D., et al., “Energy Harvesting for Structural Health Monitoring Sensor Networks”, J. Infrastructure Systems, vol. 14, no. 1, pp. 64-79, 2008.
- Hodge, V. J., O’Keef, S., Weeks, M., et al., “Wireless Sensor Networks for Condition Monitoring in Railway Industry:A Survey”, IEEE Trans. Intelligent Transportation Systems, vol.16, no. 3, pp. 1088-1016, 2015.
- Kim, J-T., Sim, S-H., Cho, S., et al., “Recent R&D Activity on Structural Health Monitoring in Korea”, Structural Monitoring and Maintenance, Techno-Press Ltd, vol. 3, no. 1, pp. 91-114, 2016.
- Worden, K., Cross, E. J., Dervilis, N., et al. , “Structural Health Monitoring: From Structures to System-of-Systems”, 9th IFAC Symposium on Fault Detection, Supervision and Safety for Technical Processes SAFEPROCESS, Paris, Elsevier, vol. 48, no. 21, pp. 1-17, 2015 .
- Jang, S., Jo, H., Cho, S., et al., “Structural Health Monitoring of a Cable-Stayed Bridge using Smart Sensor Technology: Deployment and Evaluation”, Smart Structures and Systems, vol. 6, no. 5-6, pp. 439-459, 2010
- Martinez-Luengo, M., Kolios, A., Wang, L., “Structural Health Monitoring of Offshore Wind Turbines: A Review Through the Statistical Pattern Recognition Paradigm”, Renewable and Sustainable Energy Reviews, Elsevier, vol. 64, no. , pp. 91-105, 2015.
- Nandi, S., Toliyat, H. A., Li, X., “Condition Monitoring and Fault Diagnosis of Electrical Motors-A Review”, IEEE Trans. Energy Conversion, vol. 20, no. 4, pp. 719-729, 2005.
- Dubey, Rajeev., Chattopadhaya, S., Kuthanazhi, V., et. al., “All-India Survey of Photovoltaic Module Degradation:2013”, Report of National Centre for Photovoltaic Research and Education (NCPRE), IIT Bombay, Solar Energy Centre, Gurgaon, pp. 89-93, 2013.
- Shapiro, D., Robbins, C., Ross, P., “Solar PV operation & Maintenance Issues”, Desert Research Institute, pp. 1-13.
- Makenzi, M., Timonah, N., Benedict, M., et. al., “Degradation Prevalence Study of Field-Aged Photovoltaic Modules operating under Kenyan Climate Conditions”, Science Journal of Energy Engineering, vol. 3, no. 1, pp. 1-5, 2015.
- Munoz, M.A., Alonso-Garsia, M.C., Vela, N., et. al., “Early Degradation of Silicon PV Modules and Guaranty Conditions”, Solar Energy Elsevier, vol. 85, no. 9, pp. 2264-2274, 2011.
- Mohd, S., Boumediene, B., Miloud, B., “Assessment of PV Modules Degradation based on Performances and Visual Inspection in Algerian Sahara”, Int. J. Renewable Energy Research, vol. 6, no. 1, pp. 106-116, 2016.
- E. Kaplani, “Detection of Degradation Effects in Field-Aged C-Si Solar Cells through IR Thermography and Digital Image Processing”, Int. J. Photoenergy, vol. 2012, pp. 1-11, 2012.
- Chaudhary, A.S., Chaturvedi, D.K., “Thermal Image Analysis and Segmentation to Study Temperature Effects of Cement and Bird Deposition on Surface of Solar Panels”, I.J. Image, Graphics and Signal Processing, MECS Press, vol. 9, no. 12, pp. 12-22, 2017.
- Chaudhary, A.S., Chaturvedi, D.K., “Thermal Image Analysis and Segmentation to Study Temperature Effects of Cement and Bird Deposition on Surface of Solar Panels”, I.J. Image, Graphics and Signal Processing, MECS Press, vol. 9, no. 12, pp. 12-22, 2017.
