Analyzing the Performance of SVM for Polarity Detection with Different Datasets

Author: Munir Ahmad, Shabib Aftab
Journal: International Journal of Modern Education and Computer Science (IJMECS) @ijmecs
Article in issue: 10 vol.9, 2017.
Free access
Social media and micro-blogging websites have become the popular platforms where anyone can express his/her thoughts about any particular news, event or product etc. The problem of analyzing this massive amount of user-generated data is one of the hot topics today. The term sentiment analysis includes the classification of a particular text as positive, negative or neutral, is known as polarity detection. Support Vector Machine (SVM) is one of the widely used machine learning algorithms for sentiment analysis. In this research, we have proposed a Sentiment Analysis Framework and by using this framework, analyzed the performance of SVM for textual polarity detection. We have used three datasets for experiment, two from twitter and one from IMDB reviews. For performance evaluation of SVM, we have used three different ratios of training data and test data, 70:30, 50:50 and 30:70. Performance is measured in terms of precision, recall and f-measure for each dataset.
Sentiment Analysis, Polarity Detection, Data Classification, Machine Learning, Support Vector Machine, SVM
Short address: https://sciup.org/15015008
IDR: 15015008
Text of the scientific article Analyzing the Performance of SVM for Polarity Detection with Different Datasets
Published Online October 2017 in MECS DOI: 10.5815/ijmecs.2017.10.04
Online textual data is increasing day by day, especially due to social media (Facebook, Twitter) and other blogging websites. The organizations can use this massive amount of data with the help of sentiment analysis tools/techniques to monitor their clients’ response regarding products or services and can take prompt action to resolves their issues such as increase the quality or decrease the prices etc. For sentiment analysis, usually three approaches are used: lexicon based, machine learning based and hybrid [1],[2]. Lexicon based approach uses lexicons of weighted words instead of using any training set, The particular weighted words are used with their sentiment orientation for identification of overall sentiment from a given text [3]. Some of the well- known lexicon based techniques includes SentiStrength 3.0, SentiWordNet, WordNet, Linguistic Inquiry and Word Count (LIWC), Affective Norms for English Words(ANEW) and SenticNet as discussed in [4]. Some well-known machine learning techniques are Maximum Entropy, Stochastic Gradient Descent, Random Forest, SailAil Sentiment Analyzer, Multi Layer Perceptron, Naïve Bayes, Multinomial Naïve Bayes and Support Vector Machine as discussed by [5]. In supervised machine learning approach, first the training dataset is needed to train the algorithm. Training dataset includes the predefined output class with which the algorithm makes the rules and get itself trained and then classify the real input data also called test data [11], [41]. A hybrid approach is a combination of lexicon based and machine learning based approaches, this approach generally returns better results. Most commonly used hybrid techniques/tools include pSenti [6], SAIL [7], NILC_USP [8] and Alchemy API [9] as discussed in detail by [10].
This research aims to investigate the performance of Support Vector Machine (SVM) for polarity detection with three datasets. Moreover, three ratios of training data and test data are used for comparative analysis: 70:30, 50:50, 30:70 to check the level of dependency of results on percentage of training data. SVM is one of the widely used supervised machine learning algorithms for sentiment analysis and was formerly introduced by [12]. It is a prevalent machine learning based classification method which has proved to be highly effective in categorization of traditional texts and generally outperform Naïve Bayes classifiers as explained by [13], [41]. In this study, we have proposed Sentiment Analysis Framework (SAF), which consists of four phases: Dataset, Preprocessing, Classification and Results. Preprocessing phase further has five steps: Term Frequency-Inverse Document Frequency (TF-IDF), Stemming, Stop Words, Tokenizing and Words to Keep.
-
II. Related Work
The Prompt increase of online contents has generated a very immense impact on our daily lives, not only in terms of social collaborations but also in almost every aspect: from e-commerce to politics. Several tools and algorithms are available to extract and classify the sentiments from online user generated text to positive, negative or neutral. In [14], the authors have used three different machine learning algorithms: Naïve Bayes, Decision Tree and Support Vector Machine for sentiment classification of Arabic dataset which was obtained from twitter. The authors have followed a framework for Arabic tweets classification in which two special subtasks were performed in pre-processing, Term FrequencyInverse Document Frequency (TF-IDF) and Arabic stemming. They have used one dataset with three algorithms and performance was evaluated on the basis of three information retrieval metrics: precision, recall, and f-measure. In [15], the authors used five different classification algorithms Naïve Bayes, Decision Tree, Support Vector Machine, Neural Network and Random Forest for the prediction of rainfall in Malaysia. The authors have performed the comparative analysis to identify the technique(s), which can give good result with low training data. Performance evaluation showed that Decision Tree and Random Forest both have high potential to be got well trained for higher F-measure with lower amount of training data. According to results, Support Vector Machine and Naive Bayes brought lower F-measure, when got trained with little amount of data. In the case of Neural Network, the authors have highlighted that it requires large amount of training data to predict very little amount of test data. In [16], the authors have proposed an efficient feature vector technique by dividing the feature extraction process in two steps after the preprocessing. In first step, those features are extracted which are twitter specific and then added to feature vector. After that these features are removed from the tweets and then again the feature extraction process is done just like it is done for normal text. These extracted features were also added to the feature vector. The accuracy of the proposed feature vector technique is same for Nave Bayes, SVM, Maximum Entropy and Ensemble classifiers. However, this technique performed well for the domain of electronic products. In [17], the authors have highlighted the effect of preprocessing feature in sentiment classification process of 1000 Arabic tweets by comparing their implemented stemmer and light stemmer. They have used two approaches for comparative analysis, Machine Learning and Semantic Orientation. They have showed that their stemmer achieved 1% of improvement with Machine Learning approach. However, with
semantic orientation approach, the improvement was 0.5%. In Machine learning approach, the authors have used SVM once before applying the preprocessing phase and then again used after each stage of preprocessing to analyze the system's performance and finally claimed 4.5 percent improvements in all measures. Same way was adopted with semantic orientation approach and achieved
2-7% improvement in different measures. Authors in [18] analyzed the performance of two classification algorithms, J48 and Multilayer Perceptron on five datasets. They have used different accuracy measures such as TP rate, FP rate, Precision, Recall, F-measure and ROC Area. Overall MLP performed better on each dataset. According to the authors, neural networks are not considered to be a good choice for data mining purpose however, their results showed the different story. Which is: that the neural network has the better learning capability and can be a good option for classification problems. In [19], the authors used the medical data for the comparison of different data mining techniques: J48, MLP, Naïve Bayes, Radial Basis Function and K-Nearest Neighbor. Data was collected based on six parameters from 40 patients of posterior cancer. According to results, Radial Basis Function performed much better as it performed very well in classification accuracy and Kappa score. Moreover, J48 and K-Nearest Neighbor have a mean classification accuracy of 92%.
In [20], the authors have performed comparative analysis of many classification algorithms for NSL-KDD based dataset in WEKA environment by using 41 attributes. From KDD dataset, 94,000 instances were used for training dataset and over 48,000 were used as test data set. Moreover, for ranking purpose, Garrett's Ranking Technique was used to rank different classifiers as per their performance. Rotation Forest classification technique performed better as compared to the rest. Researchers in [21] Presented an analysis regarding prediction of survivability of the burn patients. Data of 180 patients was used with the attributes i.e. age, sex and size of bum for 8 different parts of body. 104 records used for training and the remaining 76 for testing. C4.5 Decision tree algorithm was used for the classification and prediction using WEKA environment with the output prediction of survival or death. The experiment has achieved Sensitivity up to 0.975 in 'surv' class and Specificity achieved up to 0.972. In [22], the authors have proposed RBF, a technique to filter the spam emails. The proposed technique is based on neural network in which neuron are trained. In this study, 1000 spam words are used and the RBF results are compared with SVM for precision and accuracy. The proposed technique showed the better result as compared to SVM. In [23], the authors have analyzed the issues of twitter sentiment analysis and proposed that multiple samples should be selected for performance evaluation. According to them sample specific characteristics can mislead the evaluation of performance. The problem of skewness in datasets was handled by the authors via a technique of SMOTE over sampling which helped to improve the performance of some classifiers. In [24], Three data mining techniques are used to predict and analyze students’ academic performance. The authors have used Decision tree (C4.5), Multilayer Perception and Naïve Bayes. All these techniques were applied on student’s data, collected from 2 undergraduate courses in two semesters. According to the results, Naïve Bayes got the overall prediction accuracy of 86% and outperformed MLP and Decision.
This type of prediction can assist the teachers to early detect those students who are expected to fail in the course. So ultimately, with the teacher’s special care to those students, the academic performance can be improved.
The purpose of this study is to analyze the performance of SVM during the classification of pre labeled tweets and reviews as positive, negative and neutral. In this study three datasets are used, two from twitter [25], [26] and one from IMDB reviews [27]. ‘Sentiment Analysis Framework is proposed in this research (Fig. 1), which is a customized form of ‘Research Method Framework’ followed by [14]. The proposed framework consists of four phases: Data set, Preprocessing, Classification and Results. Dataset phase deals with the insertion of data in to WEKA environment on which the classification has to be performed. Preprocessing Phase deals with the process of normalization of strings into vector format, which will be the input to the classification algorithm. It has further five steps: 1) Term Frequency-Inverse Document Frequency (TF-IDF), 2) Stemming, 3) Stop Words, 4) Tokenizing and 5) WordstoKeep. Classification phase deals with the working of classification algorithm in WEKA. Result phase deals with the production of results in the form of tables and graphs. In this research, Classification is performed three times (on each dataset) with different ratios of training and test data. And Finally the results are concluded and discussed.
-
A. Weka
We have used Weka for performance evaluation of SVM with different datasets. Weka (Waikato Environment for Knowledge Analysis) is very popular and widely used data mining software developed in Java language at the University of Waikato, New Zealand [40]. One of the reason for it’s widely acceptance is that it has GUI for easy access to its functionalities like using of algorithms for data analysis, predictive modeling and visualizations. Further advantages of this software include its general public license and its portability.
-
B. Data Sets
Three datasets are used in this research. In first dataset [25], tweets are related to following four topics: ‘Apple’, ‘Google’, ‘Microsoft’ and ‘Twitter’. It contains 571 positive, 519 negative, 2331 neutral and 1689 irrelevant tweets. In the second dataset [26], tweets are related to all major U.S. airlines from February of 2015 and categorized as 2362 positive, 9178 negative and 3099 neutral. Third dataset [27] taken from Internet Movie Database (IMDB) reviews and contains 1000 positive and 1000 negative texts.
Table 1. Datasets Detail
|
Source |
Positiv e |
Negati ve |
Neutral |
Irrelevan t |
Total |
|
Twitter[25] |
571 |
519 |
2331 |
1689 |
5110 |
|
Airline[26] |
2362 |
9178 |
3099 |
- |
1463 9 |
|
IMDB[27] |
1000 |
1000 |
- |
- |
2000 |
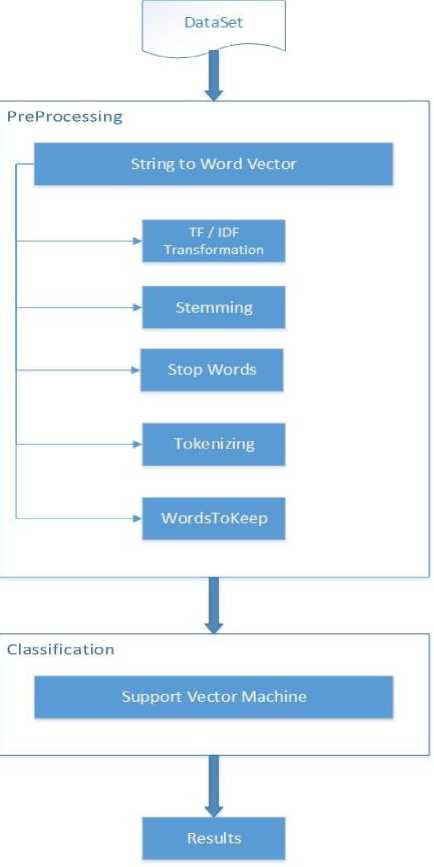
Fig.1. Sentiment Analysis Framework (SAF)
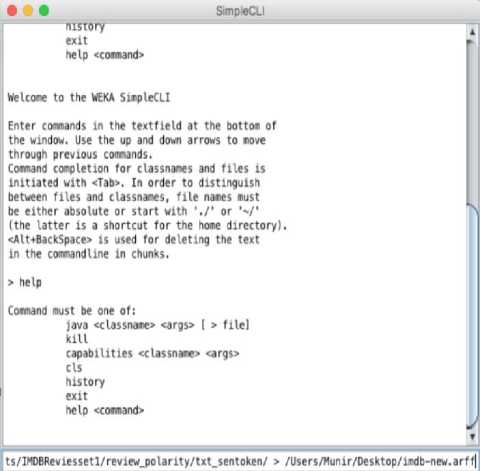
Fig.2. Simple CLI in Weka
-
C. Pre-Processing
It is the most important phase of our framework., in which selected dataset is normalized and get ready for the classification algorithm. In this phase, Strings are converted into vectors for the classification process. Following subtasks are performed in this phase.
-
1- Term Frequency-Inverse Document Frequency (TF-IDF):
TF-IDF provides useful and important information in pre-processing phase. It typically evaluates the frequency of useful words, which eventually make the sentiment detection process easy. Frequency of terms plays an important role in identification of important information as explained by [1]. For example, frequently appearing words in a text document can be ‘Good’, ‘Bad’, ‘Happy’ or ‘Sad’ etc. Identification and frequency of these words can play a vital role in the process of Opinion Mining. Term Frequency(TF) is the number of occurrence for a term in a given document. Following equation can be used to calculate it:
W d (t)=TD(t,d) (1)
Where TD corresponds to frequency of term t in a given document d. TF-IDF contains the inverse document frequency (IDF), that reverts higher weight-age for rare conditions while lower-weight age for common conditions as explained by [29]. IDF can be calculated with following equation:
®Ft = lO (2)
Where N represents number of documents and Nt represents the number of terms. When both TF and IDF parameters are set to true the results are calculated using the following equation:
Wt = TF(t,d).IDFt (3)
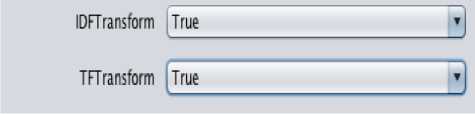
Fig.3. TF and IDF Transform
-
2- Stemming
The process of Stemming is very useful in many areas of computational linguistics and information retrieval as it reduces all words with the same stem/ base to a common form [30], for example the word 'working' will be stemmed in to 'work' and so on. Word Stemming is one of the essential feature of pre-processing in the text mining [31]–[35]. In this study, “IterativeLovinsStemmer” is selected in WEKA as the word stemmer in the preprocessing phase as shown in Fig 4. It is based on the LovinsAlgortihm which was the first Stemming algorithm by Lovins JB in 1968[36].
-
3- MultiStopWords
The Concept of stop words was originally introduced by [37]. These are common high frequency words like “A”, “the”, “of”, “and”, “an". This data is
Unnecessary and does not affect the performance of classification thus; it has to be removed. There are several methods available for stop word removal as explained by [30], [31], [33], [38], [39]. "MultiStopwords" was selected (Fig 4) for stop words criterion for the preprocessing phase in Weka.
-
4- N-GramTokenizer
“N-GramTokenizer” was selected as the Tokenizer in Weka (Fig 4) for pre-processing of data. It first breaks the text into words whenever one of the listed specified characters is detected in it. Afterwards it emits N-Grams of each word of the specified length.
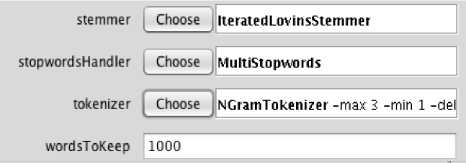
Fig.4. Stemmer, Stopwords, Tokenizer and Wordstokeep
-
5- WordstoKeep
1000 words were kept in the “wordstokeep” parameter to narrow down results within a limited amount of time. After applying these parameters as shown in fig 4, the pre-processing on all three datasets were carried out and then, the processed datasets were forwarded to the classifier.
-
D. Classification
In supervised machine learning approach, first the algorithm is trained with the training data and then it is applied on the real input data (test data). We can analyze the performance of any supervised learning algorithm by providing the pre classified data as test data. In this research we have first obtained pre-labeled datasets. The text chunks in the datasets are already labeled as 'positive', 'negative' and 'neutral'. The process of analyzing aims to train the algorithm first with some of the portion of dataset and then remaining part of dataset is given as test data. Then the output result of test data is compared with the pre-labeled test data. For classification we have used Support Vector Machine (SVM), one of the famous machine learning algorithm which follows the supervised learning approach.
Three different datasets are used for classification to particularly check that whether the performance is dataset and ratio (training data: test data) dependent or not? Three different ratios are used of training data and test data (training data: test data): 1) 70:30, 2) 50:50 and 3) 30:70.
-
IV. Results and Discussion
This section focuses on the comparative analysis of SVM performance. For comparison, three evaluation parameters are used in this study: Precision, Recall and F-Measure.
The precision can be calculated using TP and FP rate as shown below:
Precision =
TP
(TP + FP)
TP used for the sentences, which are correctly classified, and FP is for sentences, which are wrongly classified.
Recall can be calculated as shown below:
TP
Recall = TP (TP + FN)
FN is used for non-classified sentences and TP is for correctly classified sentences (as explained above).
F-measure can be computed as bellow:
F-measure =
Precision ∗ Recall ∗ 2 (Precision + Recall)
A. Results with First Dataset
First dataset is taken from [25] and contains the tweets regarding four particular words: ‘Apple’, ‘Google’, ‘Microsoft’ and ‘Twitter’. Three proportions of trainingdata and test-data (training data: test data) are used for the classification of each dataset. The experimental results show that with the 70:30 (ratio) the average Precision, Recall and F-Measure is 70.4%, 70.3% and 56.3% respectively. With 50:50, the average Precision, Recall and F-Measure is 68.1%, 67.7% and 67.9% respectively. Moreover, with the 30:70 the average Precision, Recall and F-Measure is 65.0%, 64.6% and 64.8% respectively.
Table 2. Ratio wise Precision, Recall and F-Measure for First Dataset
|
Distribution |
Class |
Precision |
Recall |
F-Measure |
|
70% - 30% |
Negative |
0.5 |
0.569 |
0.532 |
|
Positive |
0.412 |
0.377 |
0.394 |
|
|
Neutral |
0.726 |
0.717 |
0.721 |
|
|
Irrelevant |
0.836 |
0.833 |
0.835 |
|
|
Average |
0.704 |
0.703 |
0.563 |
|
|
50% - 50% |
Negative |
0.434 |
0.505 |
0.467 |
|
Positive |
0.373 |
0.353 |
0.363 |
|
|
Neutral |
0.706 |
0.702 |
0.704 |
|
|
Irrelevant |
0.827 |
0.8 |
0.813 |
|
|
Average |
0.681 |
0.677 |
0.679 |
|
|
30% - 70% |
Negative |
0.367 |
0.416 |
0.39 |
|
Positive |
0.322 |
0.312 |
0.317 |
|
|
Neutral |
0.691 |
0.691 |
0.685 |
|
|
Irrelevant |
0.794 |
0.794 |
0.789 |
|
|
Average |
0.65 |
0.646 |
0.648 |
These results are arranged in Table 2 and change of trend with change of proportions is shown with graph (Fig 5).
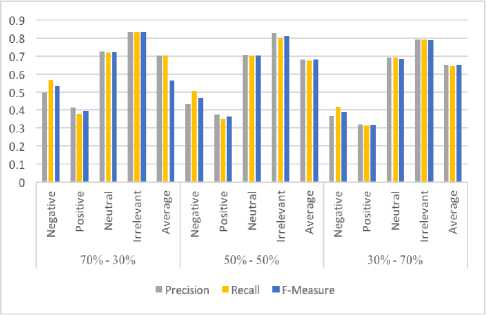
Fig.5. Precision, Recall and F-measure
The results show that the ratio 70:30 performed the best for Precision and Recall in this dataset at average while the ratio 50:50 performed better for F-Measure on average.
-
B. Results with Second Dataset
Second dataset is taken from [26] and contains the tweets regarding major US airlines. According to the experimental results with (ratio) 70:30 the average Precision, Recall and F-Measure is 77.6%, 77.8% and 77.6% respectively. With 50:50 the average Precision, Recall and F-Measure is 77.2%, 77.4% and 77.3% respectively. And for the 30:70 the average Precision, Recall and F-Measure was 75.6%, 75.6% and 75.6% respectively.
50:50 the average Precision, Recall and F-Measure was 80.4%, 80.4% and 80.4% respectively. And for 30:70 the average Precision, Recall and F-Measure was 78.0%, 78.0% and 78.0% respectively. These results can be seen in Table 4 while the change of trend with the change of proportions can be seen with graph in Fig. 7 below. The results show that the ratio 50:50 performed the best for this dataset on average. The precision, Recall and F-Measure for this proportion outperformed the other two proportions.
Table 3. Ratio wise Precision, Recall and F-Measure for Second Dataset
|
Distribution |
Class |
Precision |
Recall |
F-Measure |
|
70% - 30% |
Negative |
0.851 |
0.874 |
0.862 |
|
Neutral |
0.603 |
0.606 |
0.604 |
|
|
Positive |
0.713 |
0.633 |
0.671 |
|
|
Average |
0.776 |
0.778 |
0.776 |
|
|
50% - 50% |
Negative |
0.851 |
0.869 |
0.86 |
|
Neutral |
0.599 |
0.593 |
0.596 |
|
|
Positive |
0.682 |
0.635 |
0.657 |
|
|
Average |
0.772 |
0.774 |
0.773 |
|
|
30% - 50% |
Negative |
0.842 |
0.846 |
0.844 |
|
Neutral |
0.572 |
0.579 |
0.575 |
|
|
Positive |
0.656 |
0.631 |
0.643 |
|
|
Average |
0.756 |
0.756 |
0.756 |
Table 4. Ratio wise Precision, Recall and F-Measure for Third Dataset
|
Distribution |
Class |
Precision |
Recall |
F-Measure |
|
70% - 30% |
Negative |
0.793 |
0.79 |
0.791 |
|
Positive |
0.784 |
0.786 |
0.785 |
|
|
Average |
0.788 |
0.788 |
0.788 |
|
|
50% - 50% |
Negative |
0.803 |
0.803 |
0.803 |
|
Positive |
0.805 |
0.805 |
0.805 |
|
|
Average |
0.804 |
0.804 |
0.804 |
|
|
30% - 70% |
Negative |
0.793 |
0.761 |
0.776 |
|
Positive |
0.768 |
0.799 |
0.783 |
|
|
Average |
0.78 |
0.78 |
0.78 |
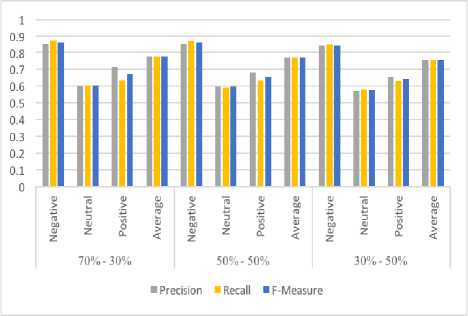
Fig.6. Precision, Recall and F-measure
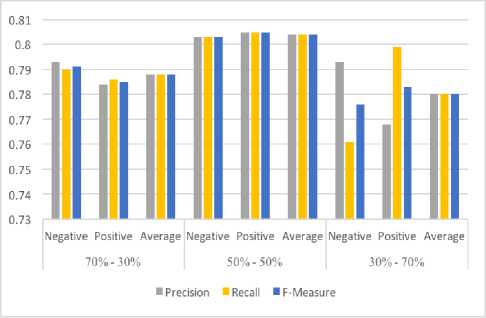
Fig.7. Precision, Recall and F-measure
Results are presented in Table 3 and reflection of trend changing according to proportions is presented in graph in Fig. 6. The results show that the ratio 70:30 out performed in Precision, Re-call and F-Measure on average.
-
C. Results with Third Dataset
Third dataset was taken from [27] and contains the IMDB reviews. The experimental results showed that for the ratio 70:30 the average Precision, Recall and F-Measure was 78.8%, 78.8% and 78.8% respectively. For
-
V. Conclusion
In this research, we have analyzed the performance of Support Vector Machines (SVM) for polarity detection in Weka environment. The SVM technique is applied on three different pre-labeled datasets. Two datasets are taken from Twitter and one dataset is taken from IMDB Movie Reviews. Moreover, Sentiment Analysis Framework is proposed in this study for effective and smooth procedure of polarity detection. The proposed framework consists of four phases: Data set,
Preprocessing, Classification and Results. Preprocessing is the most important phase and further consists of five steps including TF-IDF, Stemming, StopWords, Tokenizing and WordstoKeep. For classification of each dataset, three ratios of Training Data and Test Data are used: 70:30, 50:50 and 30:70. The ratio 70:30 with First Dataset performed better in precision and recall while 50:50 performed better in F-Measure. For the Second dataset,70:30 outperformed the other two. For Third dataset, the 50:50 performed average.
We have concluded that performance of SVM depends upon dataset as well as on the ratio of Training and Test Data. Results are arranged in tabular and in graphical forms. This research can be used as the baseline for further comparative studies of other machine learning algorithms by using different and large datasets.
References Analyzing the Performance of SVM for Polarity Detection with Different Datasets
- B. Pang and L. Lee, “Opinion mining and sentiment analysis,” Found. Trends Inf. Retr., vol. 2, no. 1–2, pp. 1–135, 2008.
- H. Saif, Y. He, M. Fernandez, and H. Alani, “Contextual semantics for sentiment analysis of Twitter,” Inf. Process. Manag., vol. 52, no. 1, pp. 5–19, 2016.
- M. Taboada, J. Brooke, M. Tofiloski, K. Voll, and M. Stede, “Lexicon-Based Methods for Sentiment Analysis,” Comput. Linguist., vol. 37, no. 2, pp. 267–307, 2011
- M. Ahmad, S. Aftab, S. S. Muhammad, and U. Waheed, “Tools and Techniques for Lexicon Driven Sentiment Analysis : A Review,” Int. J. Multidiscip. Sci. Eng., vol. 8, no. 1, pp. 17–23, 2017.
- M. Ahmad, S. Aftab, S. S. Muhammad, and S. Ahmad, “Machine Learning Techniques for Sentiment Analysis: A Review,” Int. J. Multidiscip. Sci. Eng., vol. 8, no. 3, pp. 27–32, 2017.
- A. Mudinas, D. Zhang, and M. Levene, “Combining lexicon and learning based approaches for concept-level sentiment analysis,” Proc. First Int. Work. Issues Sentim. Discov. Opin. Min. - WISDOM ’12, pp. 1–8, 2012.
- N. Malandrakis, A. Kazemzadeh, A. Potamianos, and S. Narayanan, “SAIL : A hybrid approach to sentiment analysis,” vol. 2, no. SemEval, pp. 438–442, 2013.
- P. P. Balage Filho and T. A. S. Pardo, “NILC{_}USP: A Hybrid System for Sentiment Analysis in Twitter Messages,” in Second Joint Conference on Lexical and Computational Semantics (*SEM), Volume 2: Proceedings of the Seventh International Workshop on Semantic Evaluation (SemEval 2013), 2013, vol. 2, no. SemEval, pp. 568–572.
- “AlchemyAPI.” [Online]. Available: https://www.ibm.com/watson/alchemy-api.html.
- M. Ahmad, S. Aftab, I. Ali, and N. Hameed, “Hybrid Tools and Techniques for Sentiment Analysis: A Review,” Int. J. Multidiscip. Sci. Eng., vol. 8, no. 3, 2017.
- E. Cambria, B. B. Schuller, Y. Xia, and C. Havasi, “New Avenues in Opinion Mining and Sentiment Analysis,” IEEE Intell. Syst., vol. 28, no. 2, pp. 15–21, 2013.
- N. Cristianini and J. Shawe-Taylor, An introduction to Support Vector Machines, vol. 47, no. 2. 2000.
- J. Khairnar and M. Kinikar, “Machine Learning Algorithms for Opinion Mining and Sentiment Classification,” Int. J. Sci. Res. Publ., vol. 3, no. 6, pp. 1–6, 2013.
- M. M. Altawaier and S. Tiun, “Comparison of Machine Learning Approaches on Arabic Twitter Sentiment Analysis,” vol. 6, no. 6, pp. 1067–1073, 2016.
- S. Zainudin, D. S. Jasim, and A. A. Bakar, “Comparative Analysis of Data Mining Techniques for Malaysian Rainfall Prediction,” Int. J. Adv. Sci. Eng. Inf. Technol., vol. 6, no. 6, pp. 1148–1153, 2016.
- Neethu, M. S., and R. Rajasree. "Sentiment analysis in twitter using machine learning techniques." Computing, Communications and Networking Technologies (ICCCNT), 2013 Fourth International Conference on. IEEE, 2013.
- A. Shoukry and A. Rafea, “Preprocessing Egyptian Dialect Tweets for Sentiment Mining,” Fourth Work. Comput. …, no. November, pp. 47–56, 2012.
- R. Arora and Suman, “Comparative Analysis of Classification Algorithms on Different Datasets using WEKA,” Int. J. Comput. Appl., vol. 54, no. 13, pp. 21–25, 2012.
- N. Mallios, E. Papageorgiou, M. Samarinas, and K. Skriapas, “Comparison of machine learning techniques using the WEKA environment for prostate cancer therapy plan,” in Proceedings of the 2011 20th IEEE International Workshops on Enabling Technologies: Infrastructure for Collaborative Enterprises, WETICE 2011, 2011, pp. 151–155.
- T. Garg and S. S. Khurana, “Comparison of classification techniques for intrusion detection dataset using WEKA,” Int. Conf. Recent Adv. Innov. Eng. ICRAIE 2014, 2014.
- B. M. Patil, D. Toshniwal, and R. C. Joshi, “Predicting burn patient survivability using decision tree in WEKA environment,” 2009 IEEE Int. Adv. Comput. Conf. IACC 2009, no. March, pp. 1353–1356, 2009.
- R. Sharma, “E-Mail Spam Detection Using SVM and RBF,” Int. J. Mod. Educ. Comput. Sci., vol. 8, no. April, pp. 57–63, 2016.
- Gokulakrishnan, Balakrishnan, et al. "Opinion mining and sentiment analysis on a twitter data stream." Advances in ICT for emerging regions (ICTer), 2012 International Conference on. IEEE, 2012.
- A. Mueen, B. Zafar, and U. Manzoor, “Modeling and Predicting Students’ Academic Performance Using Data Mining Techniques,” Int. J. Mod. Educ. Comput. Sci., vol. 8, no. 11, pp. 36–42, 2016.
- N. J. Sanders, “Sanders-twitter sentiment corpus,” Sanders Anal. LLC., 2011.
- E. Ikonomovska, “Airline dataset.” [Online]. Available: http://kt.ijs.si/elena_ikonomovska/data.html. [Accessed: 01-May-2017].
- B. Pang and L. Lee, “A Sentimental Education: Sentiment Analysis Using Subjectivity Summarization Based on Minimum Cuts,” 2004.
- E. Frank, M. A. Hall, and I. H. Witten, “The WEKA Workbench,” in Morgan Kaufmann, Fourth Edition, 2016, pp. 553–571.
- T. Tokunaga and I. Makoto, “Text categorization based on weighted inverse document frequency,” Spec. Interes. Groups Inf. Process Soc. Japan (SIG-IPSJ, 1994.
- C. C. Aggarwal and C. X. Zhai, Mining text data. 2013.
- M. Hu and B. Liu, “Mining and summarizing customer reviews,” in Proceedings of the 2004 ACM SIGKDD international conference on Knowledge discovery and data mining - KDD ’04, 2004, p. 168.
- N. Kobayashi, K. Inui, and Y. Matsumoto, “Opinion Mining from Web Documents: Extraction and Structurization,” Trans. Japanese Soc. Artif. Intell., vol. 22, pp. 227–238, 2007.
- H. Jeong, D. Shin, and J. Choi, “FEROM: Feature extraction and refinement for opinion mining,” ETRI J., vol. 33, no. 5, pp. 720–730, 2011.
- G. Mishne, “Experiments with mood classification in blog posts,” Proc. ACM SIGIR 2005 Work. Stylist. Anal. Text Inf. Access, p. 19, 2005.
- S. Stymne, “Pre- and Postprocessing for Statistical Machine Translation into Germanic Languages,” Proc. 49th Annu. Meet. Assoc. Comput. Linguist. Student Sess., no. June, pp. 12–17, 2011.
- J. B. Lovins, “Development of a stemming algorithm,” Mech. Transl. Comput. Linguist., vol. 11, no. June, pp. 22–31, 1968.
- H. P. Luhn, “The Automatic Creation of Literature Abstracts,” IBM J. Res. Dev., vol. 2, no. 2, pp. 159–165, 1958.
- D. K. Ly, K. Sugiyama, Z. Lin, and M.-Y. Kan, “+Product Review Summarization from a Deeper Perspective,” Proc. 11th ACM/IEEE-CS Jt. Conf. Digit. Libr., no. July, pp. 311–314, 2011.
- N. Archak, A. Ghose, and P. G. Ipeirotis, “Show me the Money ! Deriving the Pricing Power of Product,” Proc. 13th ACM SIGKDD Int. Conf. Knowl. Discov. data Min. - KDD ’07, pp. 56–65, 2007.
- Weka: http://www.cs.waikato.ac.nz/~ml/weka/
- M. Zavvar, M. Rezaei, and S. Garavand, “Email Spam Detection Using Combination of Particle Swarm Optimization and Artificial Neural Network and Support Vector Machine,” Int. J. Mod. Educ. Comput. Sci., vol. 7, no. July, pp. 68–74, 2016
