Analyzing the performance of various clustering algorithms

Author: Bhupesh Rawat, Sanjay Kumar Dwivedi
Journal: International Journal of Modern Education and Computer Science @ijmecs
Article in issue: 1 vol.11, 2019.
Free access
Clustering is one of the extensively used techniques in data mining to analyze a large dataset in order to discover useful and interesting patterns. It partitions a dataset into mutually disjoint groups of data in such a manner that the data points belonging to the same cluster are highly similar and those lying in different clusters are very dissimilar. Furthermore, among a large number of clustering algorithms, it becomes difficult for researchers to select a suitable clustering algorithm for their purpose. Keeping this in mind, this paper aims to perform a comparative analysis of various clustering algorithms such as k-means, expectation maximization, hierarchical clustering and make density-based clustering with respect to different parameters such as time taken to build a model, use of different dataset, size of dataset, normalized and un-normalized data in order to find the suitability of one over other.
Cluster analysis, k-means algorithm, Hierarchical algorithm, Expectation maximization, Make density-based clustering, Agglomerative clustering, Divisive clustering, Birch, Cure
Short address: https://sciup.org/15016824
IDR: 15016824 | DOI: 10.5815/ijmecs.2019.01.06
Text of the scientific article Analyzing the performance of various clustering algorithms
Published Online January 2019 in MECS DOI: 10.5815/ijmecs.2019.01.06
Data is vital to an organization as it helps in ‘strategy formulation’ and ‘decision making’ among others. However, for data to be useful, it needs to be converted into useful knowledge. However, earlier the extraction of knowledge was difficult as data mining techniques did not have sufficient features to extract this knowledge efficiently. Moreover, queries and reports were not capable of discovering this knowledge [15] and statistical methods could operate on numeric data only. However, with the emergence of data mining techniques, discovering information from data has become easier. Now, we could perform a range of tasks such as classification, clustering, neural networks, association, sequence-based analysis, estimation, summarization, trend analysis and visualization with data mining tools [1][13]. The primary goal of data mining is to transform raw data into useful and interesting information [11][12].
This knowledge obtained by data mining techniques can further be analyzed for improving marketing strategy in business domain, enhancing student's learning process in e-learning domain, weather forecasting and discovering consumer patterns among others. One of the tasks of data mining is clustering which is widely performed in a variety of domain such as image processing, pattern recognition, and text mining among others. Clustering is an unsupervised form of data mining [2][3] with no data label unlike classification where we have a dataset along with the various class labels. An instance in the dataset could belong to a class depending upon the values of its features. Clustering is descriptive that means clusters are described by their characteristics. However, classification is predictive [8] which means the algorithm needs to find a class based on the different features of an object.
There are basically two types of clustering namely hard clustering and soft clustering respectively. The concept of hard clustering allows a data point to belong to just one cluster at any point of time i.e if an object falls in one cluster then it cannot lie in another cluster at the same time. It is also called binary clustering. On the other hand, soft clustering is more flexible by nature because it allows an object to belong to each cluster with a certain degree of membership [4]. The data points belonging to multiple clusters may be falling on the boundary or lying close to the center of one cluster or other.
Clustering algorithms are broadly divided into the following categories: Partition based, Hierarchical based, Density-based, Grid-based and Model-based [5]. These algorithms are discussed in [14] along with their applications in various domains. In [35] the authors reviewed the clustering algorithms and other important issues related to cluster analysis.
Furthermore, given a number of clustering algorithms, it becomes difficult to choose one for a particular problem. The decision regarding the suitability of a clustering algorithm in solving a given problem is paramount. To make this task easier we could compare algorithms with respect to suitable parameters and analyze their performance. For instance, if the efficiency of an algorithm is important for an application then the algorithms must be compared using "time complexity" parameter. Moreover, if scalability of an algorithm is critical then the size of the dataset could be considered as one of the parameters.
The rest of the paper is organized as follows: Section-II provides an overview of each clustering algorithm. Section-III describes data mining tool weka for performing comparative analysis. In section-IV, results of an experimental analysis are presented and discussed. Finally, the conclusion is discussed in Section-V.
-
II. Overview of Clustering Algorithms
Clustering algorithms are divided into two broad categories: Hierarchical and Partitioning methods [33]. A hierarchical clustering algorithm begins by initially selecting one object and successively merges the neighbor objects based on the minimum distance [6]. Different forms of this algorithm are BIRCH [27], CURE [28] and CHAMELEON [29] among others. In partition based algorithms all points are initially treated as one single cluster. The data points are grouped into different clusters based on some similarity. The similarity is usually defined by the application under consideration. For example, in a class of 100 students, we might want to make a cluster named "active" based on the marks obtained in various subjects and number of the assignment done by a learner. If a learner does not possess the above characteristics then he/she would be shifted to another cluster. All the data points within a cluster are highly similar and points belonging to different clusters are dissimilar. Some of the examples of the partitioning algorithms are k-means [32], k-modes [30] and k prototypes algorithm [31]. Among all the clustering algorithms, the k-means is the most popular clustering algorithm used in scientific and industrial applications [34]. We provide a brief overview of each algorithm below:
-
A. K-Means Algorithm
This is one of the widely used unsupervised clustering algorithms. K-means is used to divide a dataset into a disjoint group of points also termed as a cluster. Each cluster is represented by a data point which is also termed as the centroid of a cluster. The goal of the k-means algorithm is to group a dataset in such a way that each data point is closest to its centroid. However, in practice, the distance between data points in clustering does not characterize the spatial distances. Hence, the only feasible solution is to try all possible starting points. The coordinates of a centroid are calculated by making the average of each of the points of samples used in a cluster. One of the crucial factors in the process of clustering is assigning priorities to features representing data points in a dataset. The value of these features determines a feature vector. Although there are many distance metrics available such as Manhattan distance, city block, and cosine, among others, we used the Euclidean metric which is one of the widely used metrics for computing distance between two points.
K-means algorithm requires two inputs from a user such as the number of clusters to be generated and starting points. Once starting points are known then the distance from each data point to the starting points are computed using Euclidean distance metric. This is followed by placing each data point in the cluster nearest to its starting point (centroid). After all data points are placed to their clusters the new cluster centroid is computed. This process is repeated until there is no change in the value of centroid.
Some of the distinctive features of k-means are discussed in [9]. The k-means algorithm only supports the numeric attribute. However, several studies suggest overcoming this limitation. In one such work [10] the author presented a prototype of the algorithm which removes numeric data limitations while maintaining its efficiency. Parallel techniques fork-means were developed that can accelerate the growth of the algorithm [36]. Although the algorithm has been successfully used in a variety of domain and applications, it suffers from the limitation of finding the optimal number of cluster. There are several methods reported in the literature for finding optimal number of cluster namely ‘elbow’ and silhouette methods. However, this issue has also been addressed through an algorithm named ISODATA [37]. The main steps of k-means are briefly described below:
Algorithm
INPUT: K (where K is the required number of cluster)
OUTPUT: Set of K clusters.
Steps:
Input: S (instance set), K (number of cluster)
Output: clusters
-
(a) Initialize K cluster centers.
-
(b) While termination condition is not satisfied do
-
(c) Assign instances to the closest cluster center.
-
(d) Update cluster centers based on the assignment.
-
(e) End while
-
B. Expectation Maximization(EM)
Algorithms step1. Initialize: Seti = and choose an initial 91
-
(a) Expectation(E) :Compute
Q ( 9 , 9 1) = E 9 \\n p 9 (Z , X | X )]
= J ln( Z , X ) p ( Z | X ) dZ
-
( b ) Maximization ( M ) : Compute
9 i + 1 = arg max Q( 9 , 9 )
-
( c ) i ^ i + 1
The algorithm is based on clustering model which tries to fit data points to a scientific model. It aims to discover maximum likelihood estimates for model parameters with incomplete data[17][21]. The algorithm is also used in various motion estimation frameworks. The EM algorithm is an expansion of k-means algorithm which is iterative by nature.
-
C. Hierarchical Clustering(HC)
The main objective of HC is to build clusters of hierarchy. That means, data points are combined into clusters and these clusters are further combined into bigger clusters and so on which ultimately creates a hierarchy of clusters. One of the issues with this algorithm is its inability to adjust after merging or splitting the data points as neither undone of the previous operations is allowed nor swapping of data points in clusters. Hence, it becomes very important to take the right decision of merging or splitting as a wrong decision might lead to low quality of clusters. However, in order to improve the quality of clusters, the hierarchical method can be integrated with other methods. Several advances have been reported in the Hierarchical algorithm. HC is broadly categorized into two types [6]:
-
• Agglomerative Clustering
Hierarchical agglomerative clustering is one of the important and well established techniques in unsupervised machine learning. This is based on 'bottom-up approach'. Chameleon HC algorithm is based on the k-nearest neighbor graph in which an edge is removed when both vertices are not within the k closest point related to each other. Some of the widely used hierarchical clustering algorithms are CURE (clustering using representatives), BIRCH (Balanced iterative reducing and clustering using hierarchies), ROCK (robust clustering using links), Linkage algorithms, Bisecting k-means clustering algorithm among others.
Step 1.Begin:
-
a) Assign number of cluster=number of objects.
Step 2. Repeat:
When the number of cluster = 1 or specify by user
-
a) Find the minimum inters cluster distance.
-
b) Merge the minimum intercluster.
Step 3. End.
-
• Divisive Clustering(DC)
This approach is based on 'top-down approach' which means that this algorithm starts at the top with all data points in the single cluster. The cluster is split using a flat clustering algorithm. This process is applied recursively until each data point is in its own cluster. For a cluster with N objects, there is 24-1-1 possible two subset division which is very expensive in computation. The approach is conceptually more complex than ‘bottom-up approach’ and this is mainly due to the fact that we need another clustering algorithm as the subroutine for running DC algorithm. The efficiency of this algorithm shows up when we do not produce a complete hierarchy from the top through intermediate node to leaves. The algorithm is found to be linear in nature. The running time is directly proportional to the number of clusters and data points. Upon comparing DC and HC, it is discovered that HC algorithms are quadratic in terms of time complexity.
The basic principle of DC was first published as DIANA (Divisive analysis clustering) algorithm [7].
-
D. Make Density Based Clusterer
This algorithm forms the cluster of densely gathered objects separated by sparse regions [16]. One of the main advantages of this algorithm is that clusters of any shape and size can be created and noise can be detected easily. DBSCAN [22], OPTICS [23], DENCLUE [24] and DBCLASD [25] are some of the widely used density based clustering algorithms. As the size of dataset becomes larger the role of density based algorithm becomes more and more important. For example, id PDBSCAN is used for DBSCAN in a massive dataset using multiple computers through the network [26].
-
III. Weka (Waikato Environment for Knowledge Analysis)
Weka is a popular data mining tool developed by the University of Waikato in New Zealand. The tool has successfully been used in a wide variety of domain involving problems related to machine learning. It is also used for performing various tasks such as classification, regression, clustering, and association.
О Weka GUI Chooser
Program Visualization Tools Help
WEKA
The University of Waikato
Waikato Environment for Knowledge Analysis
Version 3.8.1
(c) 1999 - 2016
The University of Waikato
Hamilton, New Zealand
□
Applications
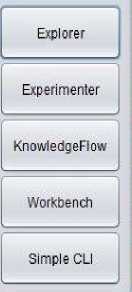
Fig.1. Weka Interface 3.8.1
It contains several modules for performing data preprocessing tasks such as cleaning, data integration, summarization, and data reduction among others. Weka can be called within java program as well. It is also used for developing new machine learning algorithms [18][19][20]. The main reason for choosing weka is due to its open-source nature, user-friendliness, and platform neutral among other advantages. Furthermore, building models, validating them, excellent visualization tools are features unique to weka. In addition, Weka also incorporates new algorithms as they appear in the research literature. In this paper, we use WEKA 3.8.1 version in order to apply clustering algorithms to different datasets.
-
IV. Experimental Results
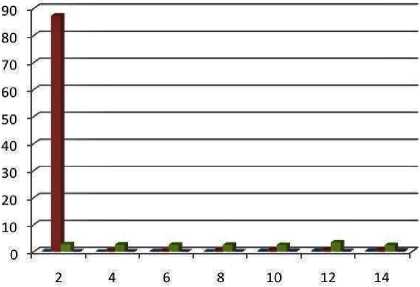
We consider four datasets for carrying out experimental analysis. The datasets with the number of attributes and number of instances are also shown in table.1. Firstly, we try to see the effect of changing the number of cluster on time taken to build a model by each algorithm. The chart in figure.1 shows that when the value of k is set to 2, the expectation maximization algorithm takes the maximum amount of time than other algorithms in order to build clustering model whereas k-means takes the least amount of time.
Table 1. Dataset with their attributes and instances
|
Dataset |
Number of attributes |
Number of instances |
|
Iris |
5 |
150 |
|
Glass |
10 |
214 |
|
Segment-test |
20 |
810 |
|
Vote |
17 |
435 |
The performance of density-based clustering algorithm' is next to k-means. The value of k is varied from k=2 to k=14 and subsequent observations show that the k-means algorithm performs better than other algorithms. Moreover, when the value of k is set to 2 the expectation maximization algorithm has taken significantly more time than the rest of the algorithms. Another interesting point to be noted is that when we increase the number of clusters the time taken by the expectation-maximization algorithm has gradually decreased.
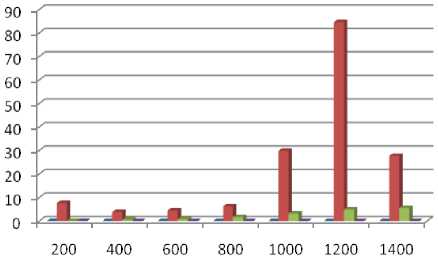
Moreover, the time taken by the hierarchical clustering algorithm did not vary much and remained almost constant. Overall one can say that the k-means algorithm outperformed other algorithms when the number of clusters is varied. We also compared the time complexity of the four algorithms by changing the size of the dataset. The chart in figure.2 graphically represent the results shown in table.3.
Table 2. Time taken by Algorithms when Number of Cluster Varied
|
K(number of cluster) |
K-Means |
Expectation Maximization |
Hierarchical Clustering |
Make Density Based Clustering |
|
2 |
0.1 |
87.23 |
2.69 |
0.02 |
|
4 |
0.01 |
0.41 |
2.55 |
0.023 |
|
6 |
0.1 |
0.34 |
2.52 |
0.02 |
|
8 |
0.03 |
0.52 |
2.47 |
0.02 |
|
10 |
0.2 |
0.63 |
2.45 |
0.2 |
|
12 |
0.3 |
0.72 |
3.39 |
0.1 |
|
14 |
0.3 |
0.7 |
2.45 |
0.3 |
■ К-Means
■ Expectation Maximization
■ Hierarchical Clusterer
■ Make density based clusterer
Fig.2. Time taken by Algorithms when Number of Cluster Varied
When the size of the dataset is set to 200, the k-means algorithm took least amount of time which can be seen in both in table.2 and figure.2. This is primarily due to the nice terminating behavior of the k-means algorithm. The likely cluster assignments are k^n. If in each step, we choose the better one, it will terminate after trying out all k^n. However, in reality, it terminates after few dozen steps. Furthermore, expectation maximization (EM) takes significantly more time as objects are assigned to all clusters with some degree of probability which does not guarantee for termination. Based on this one can say that the runtime of expectation maximization algorithm is infinite theoretically. The performance of density based algorithm comes next to the EM algorithm.
We also consider different dataset in order to see the performance of different algorithms. Table.4 shows that k-means outperforms among all the algorithms. Moreover, the algorithm takes significantly more time when it is applied to segment test dataset. We also take into consideration two other parameters namely normalized and un-normalized in order to see the performance of each algorithm.
Table 3. Time taken by algorithms when size of dataset changes
|
Dataset Size |
K-Means |
Expectation Maximization |
Hierarchical Clustering |
Make density based clustering |
|
200 |
0.05 |
7.67 |
0.06 |
0.06 |
|
400 |
0 |
3.88 |
0.58 |
0.02 |
|
600 |
0 |
4.53 |
0.83 |
0.03 |
|
800 |
0 |
6.24 |
1.66 |
0.02 |
|
1000 |
0.03 |
29.84 |
3.2 |
0.02 |
|
1200 |
0 |
84.56 |
4.92 |
0.01 |
|
1400 |
0.03 |
27.68 |
5.51 |
0.03 |
■ К-Means
■ Expectation Maximization
■ Hierarchical Clusterer
■ Make density based clusterer
Fig.3. Time taken by Algorithms when size of dataset varied
Table 4. Time taken by Algorithms using different datsets
|
Algorithms |
Data (Iris) |
Data (Glass) |
Data (Segment-test) |
Data (Vote) |
|
K-means |
.01 |
0 |
0.02 |
0.02 |
|
Expectation Maximization |
0.86 |
0.88 |
51.52 |
7.16 |
|
Hierarchical Clustering |
.06 |
0.13 |
2.52 |
1.94 |
|
Make density based clustering |
.02 |
0.02 |
0.03 |
0.03 |
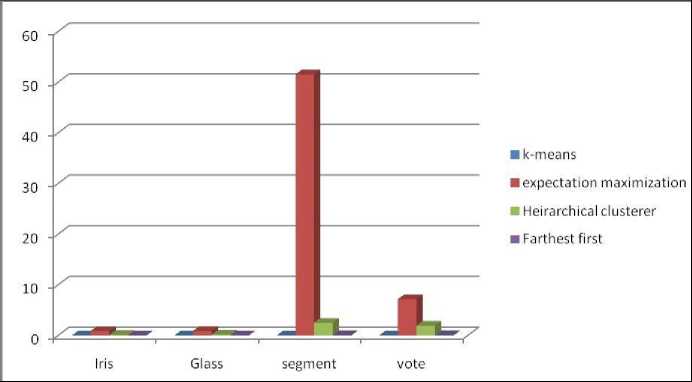
Fig.4. Time taken by algorithms using different datasets
Other parameters were also taken into account such as the number of iteration and time taken by each algorithm. Moreover, the number of clustered instances with their percentage is also shown in table.5. It is interesting to note that, while the value of parameter SSE is same for all the algorithms the k-means algorithm takes the least amount of time among all the algorithms.
Table 5. Time taken by Algorithms using unnomalized datsets
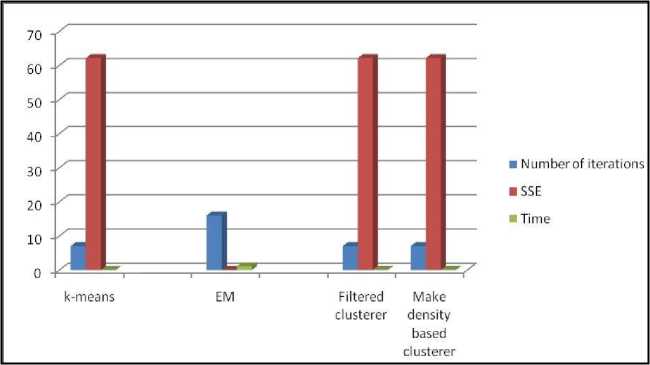
Fig.5. Time taken by Algorithms using unnomalized datsets
|
Algorithm |
Number of iterations |
SSE |
Time |
Clustered instances |
|
K-means |
7 |
62.14 |
0 |
100 ( 67%) 50 ( 33%) |
|
Expectation Maximization |
16 |
NA |
1.08 |
48 ( 32%) 50 ( 33%) 29 ( 19%) 23 ( 15%) |
|
Filtered Clustering |
7 |
62.14 |
0.05 |
100 ( 67%) 50 ( 33%) |
|
Make density Based Clustering |
7 |
62.14 |
0.05 |
100 ( 67%) 50 ( 33%) |
Table 6. Time taken by algorithms using Normalized Datasets
|
Algorithm |
Number of iterations |
SSE |
Time |
Clustered instances |
|
k-means |
7 |
62.14 |
0.06 |
100 ( 67%) 50 ( 33%) |
|
Expectation maximization |
16 |
NA |
0.92 |
48 ( 32%) 50 ( 33%) 29 ( 19%) 23 ( 15%) |
|
Filtered clustering |
7 |
62.14 |
0.05 |
100 ( 67%) 50 ( 33%) |
|
Make density based clustering |
7 |
62.14 |
0 |
100 ( 67%) 50 ( 33%) |
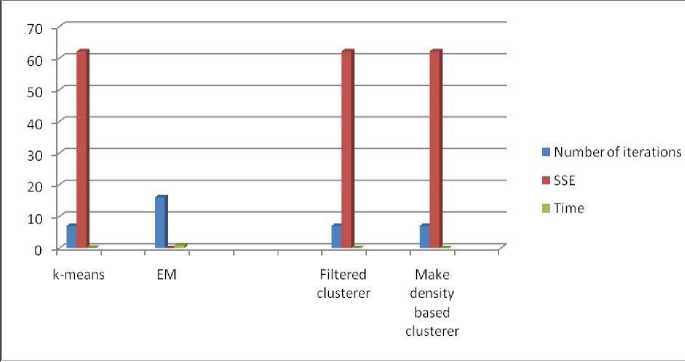
Fig.6. Time taken by algorithms using normalized datasets
The observations made from the above experiments are summarized below:
-
1. While the k-means algorithm performed well as compared to other algorithms when the initial value of k is 2, the expectation-maximization algorithm took significantly more time to build a model. Moreover, as the value of k gets increased the time taken by this algorithm reduces.
-
2. The change in the size of dataset does have a minor effect on the time taken by k-means algorithm. When the size of the dataset is increased from 200 to 400, the time taken by k-means is insignificant. On the other hand, with the increase in the size of the dataset, expectation maximization took the highest time.
-
3. When different datasets are considered, we found that k-means took the least amount of time to build a model. As expected, the expectationmaximization took the highest amount of time. When the expectation maximization algorithm is executed using segment test dataset the time taken is relatively higher.
-
4. The algorithms were also compared using normalized and un-normalized data. The need for normalization arises from the fact that the dataset considered are of varying scale. In order to bring them to a uniform scale, we used normalization. Moreover, the number of iterations and sum of squared error are same in both the cases, however, k-means algorithm took the lesser amount of time using normalized dataset.
-
V. Conclusion
We have performed a comparative experimental analysis to find the best algorithm with respect to various parameters. Analysis of the result shows that expectation maximization algorithm took significantly more time to build a model than other algorithms. However, it is the k-means algorithm which took the least amount of time with respect to all parameters. In this analysis of clustering algorithms, we have considered small dataset for experimentation, however, a large dataset with other clustering algorithms could also be considered in order to explore other aspects of the algorithms. Furthermore, we could also consider other parameters such as the use of different distance metric, and change the number of seed among others. The motivation to compare the four clustering algorithms with respect to various parameters is that, certain applications require a clustering algorithm to process the data faster in less amount of time. As we are living in the world of big data so the processing time taken by an algorithm to this data becomes critical. Hence, this comparison helps the developer to select an algorithm which takes less execution time. As we have observed that, expectation maximization takes the highest amount of time so it is suggested that, this algorithm should be avoided when execution time is the critical factor.
References Analyzing the performance of various clustering algorithms
- M.S.Chen,J.Han,P.S.Yu,“Data Mining:An Overview from a Database Perspective”, IEEE Transaction on Data and Knowledge Engineering,Vol.8,pp.866-888,1996.
- J.Han,J.Pei,M.Kamber,Data Mining: Concepts and Techniques, Morgan Kaufman Publisher,2006.
- G.Kesavraj,S.Sukumaran, “A study on classification techniques in data mining”, In 4th International Conference on Computing, Communications and Networking Technologies (ICCCNT),IEEE,pp.1- 7,2013.
- A.Gosain,S.Dahiya, “Performance Analysis of various fuzzy clustering algorithm: A Review, In Proceeding of 7th International conference on communication, computing and virtulization,Elsevier,2016.
- T.Sajana,S.Rani,K.V.Narayana, “A Survey on Clustering Techniques for Big Data Mining”, Indian Journal of Science and Technology,Vol.9,2016.
- L.Rokach, O.Maimon. (2005) Clustering Methods. In: O.Maimon, Rokach L. (eds) Data Mining and Knowledge Discovery Handbook Springer, Boston, MA.
- L.Kaufman, P.J.Rousseeuw, “Finding Groups in Data An Introduction to Cluster Analysis”, A Wiley-Science Publication John Wiley & Sons.(1990).
- M.P.Veyssieres,R.E.Plant,“Identificaton of vegitation state and transition domain in California’s hardwood rangeland, University of California”,1998.
- I.Dhillon,D.Modha, “Concepts decompostion for large sparse text data using cluster machine learning”, Vol.42,pp.143-175,2001.
- Z.Huang, “Extension to the k-means algorithm for clustering large datasets with categorical values, Data mining and knowledge Discovery,Vol.2,pp.283-304,1998.
- F.Usama,G.Piatetsky-Shapiro,P.Smyth, “The KDD Process for Extracting useful Knowledge from Volumes of Data”, Communicaton of the ACM, Vol.39, pp.27-34,1996.
- K.S.Osama,“Data Mining in Sports: A Research Overview, MIS Master Project,2006.
- U.Fayyad,G.Piatetsky-Shapiro,P.Smyth, From data mining to knowledge discovery in Databases, AI Magazine, Vol.17,1996.
- N.Mehta,S.Dang,“A Review of Clustering Techniques in various Applications for effective data mining, International Journal of Research in Engineering & Applied Science, Vol.1,2011.
- H.Edelstein, “Mining Data Warehouses, Information Week,pp.48- 51,1996.
- W.K.Loh, Y.H.Park, “A Survey on Density-Based Clustering Algorithms”. In:Y.S.Jeong., Y.H.Park, Hsu C.H.Hsu,J.Park (eds) Ubiquitous Information Technologies and Applications. Lecture Notes in Electrical Engineering, Springer,pp.775-780,2014.
- T.Schön,Machine Learning, Lecture.6 Expectation Maximization(EM) and clustering", Available at: http://www.contol.isy.liu.se/student/graduate/MachineLearning/Lecture/ Machine Learning/Lectures/le6.pdf.
- E. Frank, M. Hall, and I. Witten, “The weka workbench,” Online Appendix for “Data Mining: Practical Machine Learning Tools and Techniques”, 4th edn. Morgan Kaufman, Burlington, 2016.
- E.Frank, M.Hall, G. Holmes, R. Kirkby,B. Pfahringer,I.H. Witten and, L. Trigg, Weka in Data Mining and Knowledge Discovery,Springer(2005) 1305–1314.
- M.Hall, E.Frank,G.Holmes, B.Pfahringer, P.Reutemann, I.H.Witten, “The WEKA data mining software: an update, ACM SIGKDD Explor. Newsl.Vol.11pp.10-18,2009.
- S.Borman, “The expectation maximization algorithm: A short tutorial, Unpublished paper. Available:http://ftp.csd.uwo.ca/faculty/olga/course s/Fall2006/Papers/EM algorithm.pdf.
- A.Hinneburg,D.A.Keim, “An Efficient Approach to Clustering in Large Multimedia Databases with Noise”, In: Proc. Int'l Conf.on Knowledge Discovery and Data Mining (KDD).pp.58-65.1998.
- M.Ankerst, M.M.Breunig,H-P.Kriegel,J.Sander: OPTICS: Ordering Points To Identify the Clustering Structure. In: Proc. of Int'l Conf. on Management of Data, ACM SIGMOD,pp.49-60,1999.
- A.Hinneburg, H.-H.Gabriel:DENCLUE 2.0:Fast Clustering Based on Kernel Density Estimation. In: M.Berthold, J.Shawe-Taylor,N. Lavrač (eds.) IDA 2007.LNCS. Springer.4723,pp.70-80,2007.
- X.XU,M. ESTER, H.-P.KRIEGEL,J.SANDER, “A distribution-based clustering algorithm for mining in large spatial databases”, In Proceedings of the 14th ICDE,IEEE,pp.324-331,1998.
- X.Xu, J.Jäger, H.-P.Kriegel: “A Fast Parallel Clustering Algorithm for Large Spatial Databases", Data Mining and Knowledge Discovery (DMKD).Vol.3,pp.263-2990,1999.
- T.Zhang, R.Ramakrishnan, M.Linvy, “BIRCH: An efficient data clustering method for very large data sets”, Data Mining and Knowledge Discovery, Vol.1,pp.141-182,1997.
- S.Guha,R.Rastogi, K.Shim, “CURE: An efficient clustering algorithm for large data sets”, In Proceeding of ACM SIGMOD Conference,1998.
- G.Karypis, E.H.Han,V.Kumar, “CHAMELEON: A hierarchical clustering algorithm using dynamic modeling Computer”, IEEE Computer, Vol.32,pp.68-75,1999.
- Z.Huang, “Extensions to the k-Means Algorithm for Clustering Large Data Sets with Categorical Values”, Data Mining and Knowledge Discovery.pp.283-304,1998.
- A.Hinneburg, D.A.Keim, “A General Approach to Clustering in Large Databases with Noise”, Knowledge and Information Systems (KAIS), Vol.5,pp.387-415,2003.
- Y.M.Cheung, “K*-means:A new generalized k-means clustering algorithm”,Pattern Recognition Letters, Elsevier. Vol.24,pp.2883- 2893,2003.
- P.Berkhin, “Survey of Clustering Data Mining techniques”, Accrue Software, Inc, 2000.
- J.Hartigan,M.Wong, “Algorithm AS136:A k-means clustering algorithm”, Applied Statistics, Vol.28, pp-100-108,1979.
- A.K.Jain, M.N.Murty, P.J.Flynn, “Data clustering: A review”, ACM Comput. Surv.Vol.31,pp.264-323,1999.
- K.Stoffel,A.Belkoniene, “Parallel - means clustering for large data set”, In Proc. Euro Par'99 Parallel Processing, Springer, pp.1451-1454,1999.
- G.Ball,D.Hall, “A clustering technique for summarizing multivariate data”,Behaviour Science, Vol.12,pp.153-155,1967.
