ANN Approach for Classification of Different Origin Fabric Images

Author: Basavaraj S. Anami, Mahantesh C. Elemmi
Journal: International Journal of Image, Graphics and Signal Processing @ijigsp
Article in issue: 12 vol.11, 2019.
Free access
This paper focuses on classification of varieties of plants’, animals’ and minerals’ origin fabric materials from images. The morphological operations, namely, erosion and dilation are used. ANN classifier is used to predict the classification rates and the rates of 89%, 87% and 88% are obtained for plants’, animals’ and minerals’ origin fabric images respectively. The overall classification rate of 88% is obtained.
Morphology, Plant origin, Animal origin, Mineral origin, Feature extraction, ANN
Short address: https://sciup.org/15017056
IDR: 15017056 | DOI: 10.5815/ijigsp.2019.12.04
Text of the scientific article ANN Approach for Classification of Different Origin Fabric Images
Published Online December 2019 in MECS
Image processing is an interdisciplinary field used in the automatic extraction, analysis and understanding of useful information from images. It is used in different fields, namely, agriculture, industries, biological field, medical field and the like. The textile industry plays most important role to Indian economy through its export earnings. India is the world’s second largest producer of textiles in the world. The different forms of textiles are agro-textiles, geo-textiles, fabrics, medical-textiles etc. India has good resources of fibers, such as cotton, wool, polyester, silk, fur, jute, denim, etc. The different fabric materials have different textures, colors and morphological features.
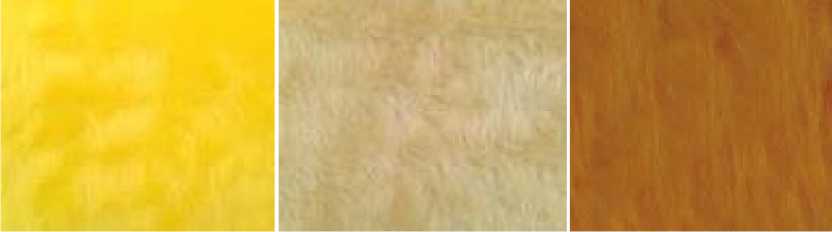
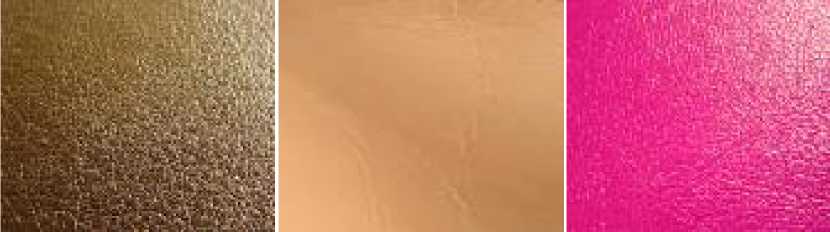
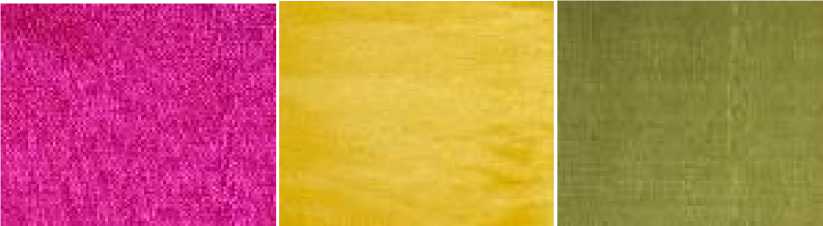
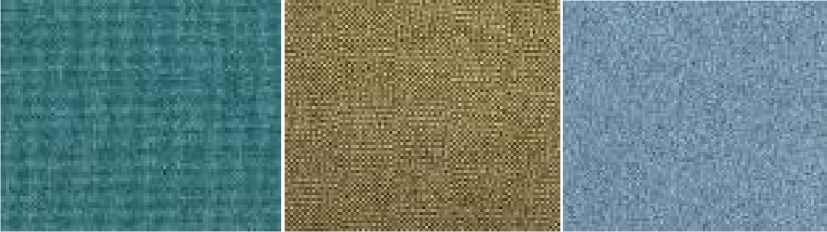
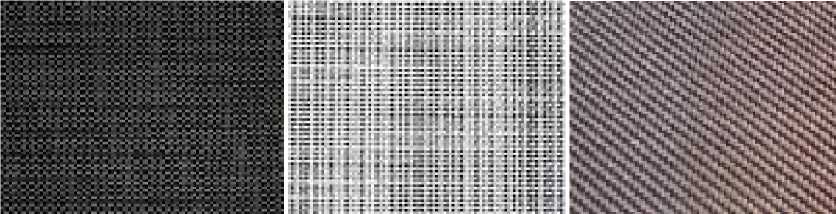
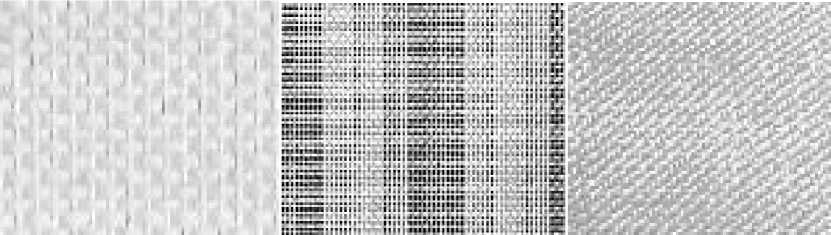
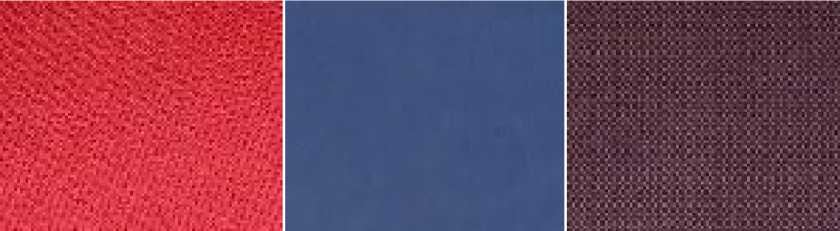
The fabric materials available at present are of different origins, such as plant, animal and mineral. Plant origin fabric has a natural dim color with coarser finish, wherein, the animal origin fabric is bright in color and has closed view. But, the mineral origin fabric material has finer finish and closed view. The mineral fabric images have refractive in nature and look brighter in color. Hence, the fabric images with different origins have their own unique visual features and the same are explored to classify them into their respective types and varieties.
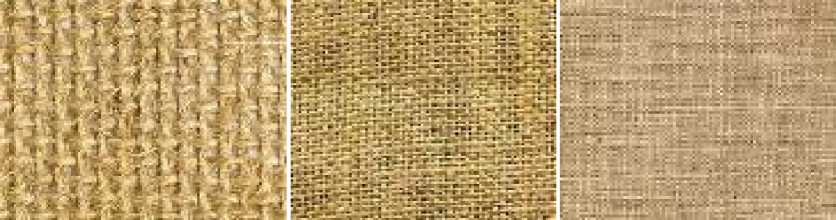
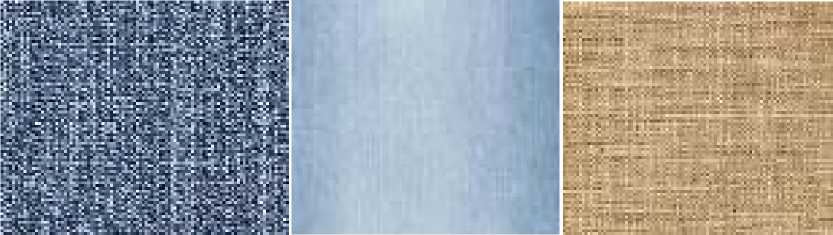
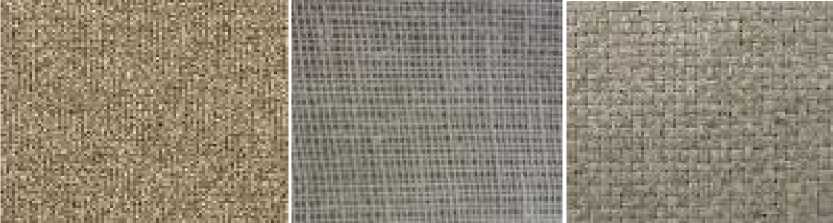
In the work carried out, four varieties each of plants’, animals’ and minerals’ origin fabric images are considered and sample images of varieties of different origin fabric are shown in Fig.1, Fig.2 and Fig.3 respectively.
(a)
(b)
(c)
(d)
Fig.1. Varieties of plants’ origin fabric (a) Cotton, (b) Denim (c) Jute and (d) Flax
(a)
(b)
(d)
Fig.2. Varieties of Animals’ origin fabric (a) Fur (b) Leather, (b) Silk and (c) Wool
(a)
(b)
(c)
(d)
Fig.3. Varieties of Minerals’ origin fabric (a) Fibre, (b) Glass, (c) Nylon and (d) Polyester.
The classification is carried out in two levels as shown Fig.4. In the first level, the fabric images are classified into three types, namely, plants’ origin, animals’ origin and minerals’ origin. In turn, the plants’ origin fabric images are classified into four varieties, namely, cotton, denim, jute and flax. Further, the animals’ origin fabric images are classified into four varieties as fur, leather, silk and wool. Finally, the minerals’ origin fabric images are categorized into four varieties as fibre, glass, nylon and polyester.
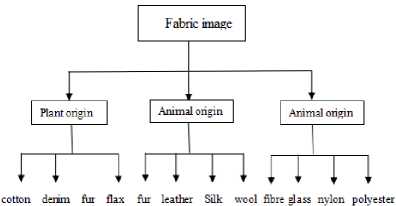
Fig.4. Varieties of different origin fabric images.
The remaining part of the paper is organized into FOUR sections. Section II contains the literature survey carried out related to the proposed work. Section III gives proposed methodology consisting of pre-processing, morphological feature extraction, feature selection using FFST and ANN classifier to classify the fabric images. Section IV presents the results and discussion. Section V contains the conclusion of the work carried out.
-
II. Literature Survey
To know state of the art in the textile industry, we have conducted a literature survey and following is the gist of papers cited.
Wang Xin et al. [1] have proposed a work on fabric identification using convolutional neural network, An image-based fabric retrieval technique is developed to help new fabrics to manage products. The network is trained with huge dataset containing different yarn-dyed fabric patterns. It is shown that, the performance is maintained well, when simpler deep architecture is used. But the same is found to decrease quickly, if the contents of fabric images are minimized.
Zhong Xiang et al. [2] have presented a paper on vision based portable yarn density measure method for single color woven fabric materials. The fabric images are collected manually using a smart-phone. A discrete Fourier transform is used to compute the density of the woven fabric. The results obtained, claim that the system is robust to meet the requirements in fabric industry.
Anamika Singh et al. [3] have proposed a method on face detection and eyes extraction using Sobel edge detection using different morphological operations. The methodology uses three phases, namely, pre-processing, face identification, and eyes extraction. The work carried out is found to give good classification rate.
Amelia Carolina Sparavigna [4] has presented a work on image segmentation applied to the analysis of fabric textures and quantification of differences. The use of image segmentation for the analysis of the textures in the fabrics is given. The main aim of this approach is to detect faults in the fabric images using image processing techniques.
Syed Mohammad et al. [5] have proposed a work on depth edge detection using image-based smoothing and morphological operations. The principle of median filtering that has a renowned feature is used for edge preserving characteristics. The results are compared with some existing methodologies and stated that, the proposed method gives better results. The work can contribute to promote many applications namely, object detection, object segmentation, etc.
Ying-Ying et al. [6] have proposed a new methodology that uses machine vision to measure the contaminants in raw cottons. The color images of cottons with contaminants are acquired and divided into three channel images. The Gamma adjustment function is adopted to correct non-uniform illumination for images. The experimental results have shown that, the measuring system can meet the requirement of the cotton's industry applications.
Zhang et al. [7] have presented a paper on review of fabric identification using image analysis technology. The methods used for the identification of woven fabrics are presented. It has the advantages of quick response, digital solution and accuracy, when compared with the manual method based on human eyes. A brief description of the background of weave pattern recognition and its development, based on an overview of many researches carried out before are given.
Mahmoud Abdel Aziz et al. [8] have presented a paper on fabric defect detection algorithm that uses morphological processing. An algorithm is proposed for fabric defect detection. The algorithm uses morphological operations and Discrete Cosine Transform(DCT) to detect fabric defects automatically. The algorithm gives good performance and has overcome drawbacks found in the existing algorithms.
From the literature survey, it is found that the work related to fabric texture analysis, fabric defect detection, and yarn hairiness determination of foreign fibers in fabric is carried out. The work on yarn density measurement, applications of image analysis techniques for textile identification and the like are also carried out. The texture features, morphological features, color and pixel intensities are used. In fabric materials, identifying fabric origin and variety of fabric is important for many applications. To mention few applications, identifying natural and man-made fabric, identifying fabric origin, quality of fabric, knowing the smoothness and coarseness, online purchase of fabric, cost estimation etc. Thus, the motivation for the work related to classification of different origin fabric images.
-
III. Proposed Methodology
The proposed methodology consists of four phases, namely, pre-processing, morphological feature extraction, morphological feature selection and classification as shown in Fig.5.
-
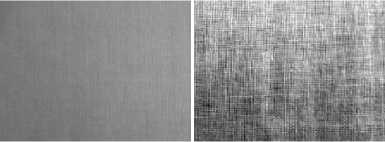
A. Pre-processing
The images are re-sized to 100 x 100 pixels from their original image size. Contrast stretching (CS) is performed to enhance the yarns visibility in the input image. The fabric images before and after contrast stretching are shown in Fig.6.
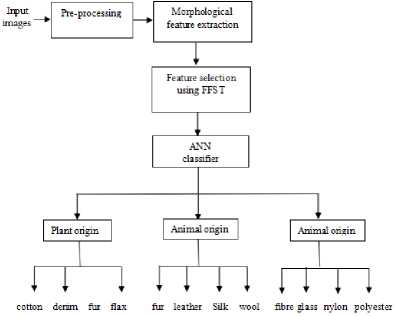
Fig.5. Different phases used in the proposed methodology.
Varieties of different origin fabric images are collected by visiting garment shops and textile industries. The images are captured using a digital camera having resolution of 32 Mega pixels under a constant natural light intensity of 1000 Lux. A constant distance of 0.5 meter is maintained during image capturing process. The number of fabric images used in the work is given in Table 1.
Table 1. Dataset of Plants’, Animals’ and Minerals’ origin fabric images
|
Fabric type |
Variety |
Count |
Total count |
|
Plants’ origin |
cotton |
400 |
1200 |
|
denim |
|||
|
Jute |
|||
|
flax |
|||
|
Animals’ origin |
fur |
400 |
|
|
leather |
|||
|
Silk |
|||
|
wool |
|||
|
Minerals’ origin |
fibre |
400 |
|
|
glass |
|||
|
nylon |
|||
|
polyester |
(a) (b)
Fig.6. Fabric images (a) before CS and (b) after CS.
The yarns in the fabric are found to be visible after contract stretching(CS) is performed. The morphological operations, namely, opening, closing, edge detection and the like are performed. The opening operation is found to give better feature values, when compared with the other morphological operations.
Opening
Opening is the erosion, followed by dilation operation. The erosion and dilation operations are represented using expressions (1) and (2) respectively.
A Q B ={ r | (r + b) e A V b e B } (1)
A Ф B ={ r | r = a + b V e A and b e B } (2)
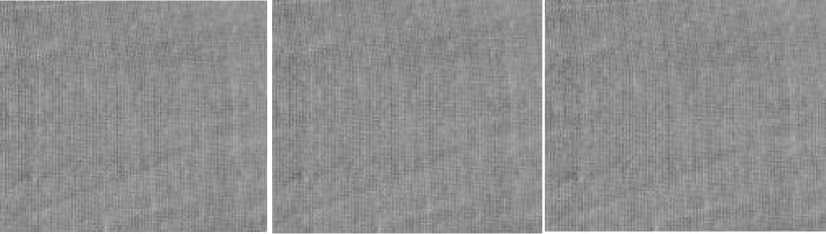
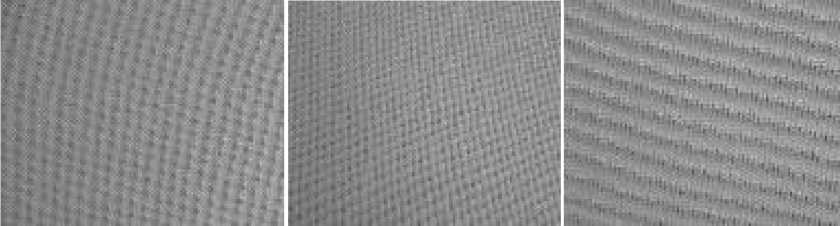
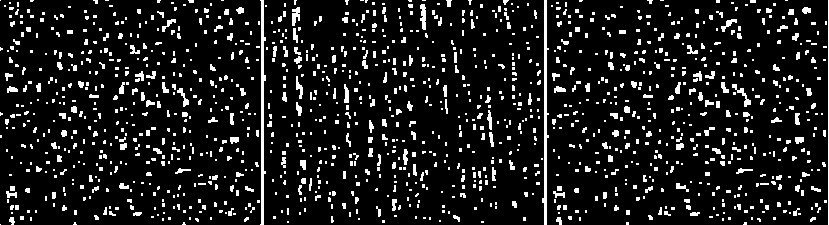
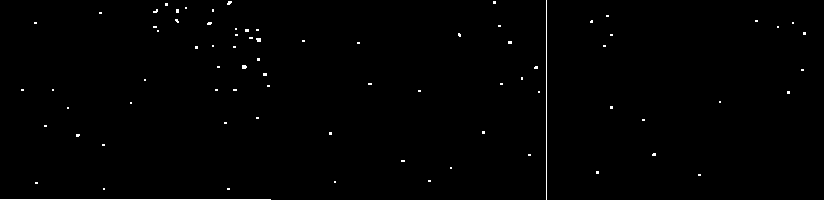
The varieties of different origin fabric images after applying opening operation are shown in Fig.7 (a), (b) and (c). From Fig.7 (a), (b) and (c), it is observed that most of the morphological features reveal inside yarn arrangement in fabric. Change in the fineness and coarseness characteristics of yarns leads to different morphological features such as, size, perimeter, circularity, shape, area and the like.
-
B. Morphological feature extraction
From Figure 7(a), (b) and (c), it is observed that, the shape, size, area and number of white spots are different in different origin fabric images. Plants’ origin fabric varieties have large sized non-circular spots in huge number, when compared with animals’ origin fabric varieties. Similarly, the shape, area and count of white spots in minerals’ origin fabric varieties are different, when compared with plants’ and animals’ origin. Hence, a total of eight morphological features, namely, avg_moments (F1), average_area (F2), max_area (F3), roundness (F4), average_perimeter (F5), average_eccentricity (F6), circularity (F7) and average_equivalent_diameter(F8) are extracted. The feature values of 10 sample images of different origin fabric images after feature selection process are given in Table 2, 3 and 4 respectively.
From Tables 2, 3 and 4, it is observed that, the feature values of different origin fabric images fall in different ranges. Most of the feature values of F1, F2, F3, F5, F6 and F8 are smaller in plants’ origin fabric images, when compared with animals’ origin fabric images. Also, it is observed that most of the feature values of all eight features are larger in animals’ origin fabric images, than minerals’ origin fabric images. Thus, the morphological features are used to classify the origin of fabric images and their variety.
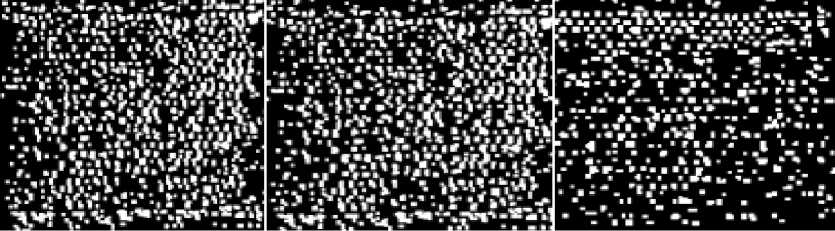
(a)
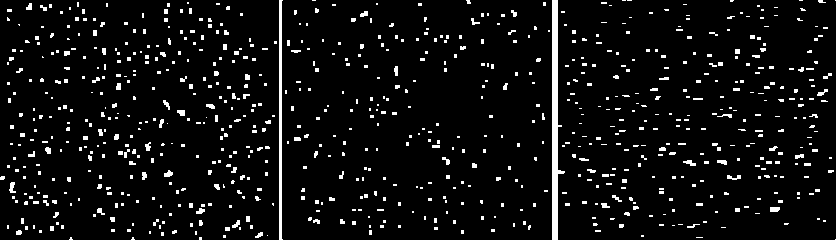
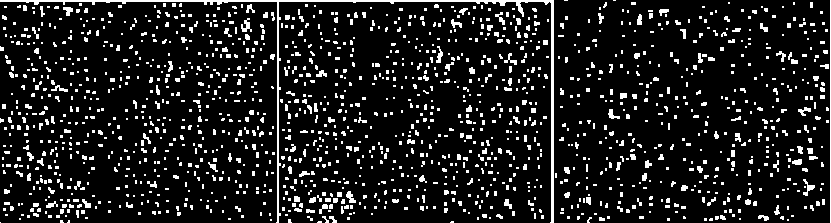
(b)
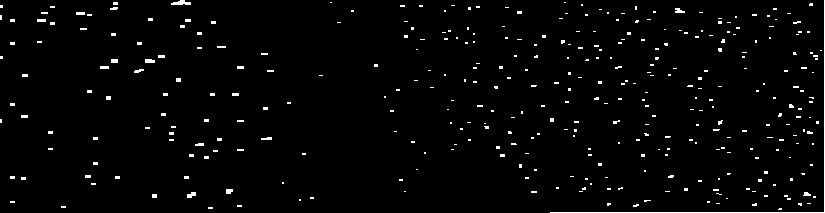
(c)
Fig.7. Sample images of different origin fabric images (a) Plants’ origin, (b) Animals’ origin and (c) Minerals’ origin.
Table 2. Feature values of Plants’ origin fabric images
|
Sample images |
avg_moments F 1 |
average_area F 2 |
max_area F 3 |
average_ perimeter F 5 |
average_ eccentricity F 6 |
average_ equivalent_diameter F 8 |
|
1 |
0.13127 |
0.58426 |
3.92738 |
33 |
4.69308 |
2.27517 |
|
2 |
0.12919 |
0.56561 |
3.83340 |
37 |
4.60437 |
2.25231 |
|
3 |
0.12995 |
0.58769 |
3.91488 |
27 |
4.66723 |
2.27192 |
|
4 |
0.08132 |
0.25011 |
0.84131 |
32 |
2.08886 |
1.46621 |
|
5 |
0.11935 |
0.56585 |
2.08932 |
47 |
3.07954 |
1.83036 |
|
6 |
0.17739 |
0.71935 |
6.29542 |
54 |
7.80921 |
2.87989 |
|
7 |
0.12410 |
0.40222 |
3.75052 |
103 |
6.42253 |
1.97717 |
|
8 |
0.12315 |
0.58021 |
2.09060 |
39 |
3.05630 |
1.82935 |
|
9 |
0.11923 |
0.39487 |
3.17721 |
520 |
5.58092 |
1.90456 |
|
10 |
0.11645 |
0.52663 |
2.07197 |
37 |
3.00780 |
1.81203 |
Table 3. Feature values of Animals’ origin fabric images
|
Sample images |
avg_moments F 1 |
average_area F 2 |
max_area F 3 |
average_ perimeter F 5 |
average_ eccentricity F 6 |
average_ equivalent_diameter F 8 |
|
1 |
0.19111 |
0.70312 |
10.52734 |
1299 |
18.30493 |
3.32699 |
|
2 |
0.19447 |
0.69384 |
10.47077 |
1243 |
18.07174 |
3.29341 |
|
3 |
0.20402 |
0.69669 |
6.13713 |
148 |
8.967455 |
2.67890 |
|
4 |
0.30636 |
0.85749 |
103.9826 |
15789 |
42.26376 |
17.7974 |
|
5 |
0.15492 |
0.51436 |
38.88845 |
11708 |
14.20732 |
7.44748 |
|
6 |
0.16025 |
0.64611 |
13.18816 |
1849 |
38.34939 |
3.52956 |
|
7 |
0.21149 |
0.70016 |
7.08827 |
152 |
10.41498 |
2.82500 |
|
8 |
0.17514 |
0.68335 |
13.05169 |
1833 |
37.77906 |
3.55039 |
|
9 |
0.16671 |
0.59383 |
5.83103 |
201 |
8.791780 |
2.52770 |
|
10 |
0.20238 |
0.67387 |
10.82534 |
861 |
21.06167 |
3.30782 |
Table 4. Feature values of Minerals’ origin fabric images
|
Sample images |
avg_moments F 1 |
average_area F 2 |
max_area F 3 |
average_ perimeter F 5 |
average_ eccentricity F 6 |
average_ equivalent_diameter F 8 |
|
1 |
0.14395 |
0.38057 |
62.17027 |
11571 |
2859.285 |
13.6294 |
|
2 |
0.15224 |
0.41847 |
34.79037 |
11247 |
943.195 |
6.38866 |
|
3 |
0.14395 |
0.38057 |
62.17023 |
11571 |
2859.285 |
0.14395 |
|
4 |
0.16369 |
0.46800 |
56.53482 |
11563 |
3000.025 |
0.16369 |
|
5 |
0.16369 |
0.46800 |
56.53482 |
11563 |
3000.025 |
0.16369 |
|
6 |
0.11672 |
0.43732 |
0.926328 |
3177 |
2103.251 |
1.54729 |
|
7 |
0.15252 |
0.46981 |
24.71819 |
5689 |
102.403 |
4.29887 |
|
8 |
0.13537 |
0.43705 |
14.44788 |
5930 |
1807.734 |
3.19866 |
|
9 |
0.14395 |
0.38057 |
62.17027 |
11571 |
2859.285 |
13.6294 |
|
10 |
0.13369 |
0.46800 |
56.53482 |
11563 |
3000.025 |
13.6890 |
C. Morphological Feature selection
The feature selection is carried out using Forward Feature Selection Technique (FFST). In this technique, a hill climbing approach is used.
Initially, the features are tested individually and the feature F2 that gives highest classification rate is selected. In turn, the feature F 2 is paired with the remaining features to select a feature pair that gives maximum classification rate. The feature pair {F 2 , F 5 } is found to give maximum accuracy. This process of computing classification rate is continued till the seven feature vector {F 2 , F 5 , F 1 , F 3 , F 8 , F 6 , F 4 } is combined with the last left-out feature (F 7 ). The classification rates obtained using single and combination of features are given in Table 5.
From Table 5, it is observed that, the combination of features F2, F5, F1, F3, F8 and F6 is found to give maximum accuracy, when compared with the other feature combinations. Hence, the feature set {F 2 , F 5 , F 1 , F 3 , F 8 , F 6 }is identified that gives highest classification rate.
Also, it is observed that, the addition of features F 4 and F 7 do not contribute to the improvement in the classification rate. Further, the classification rate remains same with the addition of a feature (F 4 ) and decreases after the addition of feature (F 7 ). Hence, the features F 4 and F7 are eliminated from the feature set.
Four parameters, namely, True Positive (TP), True Negative (TN), False Positive (FP) and False Negative (FN) are used to calculate metrics, namely, Precision ( Prec ), Recall ( Rc ), F 1 Score and Accuracy (Acc) using the expressions (4), (5), (6) and (7).
Pr ec = TP / (TP + FP)
Rc = TP / (TP + FN )
FScore = 2* ( Rc * Pr ec ) / ( Rc + Pr ec )
Acc = TP+TN/TP+FP+FN+TN
The metric values of different origin fabric images are computed and are given in Table 6.
Table 6. Metric values of different origin fabric images.
|
Fabric origin |
Precision |
Recall |
F 1 Score |
Accuracy |
|
Plant |
85 |
92 |
92 |
88 |
|
Animal |
88 |
80 |
90 |
92 |
|
Mineral |
85 |
90 |
90 |
88 |
Table 5. Classification rates with combination of features
|
Features |
Classification rates |
|
F 2 |
50.39 |
|
F 2 + F 5 |
62.23 |
|
F 2 + F 5 +F 1 |
76.35 |
|
F 2 + F 5 +F 1 +F 3 |
84.23 |
|
F 2 + F 5 +F 1 +F 3 +F 8 |
86.31 |
|
F 2 + F 5 +F 1 +F 3 +F 8 +F 6 |
88.00 |
|
F 2 + F 5 +F 1 +F 3 +F 8 +F 6 +F 4 |
88.00 |
|
F 2 +F 5 +F 1 +F 3 +F 8 +F 6 ++F 7 |
80.70 |
D. ANN Classifier
The ANN classifier with backpropagation algorithm is used to classify varieties of fabric images. Experiments are carried out using ANN classifier. Three hidden layers are used, containing ten nodes in each layer to predict three output targets. Feature vector X i has eight features, which is given as input to the classifier. It is applied in two levels. In the first level, ANN classifies fabric images into three types as plants’ origin, animals’ origin and minerals’ origin. In the second level, all the fabric types are classified into their respective varieties producing four outputs as shown in Fig.4. The output of a neuron z computed, is represented by the expression (3).
IV. Results and Discussion
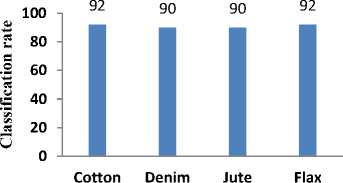
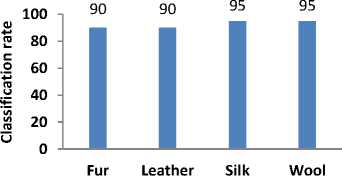
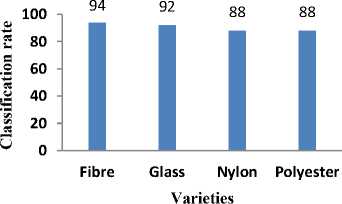
The classification rates of different origin fabric images are shown in Fig.8. The classification rates of 88%, 89% and 87% respectively, are obtained for plants’, animals’ and minerals’ origin fabric images. The overall classification rate of 88% is obtained. The classification rates for varieties of plants’, animals’ and minerals’ origin fabric images are shown in Fig.9 (a), (b) and (c). The classification rates of cotton and flax are found to be more in case of plants’ origin fabric images. In case of animals’ origin fabric images, the rates of silk and wool are more when compared with the other varieties. But, in minerals’ origin fabric images, fibre fabric variety gives the highest classification rate than other varieties.
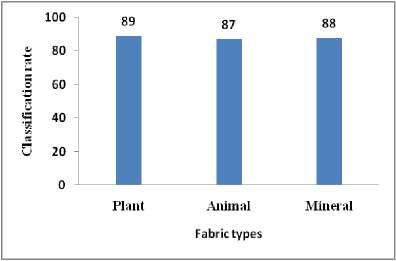
Fig.8. Classification rates of different origin fabric images.
d z = g(WTX - b) = gI £ W.X. - b I (3)
V i = 1 )
Varieties
(a)
Varieties
(b)
(c)
Fig.9. Classification rates of varieties of fabric images (a) Plants’ origin, (b) Animals’ origin and c) Minerals’ origin.
The classification rates of 91%, 92.5% and 90.5% respectively, are obtained for varieties of different origin fabric images. The overall classification rate is found to be satisfactory.
-
V. Conclusion
In the work carried out, the ANN classifier is found to give satisfactory results using morphological features. It is found that, the classification rates for different origin fabric images are almost equal. The classification of mineral based fabric images is marginally less because, the visual characteristics are not clear. The developed methodology finds many applications, namely, online purchase of fabric, cost estimation, temperature setting in automatic setting temperature in iron box, automatic setting of washing time etc.
References ANN Approach for Classification of Different Origin Fabric Images
- Wang, Xin, Ge Wu, and Yueqi Zhong. "Fabric Identification Using Convolutional Neural Network." In International Conference on Artificial Intelligence on Textile and Apparel, pp. 93-100. Springer, Cham, (2018).
- Xiang, Zhong, Jianfeng Zhang, and Xudong Hu. "Vision-based portable yarn density measure method and system for basic single color woven fabrics." The Journal of The Textile Institute, pp.1-11.(2018)
- Singh, Anamika, Manminder Singh, and Birmohan Singh. "Face detection and eyes extraction using sobel edge detection and morphological operations." In Advances in Signal Processing (CASP), Conference on, pp. 295-300. IEEE,( 2016).
- Sparavigna, Amelia Carolina. "Image Segmentation Applied to the Analysis of Fabric Textures." Philica (2016).
- Hasan, Syed Mohammad Abid, and Kwanghee Ko. "Depth edge detection by image-based smoothing and morphological operations." Journal of Computational Design and Engineering3, no. 3: pp. 191-197. (2016)
- Guo, Ying-Ying, Xin-Jie Wang, Yu-Sheng Zhai, Cai-Dong Wang, Liang-Wen Wang, Feng-Xiao Zhai, Kun Yan et al. "A novel method for identification of cotton contaminants based on machine vision." Optik-International Journal for Light and Electron Optics 125, no. 6 : pp. 1707-1710.(2014).
- Zhang, Jie, Binjie Xin, and Xiangji Wu. "A review of fabric identification based on image analysis technology." Textiles and Light Industrial Science and Technology (2013).
- Aziz, Mahmoud Abdel, Ali S. Haggag, and Mohammed S. Sayed. "Fabric defect detection algorithm using morphological processing and DCT." In Communications, Signal Processing, and their Applications (ICCSPA), 2013 1st International Conference on, pp. 1-4. IEEE, (2013).
