Anomaly Detection in Network Traffic Using Selected Methods of Time Series Analysis
Автор: Jarosław Bernacki, Grzegorz Kołaczek
Журнал: International Journal of Computer Network and Information Security(IJCNIS) @ijcnis
Статья в выпуске: 9 vol.7, 2015 года.
Бесплатный доступ
In this paper a few methods for anomaly detection in computer networks with the use of time series methods are proposed. The special interest was put on Brown's exponential smoothing, seasonal decomposition, naive forecasting and Exponential Moving Average method. The validation of the anomaly detection methods has been performed using experimental data sets and statistical analysis which has shown that proposed methods can efficiently detect unusual situations in network traffic. This means that time series methods can be successfully used to model and predict a traffic in computer networks as well as to detect some unusual or unrequired events in network traffic.
Anomaly detection, time series methods, network traffic, predicting, forecasting, statistical analysis
Короткий адрес: https://sciup.org/15011452
IDR: 15011452
Текст научной статьи Anomaly Detection in Network Traffic Using Selected Methods of Time Series Analysis
Published Online August 2015 in MECS DOI: 10.5815/ijcnis.2015.09.02
Anomaly is regarded as a deviation from the typical/expected behavior. Detecting anomalies is very important in order to provide stability and predictability in network traffic. Anomalies can be defined in various ways, for instance as improper work of devices or applications or as an attack, and so on. One of the way of detecting untypical situations, is forecasting.
The goal of this work is to present and evaluate selected methods which can be used to detect anomalous events in network traffic. One way to detect anomalies in networks is to forecast values describing network traffic with algorithms used in time series analysis and next to compare the results of prediction with the values measured in real network. To verify this hypothesis the following algorithms were implemented: Brown's exponential smoothing, seasonal decomposition, exponential moving average and naive forecasting. We created two time series: one with undisturbed typical network traffic data and the second containing disturbed data (network traffic with untypical, anomalous events). The data set with anomalous events were created by "overloading" the network. Specifically, in both time series the time between sent packets is analyzed - for this purpose we used a response time from server for each packet and computed the differences between adjacent packets. Response time from server has been derived from by a network sniffer Wireshark which can also simulate a computer network. Next, the future values of the time series are forecasted based on the data in the series without abnormal situations. Then, these data are compared with a time series containing untypical situations (anomalies). Comparison of series relies on checking whether real data (from the input time series with no-anomalies) is greater than data forecasted. The comparison of results is made with the use of statistical analysis. Above approach is tested in specially prepared test environment. The other method of anomaly detection investigated during the research is Exponential Moving Average (EMA). The proposed extension to EMA method generates opinions about security level using analysis of the observed network traffic. The opinions are formulated using subjective logic theory and they corresponds to the anomaly level of the monitored value describing network traffic [23].
The paper is organized as follows: Section 2 is an overview of methods for anomaly detection. Section 3 contains a short description of algorithms which are used in time series analysis. In section 4 a method based on moving average for anomaly detection is described and the results of experimental evaluation. Next section describes the approach to anomaly detection using prediction methods and presents results of experiments where proposed prediction method was used. Section 6 concludes this work.
-
II. Related Works
" Time series - a series of observations at various moments of time '' [6]. The time series analysis has two main goals: detecting the nature of the occurrence by the sequence of observation, and prediction the future values of the time series [12]. Time series methods are widely used for detecting various untypical situations, for instance modeling a network traffic and detecting anomalies.
In [18], various anomalies are detected within computer networks, with use of data from some network probes, such as ping or tracert. Aforementioned probing tools can deliver data, such as packet loss, number of collisions, delay in packet delivery, Time To Live, and so on. Anomaly detecting can be realized with use of methods, such as: fuzzy cognitive maps, statistical analysis, finite state machines or pattern matching. For example, pattern matching can be used in order to build traffic profile for a given network. Such profile can be modeled as a vector containing data, like packet loss, number of collisions, etc. These profiles can be categorized by e.g. time of day/week. When new data does not fit in given profile, an anomaly is stated.
In paper [11], methodology ARIMA was used in order to detect untypical situations in network traffic. Authors conducted experiments in which there were used two types of traffic: one with normal variations which can be described by some rules and are predictable, and second with untypical situations, where sudden and unpredictable changes can appear. Experiments showed that ARIMA is able to identify anomalies in network traffic successfully.
The paper [13] contains comprehensive overview of various techniques for anomaly detection. Considered are statistical methods, Bayesian networks, machine learning, Markov models, clustering algorithms like ExpectationMaximization , methods of computational intelligence (genetic algorithms, neural networks) and data mining techniques, such as: classification, association rules, etc.
Paper [5] presents the use of machine learning, Bayesian networks, clustering, neural networks, Markov models for intrusion detection.
An approach presented in work [22] uses the ARIMA/GARCH model in order to traffic modeling and prediction. A linear time series ARIMA was linked with non-linear GARCH model and compared with FARIMA model. Experiments showed that ARIMA/GARCH modeling is more efficient and has better prediction accuracy.
In [2] misuses in TCP/IP network were analyzed. Experiments showed that Multilayer perceptron architecture can successfully detect untypical situations in a network. A supervised learning technique known as back-propagation algorithm was used for training the artificial neural network.
In [14] a method for detecting outliers (anomalies) in wireless sensor networks is proposed. A K-nearest neighbor (KNN) algorithm is used in order to group similar anomalous groups of data (clusters). Authors conducted an experiment on data collected from the Great Duck Island Project [17]. Conducted research confirmed that proposed method works well.
In [ 16 ] statistical methods were used for detecting untypical situations in large networks. The Kalman filter was used to model the normal traffic. The anomalous data were obtained by adding (i.a.) Gaussian noise into input signal. There were used simple statistics methods, such as analysis of variance, and Receiver Operation Characteristic (ROC) curves, which assessed the performance of this method.
In [20], a payload-based anomaly detector called PAYL is presented. It uses unsupervised methods for modeling network traffic. A payload's standard deviation is computed during the training phase and then the Mahalanobis distance is computed to calculate the similarity between new data and pre-computed data. The comparison of data is based on a defined tolerance threshold. For experiments, there were used data from 1999 DARPA IDS dataset and a live dataset collected on Columbia CS department network. Experiments showed that accuracy of this method is very high.
Generally, ARIMA methodology is widely used for identification of various untypical situations. However, ARIMA is a complex technique that is not easy to use and imposes a number of requirements that must be fulfilled by an input time series. In our approach, we propose a method based on Exponential Moving Average and in the second part on Brown's exponential smoothing algorithm and seasonal decomposition. These methods are easier to be implemented in real world applications and do not require particular criteria for an input time series.
-
III. Methods for Network Traffic Level Prediction
-
A. Forecasting with the use of Brown exponential smoothing
The simplest version of Brown's method is usually used for a series with no trend and fluctuations are results of random factors. Each new smoothed value is calculated as a weighted average of the current observation and the previous smoothed observation.
A forecast is constructed in the following way:
-
У , = « X + (1 - a ) У t - 1 (1)
where:
Xt - denotes observed values of series, yt - smoothed values,
α - exponential smoothing parameter (smoothing factor) from the interval (0, 1].
Parameter α is set as follows:
-
• a ^ 1 - if a value is close to 1, the forecast includes the high degree ex-post errors of previous forecasts;
-
• a ^ 0 - the forecast includes the low degree ex-post errors of previous forecasts.
-
B. Forecasting with Seasonal decomposition
yt = TC t + S t + I t (2)
where:
yt - series,
T - trend,
C t - cyclical component,
St - season,
It - random error.
Most common trend , cyclical component or season can represent observations in daily/weekly cycles. The information about the trend or season can facilitate predicting some kind of behavior. For instance, if daily network analysis conducted in some period of time indicates that the most traffic is observed every evening, this could mean that efficient hardware resources are needed in order to handle requests.
-
C. Naive forecasting
Naive forecasting is a trivial method that relies on the fact that the value from the previous period ( t -1) is allocated to the period immediately preceding it as a forecast. This method assumes that a time series of length n values, consists of n periods where one period is a single value in a time series. The forecast is constructed as follows:
yt = У t-1 (3)
where:
yt - forecast set at time t, yt-1 - the actual value in the previous period t-1.
-
D. Moving average method
The method of moving average is a simple forecasting technique, generally used for time series without a tendency.
The moving average forecast is constructed as follows:
-
t - 1
-
y *=| £ y - (4)
-
k t = t - k
where:
yt* - forecast set at time t, yi - observed values of series k - smoothing constant determined by forecaster
Method of moving average characterize that calculated from a larger time series strongly smoothes series, but slower reacts to the changes in the forecasted variable. On the other hand, when a forecast is calculated from a smaller time series, it faster reflects changes in the time series, but random fluctuations will have a greater influence.
-
IV. Exponential Moving Average for Detecting Anomalies in Computer Network Traffic
As it was mentioned in the previous section, the proposed method for detection of security related problems in network traffic benefits from the time series analysis. The anomalous behavior of the systems is determined using the values for the behavioral attributes within a specific context. An observation might be an anomaly in a given context, but an identical data instance (in terms of behavioral attributes) could be considered normal in a different context. Contextual anomalies have been most commonly explored in time-series data [15][21]. One of the earliest works in time-series anomaly detection was proposed by Fox [3]. Some of the time series anomaly detection approaches uses basic regression based models [19]. Another variant is that detects anomalies in multivariate time-series data generated by an Autoregressive Moving Average [4]. Any observation is tested to be anomalous by comparing it with the covariance matrix of the autoregressive process. If the observation falls outside the modeled error for the process, it is declared to be an anomaly. An extension to this technique is made by using Support Vector Regression [10]. Another example of anomaly detection in time-series data has been proposed by Basu and Meckesheimer [1]. For a given instance in a timeseries the authors compare the observed value to the median of the neighborhood values.
The first proposed method of anomaly detection in time series can be applied to detect anomalies in various types of values measured during the network traffic measurement. The only requirement is that the values must constitute time series (e.g. the network nodes’ memory and CPU usage level, a number of incoming and outgoing bytes, etc.). The detected anomalies can be related to various types of attacks. For example, high level of CPU utilization level or remarkably greater volume of data received by a service usually can be observed during denial of service (DoS) attacks [24]. Other more specific types of attacks e.g. traffic injection attack also can be detected by time series anomaly detection methods. As this type of attack imposes extra processing effort of a service, it should be noticed during CPU utilization level analysis [25]. Another example of an attack, a ruffling attack disrupts user requests spacing and creates traffic bursts or abnormal interarrival times, what can be noticed at time series describing incoming or outgoing traffic and number of user requests.
The proposed analysis of time series performed to detect anomalous state of communication between interacting services is done in four steps. The first one is a feature selection. A selection algorithm chooses among a set of candidate feature functions. A feature function applied at this stage of the project development is the function computing average number of bytes sent/received by the service during the fixed time window. The second step is a parameter estimation. In general approach a new feature function is added to a model and the weights of all feature functions are updated. Collected historical data about service behavior (features values) are compared with the current feature value. After this step the model of service behavior is constructed. This model is built by iterating steps 1 and 2 until a predefined stopping criterion is met. The demonstrated in this section functionality of time series anomaly detection assumes the existence of one preselected feature function (as described above), so the model of the network traffic is fixed. Finally, the last step is anomaly detection. A large difference between the distribution of the selected feature value and a baseline distribution derived from training data indicates an anomaly. The formal criterion for anomaly detection and implementation of these four steps performed by anomaly detection module is presented below.
A. Anomaly detection and security level evaluation
The proposed solution assumes that a typical behavior of the most computer systems shows some periodicity, e.g. number of processes executed during the day time or data transferred. The length of the characteristic period varies from system to system but typically the most significant correlations in system parameters values can be noticed in a day and a week long periods.
The general idea of one of the implemented detection algorithms is as follows. First, time series is created (from the starting point of measurement x1 the current i -th element):
Xj.i={xi, X2, X3,..., Xj, Xj+1,_, Xi} where elements of XT,i are values of measured data volume transferred in the system monitored. Apart from XT,i time series two other families of sub-time series are analyzed by anomaly detection algorithm. The first one:
XS,i={xi, Xi+P, Xi+2P,^, Xi+kP} where elements of XS,i are values taken from XT,i and where each two subsequent elements are in a distance of P. P is a value describing period length, in our case it equals to 24 hours (1 working day).
The second family of sub-time series:
XL,i={ xi, xi+1, Xi+2, — , Xi+P-1} where elements of XL,i are all subsequent values taken from time series XT,i from a particular i-th period of observation (Fig.1).
For each one of the above described families of time series are evaluated the exponentially weighted moving average values using standard Exponential Moving Average (EMA) formula:
Xt , = Xt , i-i + w *( xf — Xt ,i-i) (5)
evaluated in the following way:
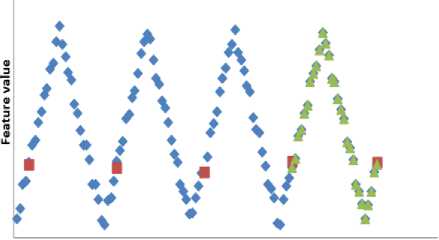
0 20 40 60 Time ® 100 120 14C
♦ Time series Xt ■ Subsequence Xs ▲ Subsequence XI
Fig.1. Time Series Analysis for Anomaly Detection
5T>,= Xt, — X,
and
^ T,
1 < ______
= i 7^(xj— Xt,‘)2
j = i
The a T ,i estimates the measure of variability of XT ,i in time series values and 5 T ,i evaluates how much the current observation differs from the average at the current time point i . The values a S ,i , a L ,i and 5 S ,i , 3 L ,i for two remaining time series are calculated in the correspondent way.
Using defined over here estimates of standard deviation we define the opinion m = ( b, d, u ) about security level of a network traffic observed.
The formal definition of disbelieve value in time series analysis during security level evaluation process is given by the following formula [1][7][8][9]:
d = min
5 S,
+
5 l,
ст, V s • i J
V ° Ui J
д^
where X T , i is exponential moving average calculated for X time series at i -th point and w is a coefficient with empirically assigned value. In the corresponding way the values of exponential moving average of X L , i and X S , i are calculated. The observed values characterizing behavior of network are analyzed in three dimensional space (time series X T,i , X L,I , X S,i ). This multidimensional analysis improves the precision of anomaly detection [9]. Especially, taking three dimensions together allows for better understanding the seasonal and trends changes appearing in the time series.
For each time series the estimates of appropriate standard deviation ( a T,i) and local difference ( 5 T ,i ) are
The disbelieve value d ranges from 0 to 1. When detected anomaly is relatively small (near the average values) the d value will be near 0. While we observe the high deviation from the earlier observed values (three times greater than standard deviation) the disbelieve value d equals to 1.
The uncertainty value u in opinion m = ( b, d, u ) about security level of the monitored communication link is evaluated using the following formula:
0 if d = 1
u = <
CT, min^(1 — d), -Sil CTL,i
if d Ф1
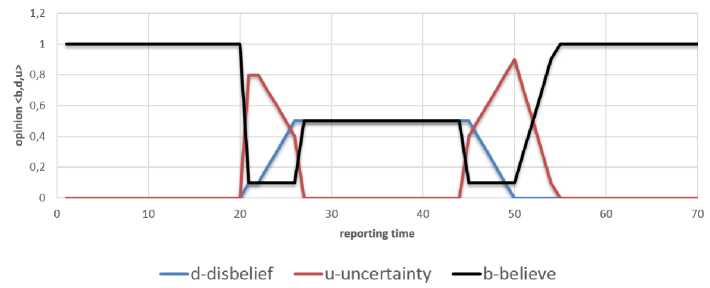
Fig.2. Traffic Injection Attack
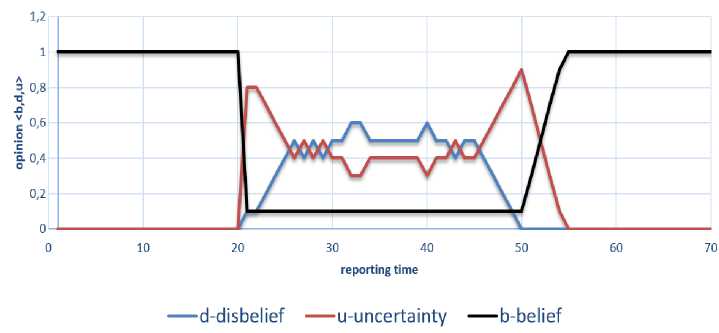
Fig.3. Traffic Ruffling Attack
where σS,i denotes the proportion between estimates of σL,i variance calculated for the last period of observation and the variance calculated for all observations from XS,i subtime series.
-
B. Evaluation of anomaly detection using Exponential Moving Average
The test scenario investigates the feasibility to detect anomalies related to some specific security threats as traffic injection and traffic ruffling. In the first example of this scenario attacks have been simulated by disturbing the data volume transmitted by a service by injecting some malicious traffic. At the beginning, the typical traffic generated by standard network services has been captured during test phase. Next, the captured traffic has been reengineered to simulate traffic injection and ruffling attacks. Using tcpreplay tool the previously captured traffic has been resend 7 times (tcpreplay --loop=7 --intf1=eth0 u1_u2.pcap). Simultaneously, using algorithm described earlier in previous section and data stream provided by standard network services time series characterizing typical traffic volume of network was created. The anomaly detection algorithm recognizes the traffic characteristic as typical behavior and reports it as an event without risk opinion ω = 〈b=1, d=0, u=0〉. After some 2 intervals the malicious traffic has been injected. The additional packets have been generated by tcreplay tool (tcpreplay --loop=30 --intf1=eth1 u1_u2. pcap) and new values of time series describing traffic volume related to selected network services have been analyzed by detection algorithm. The algorithm detects that traffic volume has been changed and generates reports with corresponding value of opinion about network security level ω = 〈b<1, d>0, u>0〉. The plot of the changes in opinion values for each of the measurement intervals illustrates Figure 2. As the injected traffic infers more time series elements the disbelief increases. After some time the additional packets, as they are generated with the constant distribution of packets’ inter-departure time value, do not more increases disbelief values. The uncertainty value u grows (and decreases) in the corresponding way to the changes introduced by the additional traffic volume.
The next traffic related attack scenario shows the simulated traffic ruffling. The typical traffic generated by network services has been simulated in the analogous way as in previous example. After some 2 intervals the attack starts and in a consequence the traffic has been disrupted. The ruffling attack has been simulated by modification of the packets generator parameters values to tcpreplay --multiplier=5.2 --intf1=eth0 u1_u2.pcap which means that the captured traffic has been replied 5.2 times faster than it was captured. The plot of the changes in severity and intensity values illustrates Figure 3. This experiment shows that this type of attack generates more fluctuations in disbelief value than the traffic injection attack. It is the effect of the overlapping different periods of the typical and malicious traffic. This type of attack at communication links infers the time series in more complicated way what can be seen in Figure 3.
This difference can also be used to distinguish different type of attacks against networks. The attack type recognition using collected from security evaluation module values of disbelief is the interesting aim for the further research.
-
V. Evaluation of Anomaly Detection using Prediction Methods
The goal of the second experiment is to verify the possibility of anomaly detection with the application of forecasting methods. We forecast traffic network with use of time series methods (described in Section III) and compare forecasted values with the real traffic. During this experiment the time between sent packets is analyzed - for this purpose we used a response time from server for each packet and computed the differences between values related to adjacent packets. Response time from server has been derived from a network sniffer Wireshark . This software is also able to simulate a computer network. We used this program to generate two time series - this procedure is described in the next part of the paper.
-
A. Preparation of an experiment
The first stage of the experiment is preparation of two time series - data sets which will be used to analyze the efficiency of used methodology. For this purpose, a network sniffer called Wireshark was used as a test environment for simulating a computer network traffic. Wireshark can allow capturing network packages and the data describing these packages (inter alia packet transmission time, response time from server, type of protocol, and so on) can be exported into a XML file. We used an information about response time from server and created two time series:
-
1. A time series with undisturbed (non-anomaly) data; this time series contains times of responses from server during the normal traffic. These data were captured, when there were no untypical situations, like a network load.
-
2. A time series containing unusual situations; in order to generate the second time series with unusual situations, a normal network load was disrupted by running several websites offering online movie watching, web games and also used "bots'' whose aim is to open graphically demanding website. It resulted in increased the network server response time.
The following assumptions have been made:
-
1. A model - time series of forecasts generated by algorithms (described in section III);
-
2. A normal state - the value of the network state (response time) which does not exceed the
-
3. Anomaly - the value of the network state which exceeds the assumed threshold value of the relevant state value obtained from the model;
-
4. The level of threshold value (tolerance) was assumed at 0.2 second as the maximum value in the input dataset. We assumed that exceeding this value (both positive or negative) is found as an anomaly.
assumed threshold value of the relevant state value obtained from the model;
-
B. Method for anomaly detection in time series
The described in section III algorithms were implemented to predict future values of the time series. The prediction is done with data sets without abnormal situations. Then, predicted values are compared with a time series containing untypical situations (anomalies). Comparison of series is performed by calculating the distance between predicted value and the currently observed value.
-
C. Experimental results
An experiment was conducted as follows:
-
• On the basis of time series with undisturbed data there were generated with different models (which are time series with forecasts generated by used algorithms);
-
• Model results were compared with time series containing untypical situations (obtained in a way described in Section III);
-
• Generate a graph showing the size of differences provided by the model in relation to the values within time series with anomalies.
All of described algorithms were implemented in MATLAB. In the X -axis there is time (in seconds) of packets transmission, Y -axis contains the response time from the server.
The graphs above show the time difference between forecasts of the model and input time series containing anomalies. Bolded fragments on the graph denote values that do not fit in the assumed tolerance.
We additionally assumed that an anomaly is when real value is greater than value forecasted (considering the level of 0.2 second).
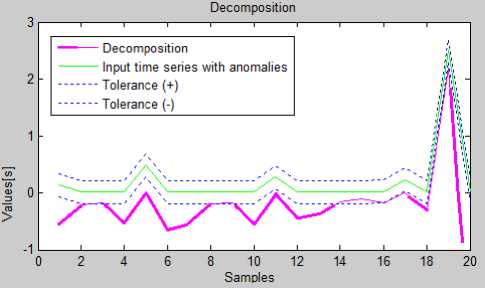
Fig.4. The Comparison of Input Time Series (With Tolerances) With Forecasts Generated By Seasonal Decomposition
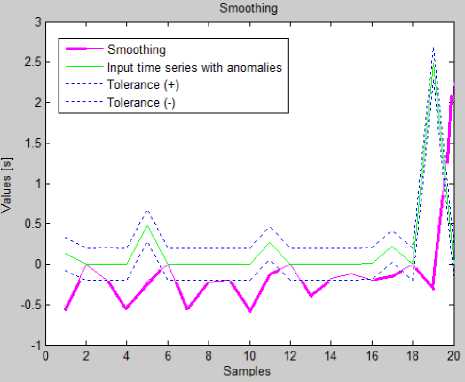
Fig.5. The Comparison of Input Time Series (With Tolerances) With Forecasts Generated By Brown's Exponential Smoothing
The statistical analysis used the following data (samples):
-
(1) A time series with undisturbed (non anomalous) data;
-
(2) A series of forecasts generated by seasonal decomposition;
-
(3) A series of forecasts generated by naive method;
-
(4) A series of forecasts generated by Brown's exponential smoothing;
-
(5) A series of forecasts generated by moving average method.
All statistical tests were made at significance level α = 0.05. Before selecting a proper test, each of aforementioned series was analyzed by Lilliefors test in order to check its distribution. The results of a Lilliefors test are presented in Table 1.
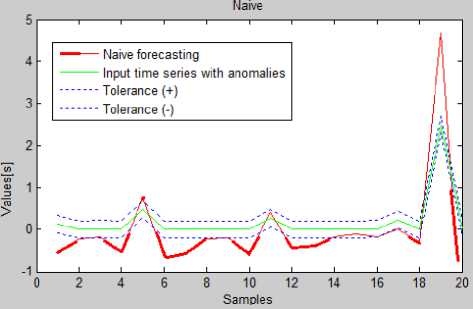
Fig.6. The Comparison of Input Time Series (With Tolerances) With Forecasts Generated By Naive Method
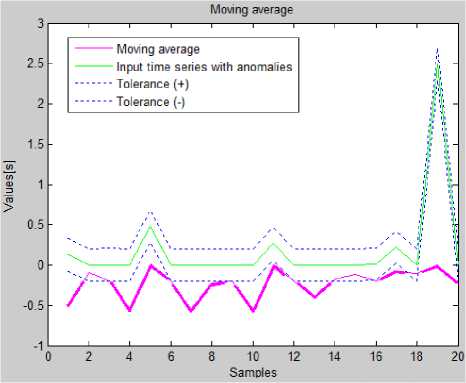
Fig.7. The Comparison of Input Time Series (With Tolerances) With Forecasts Generated By Moving Average Method
-
D. Statistical analysis
The verification of the efficiency of used algorithms was based on statistical comparison that the time series containing anomalies do not differ significantly from the forecasts generated by forecast algorithms.
Table 1. Results of Lilliefors test
|
Sample |
Statistical test value |
p -value |
|
(1) |
0.140238 |
0.000049 |
|
(2) |
0.247245 |
<0.000001 |
|
(3) |
0.248172 |
<0.000001 |
|
(4) |
0.233225 |
<0.000001 |
|
(5) |
0.33142 |
<0.000001 |
None of analyzed samples come from a normal distribution. Therefore, for further analysis an ANOVA Kruskal-Wallis test (non-parametric) was used. The statistical test value was equal 160.365856 and the p -value was < 0.00001. It means that medians of considered samples differ significantly.
The visualization of ANOVA Kruskal-Wallis test can be seen in boxplots presented in Figures 8 and 9.
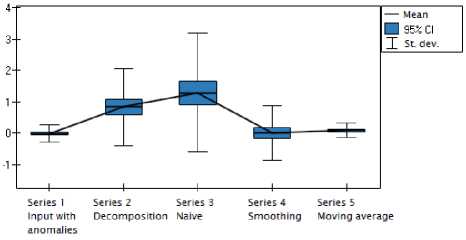
Fig.8. Boxplot of Average Values
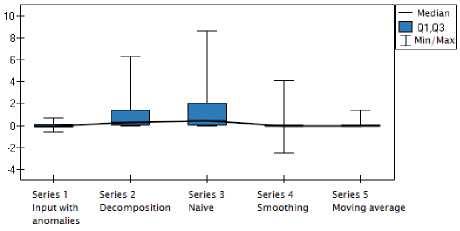
Fig.9. Boxplot of Medians
Next, a POST-HOC analysis (based on U Mann-Whitney test ) was made in order to determine which series differ significantly. Results of U Mann-Whitney test are presented in a Table 2.
Table 2. Results of U Mann-Whitney test
|
Sample |
Statistical test value |
p -value |
|
(1) and (2) |
2023.5 |
0.0001 |
|
(1) and (3) |
1745 |
0.0001 |
|
(1) and (4) |
4955.5 |
0.914781 |
|
(1) and (5) |
4048 |
0.019799 |
Above analysis showed that series 1 and 4 (forecasts generated by Brown's exponential smoothing) do not differ significantly. This means that forecasts generated by this algorithm is close to values in time series with anomalies. Naive method of forecasting, seasonal decomposition and moving average method detected statistically less anomalies.
-
VI. Conclusions
In this paper methods for detecting untypical situations in a network traffic were proposed and evaluated. The proposed method of security level evaluation using modified Exponential Moving Average with subjective logic opinions shows how the anomaly detection and time series analysis can be used to detect and to classify security related problems in computer networks. Also presented results of experiments and their statistical analysis showed that forecasting Brown's exponential smoothing is efficient and can be used for detecting abnormal situations in, for example computer networks. Brown’s forecasting method can be very useful in real world networks as it is a light-weight method of data analysis.
In future work it is planned to work out a method for selecting the optimal "time window" for modeling a network traffic. The importance of this problem depends on the variety of traffic flow. At different times of day the traffic is different - for instance in "rush hours" it is expected that the traffic will be increased, and during the night hours - the traffic is supposed to be smaller.
It could be considered, how to define anomalies -whether it is the increase of traffic or its reduction, resulting for instance from a hardware failure.
Список литературы Anomaly Detection in Network Traffic Using Selected Methods of Time Series Analysis
- S. Basu, M. Bilenko., and R.J. Mooney, "A probabilistic framework for semi-supervised clustering". In Proceedings of the 10th ACM SIGKDD International Conference on Knowledge Discovery and Data Mining. ACM Press, 2007, pp. 59–68.
- J. Cannady, "Artificial Neural Networks for Misuse Detection", In: National Information Systems Security Conference, School of Computer and Information Sciences, Nova Southeastern University, Fort Lauderdale, 1998, pp.443-456.
- A.J. Fox,. "Outliers in time series". J. Royal Statis. Soc. Series B 34(3), 1972, pp.350–363.
- P. Galeano, D. Pea, and R.S. Tsay,"Outlier detection in multivariate time series via projection pursuit. Statistics and econometrics working articles" Departamento de Estadistica y Econometrica, Universidad Carlos III, 2004.
- P. Garcia-Teodoro, J. Diaz-Verdejo, G. Macia-Fernandez, E. Vazquez, "Anomaly-based network intrusion detection: Techniques, systems and challenges", Computers & Security 28(2009), Elsevier, 2009, pp.18-28.
- I.A. Ibragimov, "Time series, Encyclopedia of Mathematics" http://www.encyclopediaofmath.org/index.php?title=Time_series&oldid=16499 (last access: February 12, 2015).
- A. Jøsang, "A Metric for Trusted Systems". In: Proceedings of the 21st National Security Conference, NSA, 1998, pp.68-77.
- A. Jøsang, "Conditional Inference in Subjective Logic", In the proceedings of the 6th International Conference on Information Fusion, Cairns, 2003, pp.279-311.
- G. Kolaczek, K. Juszczyszyn, "Smart Security Assessment of Composed Web Services". Cybernetics and Systems 41(1), 2010, pp.46-61.
- J. Ma and S. Perkins, "Online novelty detection on temporal sequences" In Proceedings of the 9th ACM SIGKDD International Conference on Knowledge Discovery and Data Mining. ACM Press, 2003, pp.613–618.
- H.Z. Moayedi, M.A. Masnadi-Shirazi, "Arima Model for Network Traffic Prediction and Anomaly Detection", Information Technology, ITSim 2008. International Symposium on (Vol:4), Kuala Lumpur, Malaysia, 2008.
- Online manual on statistics, Time series analysis http://www.statsoft.pl/textbook/stathome_stat.html. (last access: February 12, 2015)(in Polish).
- A. Patcha, J.-M. Park, "An overview of anomaly detection techniques: Existing solutions and latest technological trends", Computer Networks 51, Elsevier, 2007, pp.3448–3470.
- S. Rajasegarar, C. Leckie, M. Palaniswami, J. Bezdek, "Distributed anomaly detection in wireless sensor networks", ARC Special Research Center for Ultra-Broadband Information Networks.
- S. Salvador and P. Chan, "Learning states and rules for time-series anomaly detection", Tech. rep. 2003 CS–2003–05, Department of Computer Science, Florida Institute of Technology Melbourne.
- A. Soule, K. Salamatioan, N. Taft, "Combining Filtering and Statistical Methods for Anomaly Detection", IMC '05 Proceedings of the 5th ACM SIGCOMM conference on Internet, USENIX Association Berkeley, CA, USA ©2005, pp.31-31.
- R. Szewczyk, A. Mainwaring, J. Polastre, J. Anderson, D. Culler, "An analysis of a large scale habitat monitoring application" in International conference on Embedded networked sensor systems, ACM Press, 2004, pp. 214–226.
- M. Thottan, C. Ji, "Anomaly Detection in IP Networks", IEEE transactions on signal processing, Vol. 51, No. 8, 2003, pp.2191-2204.
- R.S. Tsay, D. Pea, and A. E. Pankratz, "Outliers in multi-variate time series". Biometrika 87(4), 2000, pp.789–804.
- K. Wang, S. Stolfo, "Anomalous Payload-Based Network Intrusion Detection", Computer Science Department, Columbia University, Lecture Notes in Computer Science 3224, 2004, pp.203-222.
- A.S. Weigend, M. Mangeas, and A.N. Srivastava, "Nonlinear gated experts for time-series: Discovering regimes and avoiding overfitting." Int. J. Neural Syst. 6, 4, 1995, pp. 373–399.
- B. Zhou, D. He, Z. Sun, "Traffic Modeling and Prediction using ARIMA/GARCH model", Nejat Ince, A., Topuz, E. (Eds.), Springer, 2006, pp.101-121.
- V. Barot, S. S. Chauhan, B. Patel, "Feature Selection for Modeling Intrusion Detection", IJCNIS, vol.6, no.7, 2014, pp.56-62. DOI: 10.5815/ijcnis.2014.07.08.
- A. Bhandari, A.L Sangal, K. Kumar, "Destination Address Entropy based Detection and Traceback Approach against Distributed Denial of Service Attacks", IJCNIS, vol.7, no.8, 2015, pp.9-20, DOI: 10.5815/ijcnis.2015.08.02.
- A. P. Singh, M. D. Singh, "Analysis of Host-Based and Network-Based Intrusion Detection System", IJCNIS, vol.6, no.8, 2014, pp.41-47, DOI: 10.5815/ijcnis.2014.08.06.

