Anomaly detection using modified linearity based grey swarm optimization algorithm and efficient hyper parameter optimization techniques

Author: Advit Sharma, Dr. Sugandh Khanna
Journal: Social Informatics Journal @socialinformaticsjournal
Article in issue: 1 vol.3, 2024.
Free access
Attacks and anomalies are quiet common in today’s technological world. However it is important to identify these anomalies as soon as possible since these anomalies can cause various problem. Therefore anomaly detection plays a vital role in detecting these outliers. Anomaly detection detects suspicious activity which fundamentally falls outside of the respected pattern of behaviour. Anomaly detection aims at identifying the unpredicted and unexpected events in data streams which are commonly referred to as anomalous events. Therefore proposed modified linearity based grey swarm algorithm and hyperparameter optimization techniques for improving the performance of the proposed model. Hyperparameter optimization techniques implemented in the proposed model are genetic algorithm (GA), Grid Search and Random Search. Feature selection is implemented in the proposed model is modified linearity based grey swarm algorithm since it has the ability to reduce the convergence. In addition to modified linearity based grey swarm algorithm, modified objective function is employed in the proposed model as it has the capability to find solutions to problems which are difficult to solve. Finally the performance of the proposed model is evaluated and assessed using various performance metrics such as accuracy, recall, precision and F1 score. At last, proposed model is compared with the existing models and found that proposed model outperformed other existing models.
Anomaly detection, Modified Linearity Based Grey Swarm Algorithm, feature selection, hyperparameter optimization techniques, genetic algorithm, grid search, random search
Short address: https://sciup.org/170204396
IDR: 170204396 | UDC: 004.052.3 | DOI: 10.58898/sij.v3i1.65-84
Text of the scientific article Anomaly detection using modified linearity based grey swarm optimization algorithm and efficient hyper parameter optimization techniques
Intrusion detection system is used to detect and identify the anomalies present in the network. These anomalies have the ability to produce damage to the network [1] . In general IDS can be in either network based IDS or host based IDS. Some of the benefits of employing IDS includes- detection of malicious activities, as it helps with improving the performance of the network as IDS can detect any issues on the network, it also provided valuable and noteworthy insights related to enhancement of network security [2] . There are various types of IDS – which includes NIDS, HIDS, SIDS, AIDS. NIDS are usually deployed at a strategic points present within the network, where it can check the inbound traffic and outbound traffic to and from all devices exist on the network [3] . NIDS have the ability to detect and identify any type of malwares and other unknown threats quickly and rapidly. . NIDS frequently monitors and checks the network traffic to detect any suspicious activity and block those activities before the hackers are able to gain access to the system [4] . HIDS usually runs on any type of computer with undeviating contact to both enterprise network and internet. Signature based defects (SIDS) identify the attacks on the basis of any particular patterns which includes number of bytes, number if 1s, 0s present in the traffic. SIDS also have the capability to detect on the source of previously known malicious instruction sequence which is utilized by malware. [5] .

© 2024 by the authors. This article is an open access article distributed under the terms and conditions of the Creative Commons Attribution (CC BY) license (https://creativecommons.0rg/licenses/by/4.O/).
Anomaly based IDS which are commonly known as AIDS. AIDS are considered to be rule based rather than signature based. Even though, AIDS are accurate and effective, they are most probably suitable for attacks [6] . They also have the ability to detect any abnormalities at different levels. AIDS are usually introduced to discover unknown malware attacks since new malware is established rapidly. In AIDS, trustworthy activity model is created by using ML classifiers and defects are compared with the model and if there are any defects then, it is said to be suspicious model and if not model is declared as unsuspicious one. ML based approaches possess better widespread property when compared to signature based IDS, since Anomaly based IDS can be skilled according to the hardware configurations [7] . There are 3 main classes of anomaly detection approaches, which are unsupervised, supervised and semi-supervised methods. Supervised anomaly detection technique, comprises training the classifier and it is quite similar to conventional pattern recognition. Semi-supervised anomaly detection technique employed normal and labelled training dataset in order to construct an ideal model which represent the normal behaviour [8] and finally unsupervised methods are employed in order to identify the anomalies in an unlabelled set of data which is specially based on the intrinsic properties of the data [9] . In general anomaly detection techniques are classified into 3 types [10] . Clustering based anomaly detection method, density based and finally support vector machine based anomaly detection. Clustering based anomaly detection method comes under unsupervised learning whereas SVM is typically employed in supervised learning however, extension of SVM can be employed to detect the anomalies of unlabelled data. Finally density based anomaly detection method depend on the hypothesis that normal data points incline to take place in dense area, while anomalies emerge far away and sporadically [11] .
IDS detect the suspicious or malicious activities present in the network by monitoring the network traffic. Therefore the primary objective of any IDS is to detect the anomaly and report the attacks. However, very few IDS are capable enough to take actions against these suspicious attacks are detected, which includes obstructing the traffic sent from doubtful IP address. Therefore Data mining techniques play an increasingly crucial role in IDS, since unrelenting capability of the IDS to detect the malicious attacks has become an implementation in scalability. Hence suggested study [12] implemented IDS using MFP-Tree (modified frequent pattern) through k-means algorithm. The dataset implemented was KDD cup 1999, in which the dataset is classified as training dataset and testing dataset as 80:20. The pre-processing stage of the training dataset and testing dataset took place, in which outliers are removed in both training and testing dataset. After eliminating the outliers, FP algorithm was implemented with ARM (Association Rule Mining) through k-means clustering algorithm. From the experimental results it was identified that, suggested model delivered different accuracy rate for different attacks, mostly less accurate results. In recent years, IDS in IoT plays a significant role in securing the information present in the devices without any intervention of human activities. However, possibility of attacks are very much possible in the network. Hence many techniques have been incorporated to secure IoT which includes, encryption, data integrity, and authentication. In addition to these techniques, implementation of ML and DL methods have brought effective and efficient security tool. Therefore suggested study [13] employed IDS using GB (Gradient Boosting) and DT (Decision Tree). The datasets employed in the suggested study has been IoT-23, edge-IIoT, NSL-KDD, and BoT-IoT and datasets.
Though the existing studies have provided better results, they lack in accuracy of the results, poor convergence rate and inefficient hyperparameter optimization methods and low dimensionality reduction which can be overcome by employing modified linearity based grey swarm algorithm for feature selection and hyper parameter optimization with random search, Grid search and GA to reduce the convergence and to reduce the repetition which maintains the linearity.
Aim and Objectives
-
• To reduce the convergence rate by implementing modified linearity based grey swarm algorithm for feature selection
-
• To enhance the ability of the proposed model by employing hyperparameter optimization techniques such as Genetic Algorithm, Grid Search and Random Search for reducing the complexity of the algorithm.
-
• To assess the efficiency of the proposed model by employing performance metrics in order to determine the effectiveness of the proposed framework
Paper Organization
Paper is organized as follows. Section II discusses the review of conventional works with suitable problem identification. Following this, the overall proposed system is elaborated in Section III with suitable flow, architecture, mathematical equations and explanations. The outcomes procured from the execution of the proposed system are presented in Section IV. The study is precisely summarized in Section V with future suggestions
Literature review
IDS is a system which monitors the network traffic and detect the suspicious activity and alert when malicious activity is discovered [14] . Since internet and computer network largely suffer from security threats, it is important to detect these threats as early as possible hence suggested study focussed on implementing data mining algorithms and tools in order to examine and capture any anomalous present in the network. Therefore swarm intelligence has been incorporated with DM [15] to generate light weight but robust techniques to detect the data flow effectively. Some of the reasons of implementing SI in IDS because of its adaptive nature, robustness and simplicity. In machine learning, anomaly detection are considered as an important area which assist in discovering the hidden behaviour present within the data that is most vulnerable and susceptible to attacks. Therefore suggested study [16] employed hybrid k-mean array and SMO (Sequential Minimal Optimization) rating to enhance the accuracy and precision of the anomaly detection rate. ML algorithms are implement in various existing studies, because it enhances the detection rate and also minimizes FP (false positive) alarm rate and it also possess the ability to enhance the precision of the intrusion classification. The dataset implemented in the suggested study was NSL-KDD (Network Security-Knowledge and Data Discovery) and SMO and K-mean cluster were implemented for classification, which helped in enhancing the rate of positive detection in addition to decreasing the rate of false alarms and attaining a high accuracy at the same time. Apart from ML, various DL methods have also been included in various studies a dynamic network anomaly detection system employing DL approach, which employed LSTM and attention mechanism in order to improve the performance of the model. LSTM model, implemented in the suggested study performed in processing time-correlated sequences, in addition to LSTM, SMOTE an oversampling algorithm also employed in order to fetch additional samples and then helps in optimizing the loss function, which helps in progressing the class imbalance issue. The dataset utilized in the suggested study was CSE-CIC-IDS2018 [17] .
Another prediction model [18] utilizing RNN was employed in order to detect abnormalities and anomalies and to determine, whether the upcoming packets is either a normal or abnormal packets using an appropriate distance measure. In order to implement this approach, LSTM model was employed and n-gram and sliding window were applied to learn the data in the model, sometimes normal anomaly detection model are high in rate and time to take control the traffic load is quite challenging, hence the suggested study employed hybrid anomaly detection model [19] , as the suggested model helped in increasing the efficiency of the attack detection. Suggested model comprised of two parts in which, one part of the model utilized protocol analyser and ML algorithms for decreasing the handling time and maximize the precision whereas the second part applied a dynamic feature selection with GA algorithm in order to classify the attacks which are unknown and proliferate the accuracy. 5 datasets such as IUNSW-NB-15 Jan, ISCX-2017, MAWILab-2018 and UNSW-NB15 Feb were implemented in the suggested study, as these datasets contained diverse attacks, suggested paper employed different feature selection techniques in order to detect the best features. Anomaly detection has considered as a significant and dynamic research in the field of data mining, therefore wide range of applications have been embraced different kinds of techniques to detect the anomaly for ensuring privacy and security of the user. Hence suggested study considered social network detection of fake news, abnormal activities, rumours, malicious link using hybrid anomaly detection method termed as DT-SVMNB, which consisted of various ML algorithms such as DT, SVM, NB. These classifiers are employed in classifying normal users and abnormal users in social networks. Two datasets implemented in the suggested study and the model classified the users as suicidal or depressed on in social network.
One of the main issues for network managers and researchers is detection of anomalies in network traffic, these anomalies exist in the network traffic may signal a network intrusion which require the use of rapid and reliable NIDS. Therefore IDS systems which are based on AI methods are attaining the consideration of the domain related to research as AI methods have been progressed a lot in recent years. Hence suggested study [20] employed ANN for anomaly detection using cuckoo search algorithm. The dataset implemented in the study was NSL-KDD dataset which has been employed with a ratio of 70:30, in which 70% of the data where used for training and 30% data were used for testing. The suggested model was then evaluated using performance metrics such as MSR (mean square root), accuracy, MAE (Mean Absolute Error),accuracy, RMSE (root mean square error).the suggested model then was compared with various standard methods like FC-ANN (fuzzy clustering artificial neural network), ID with ABC (intrusion detection with artificial bee colony), NN-IDS (Neural network intrusion detection). As attacks are becoming more and more critical, it is important to detect the attacks as quickly and as rapidly as possible. Hence in order to enhance the security of the network, IDS are employed in order to identify the anomalies in network traffic. Therefore the suggested study [21] implemented ML techniques to detect the incoming anomalous patterns of traffic. The machine learning algorithm implemented in the suggested study was
SVM by implementing artificial bee colony along with optimization cuckoo search algorithm for optimizing SVM hyper-parameters for operative and efficient classification. The process involved in the suggested study was- preprocessing the dataset, in the next step- feature selection was implemented and the dataset utilized was NSL-KDD dataset. After pre-processing stag and feature selection phase, the dataset is classified into training dataset and testing dataset. Then optimizing the parameters of SVM with ant bee colony and cuckoo search algorithm, then classification of the model was analyzed using SVM algorithm and the results are detected. The results were further evaluated using accuracy, recall and precision.
Anomaly detection has emerged as one of the significant methods in various application areas mainly for security purposes, therefore it is important to consider an anomaly detection based ML algorithms which assisted in detecting the anomalies and abnormalities. Therefore the suggested study [22] implemented dimensionality reduction and classification algorithm using KDD99 dataset for network IDS. Dimensionality reduction was employed using PCA and SVM algorithm was implemented for classification. The experimental results demonstrated that, SVM with PCA method was considered as more accurate and more precise as the number of misclassification reduces. As IoT have become one of the central technologies across industries, there is a possibility of security attacks which target the integrity of data. Therefore effective and dependable anomaly detection is required to identify the malicious attacks. Hence suggested paper [23] employed DL- based anomaly detection for IoT. The model employed in the suggested paper was based on denoising autoencoder which has been utilized as a building block in DNN. Features are extracted efficiently using denoising autoencoder which are robust. The results from the existing study demonstrated the effectiveness of the suggested model, in terms of enhancing the detection of anomalies present in network traffic. Suggested study [24] also employed AI techniques, in which ODODL-IDS (Outlier Detection with Optimal Deep Learning Enabled Ids). The main concept behind ODODL-IDS model was to detect the outliers and classify the intrusions present in the network. Removal of outlier was employed using CNN-ALSTM (CNN-Attention Long Short Term Memory). Further hyper-parameter tuning was implemented using PROA algorithm (poor and rich optimization). From the experimental results it was identified that ODODL-IDS model resulted in better accuracy of around 98.69%.
PROBLEM IDENTIFICATION
-
• Even though suggested model were loaded with set of pre-defined alert signatures, volume of alerts cannot be managed by suggested model [16] .
-
• Possibility of high false alerts if not tuned intrusion detection system correctly [19] .
-
• Accuracy of the suggested model to detect the anomalies is lower than the proposed model, which makes the existing model less efficient and ineffective [24] .
PROPOSED METHODOLOGY
The main goal of the planned research is to identify any possible attacks in the network traffic. To efficiently and effectively identify network attacks, the suggested approach utilized Modified linearity based grey swarm algorithm for feature selection along with genetic algorithm, grid search, and random search for hyper parameter tuning. Figure 1 shows the general proposed model methodology.
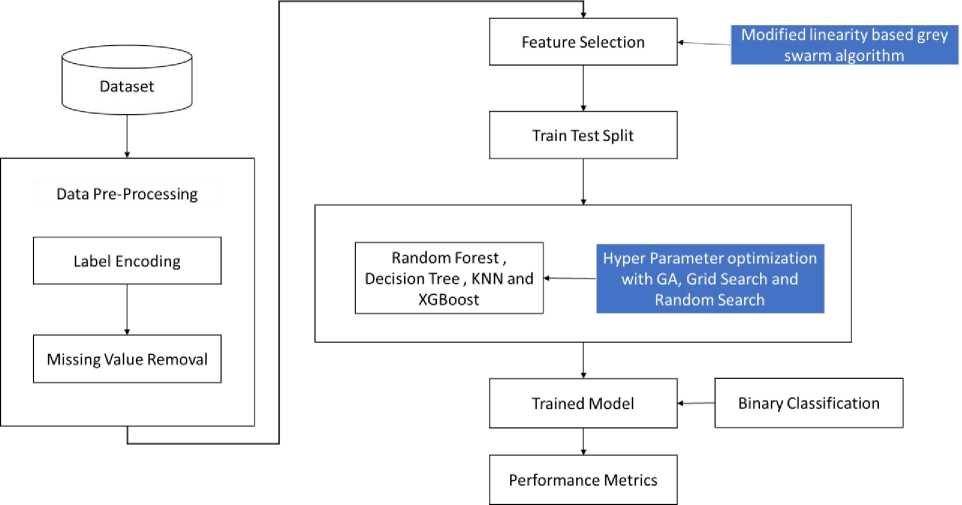
Figure 1 Overall Flow for the Proposed Method
The research is focusing on the UNSW-NB15 dataset. The dataset is used to load the data and then it goes through pre-processing. The pre-processing procedure involves criteria like label encoding and removing missing values. Once the data has been pre-processed, features are selected by the updated linearity-focused grey swarm algorithm. The enhanced linearity grey swarm algorithm is utilized for accurately selecting features without omitting any data. The chosen data is divided into training and testing sets. The algorithms Random Forest, Decision tree, KNN, and XGBoost train the data through Hyper Parameter optimization using Genetic Algorithm, Grid Search, and Random Search. Afterwards, the trained information is inserted into the model using binary categorization. Once the model has been trained on the data, the performance metric values are assessed.
Modified linearity based grey swarm algorithm for feature selection
PSO is a metaheuristic algorithm inspired by the social behaviour of birds or fish. It consists of a swarm of particles that move through a solution space, exchanging information with each other. Each particle represents a potential solution, and its position corresponds to a set of feature weights. Particle swarm optimization is a powerful technique for feature selection. By leveraging the social behaviour of particles, PSO can identify relevant features and improve the performance of machine learning models. Its simplicity, effectiveness, and ability to handle highdimensional datasets make it an attractive option for feature selection tasks. The Grey Swarm Algorithm effectively combines swarm intelligence with grey wolves' cooperative hunting behaviour to create an optimization method. It is a commonly employed method for optimization. However, the grey swarm algorithm shows poor performance, low solution accuracy, vulnerability to getting trapped in local optima, and insufficient local search abilities. The limitations of the grey swarm algorithm include dependence on parameter training, sensitivity to the initial swarm, slow convergence speed, lack of robustness, and restricted applicability. To overcome these limitations, scholars recommended a modified version of grey swarm optimization that focuses on linearity. The proposed study presented a modified grey swarm algorithm that reduces convergence time for better accuracy, enhanced performance, less repetition, while still maintaining linearity for feature selection. Figure 2 illustrates about the feature selection for grey wolf algorithm and particle swarm algorithm.
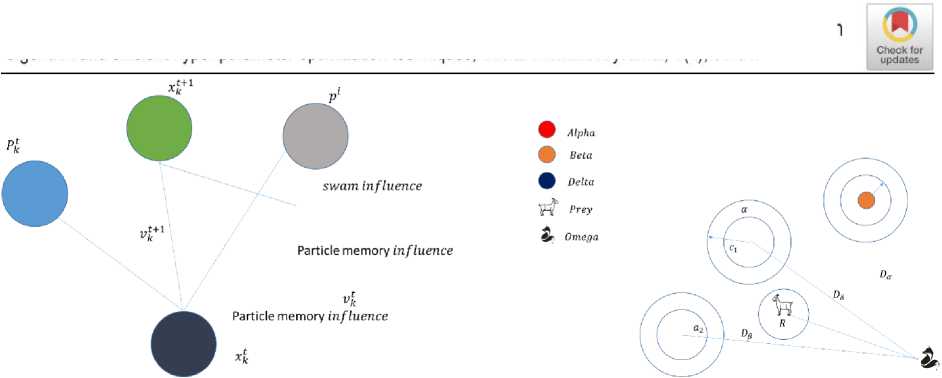
Figure 2 Feature selection a) Grey wolf algorithm b) Particle swarm algorithm
The steps involved in grey wolf optimization is shown below,
D = |C . X p (t) -X(t)|
X(t + 1) = Xp (t) - A⃗. D⃗(2)
Where current iteration is described as t and A⃗ and C⃗ co-efficient vectors, X is denoted as position vector of grey wolf, Xp⃗ is denoted as position vector of the prey.
A = 2a. rand1 - a
C = 2rand2⃗(4)
a⃗ is decreased linearly from 2 to 0. r1⃗ and r2⃗ are denoted as random vector in [0,1]. Steps are for hunting and Final position of the wolf X⃗(t+1) is listed below
D⃗α = |C⃗1 .X⃗α-X|(5)
D⃗β = |C⃗2 .X⃗β-X|(6)
D⃗δ = |C⃗3 .X⃗δ-X|(7)
X⃗1 =X⃗α-A1 . D⃗α⃗(8)
-
X⃗ 2 = X⃗ β - A 2 .D β
X⃗3 = X⃗δ - A3 . D⃗δ⃗(9)
X(t+ 1) = X⃗1⃗⃗+X⃗2⃗+X⃗3⃗(10)
Mathematical model for PSO is mentioned in the below equation (11)
vk+1 =У( w * vk + cl * rand * pbestk -xt) + c2 * rand * (gBest - xk))(11)
-
• Discovery: Initially, with a higher inertia weight, particles can explore the search area extensively by continuing in their current direction. This aids in avoiding early settling on local optima.
-
• Utilization: During the algorithm's advancement, a reduced inertia weight prompts particles to move closer to advantageous regions revealed by pbest and gbest. This narrows the search to possibly improved solutions.
Inertia Weight (ω) and its Role:
In the revised Particle Swarm Optimization (PSO) algorithm, the inertia weight (ω) plays a critical role in regulating the trade-off between exploration and exploitation in the search process. Equation 11explains about the PSO mathematical model. Here is an analysis of its performance:
-
• Exploration: At the beginning of optimization, a greater ω value enables particles to explore the search space extensively. This occurs because the past velocity (v_i^d) has a stronger impact on the present velocity adjustment. Particles retain momentum from past movements, enabling them to explore different parts of the search space.
-
• Utilization: While the algorithm advances and ω decreases over time, the impact of pbest and gbest (related to rand1 and rand2) becomes increasingly important. This steers particles towards areas with superior fitness values determined by their individual best positions (pbest) and the best position of the whole group (gbest) in the swarm. This narrows down the search to regions with a greater likelihood of identifying the best solution.
Pseudo code for APSO is listed below in algorithm 1
Algorithm 1 – Adaptive particle swarm optimization
Step 1: Initializing the population of particle
Step 2 : parameteres are initialized
Step 3 : while (t < Max number of iteration)
Step 4: for each particle with position xp
Step 5: fitness value f(xp)is calculated
Step 6: if f(x)is better than pbest, then
Step 7: pbest, +Xp
Step 8: end if
Step 9: if f(pbestp)is resulted better results than gbest then
Step 10: gbest + pbest,
Step 11: end if
Step 12: end for
Step 13: updating w in accordance to equation
Step 14: for each particle with position x p
Step 15: according to equations, cl, c2 are updated
Step 16: velocity of each particle by equation is calculated
Step 17: location of each particle by equation is updated
Step 18: end for
Step 19: t = t + 1
Step 20: end while
Step 21: return gbest |
And equation for modified linearity equation is given below in equation (12), y =----ГТ— (12)
|2-c 1 - J c 1 -4c 2 |
The flow for modified linearity based grey swarm algorithm for feature selection is shown in the figure 2.
Calculating the dynamic inertia weight.
Equation 12 describes a linear formula to determine the inertia weight (ω) using the current iteration number (t) and the maximum number of iterations (T_max).
Basically, the altered PSO with inertia weight enables particles to efficiently navigate through the search space initially and then gradually focus on promising areas near pbest and gbest as the search advances, increasing the likelihood of discovering the best solution.
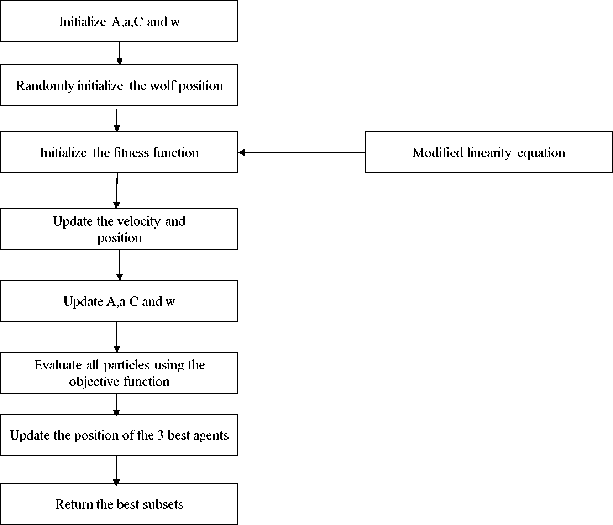
Figure 3 Modified Linearity Based Grey Swarm Optimization Algorithm
Figure 3 displays the complete flow of the grey swarm algorithm with modified linearity used for feature selection. Initially, the values are set as A, a, C, and w. The initial position of the wolf is placed at random. The modified linearity equation is used to initialize the fitness function. A, a, C, and w represent the updated position and velocity. The objective function is used to assess the updated particles. Their position determines which agents are the top three. The best subsets are given back with the agents that have been updated. The modified objective function equation is described below, v£+1 = y(U(^i + x| + x3 + xj ■■■ + хП) - U(v( + vj + vj + v4 _ + v^)) (13)
0=0- |W_0U(0;x ‘ ;y i ) (14)
An objective function is defined as U(0; x1 ; y1)
whose partial derivative with respect to each parameter of is x(1) VeU(0; x(1) ; y(1)) , therefore the core equation of gradient descent is illustrated in above equation
Pseudo code for modified objective function is listed below
Algorithm 2- Modified Objective Function
Step 1. Start
Step 2. initialize the position vector randomly and select an appropriate value of set size ц
Step 3. While the increase in number of iterations are not exceeded
-
a. Assess the partial derivative of the objective function in relation to the dimensions of the position vector
-
b. In accordance with equation, update the position vector
Step 4. End
Step 5. Solution == 0
Step 6. End
The modified Objective function algorithm demonstrates pseudocode for the modified objective function. In which the position vector are adjusted randomly and appropriate value of set size µ is designated. Subsequent, partial derivate of the objective function is assessed and rationalised the position vector in accordance with the equation.
Hyperparameter Optimization
Hyper parameter optimization involves defining right combination of hyper parameter values to achieve optimal performance on the data within a reasonable timeframe. Hence, it is a contributing factor to the incorporation of hyper parameter optimization methods in the proposed research method. Grid search, random search, and Genetic Algorithm are the methods employed in this optimization.
Random Search
Randomized search is favoured over other algorithms due to its quicker processing time and faster optimization of hyper parameters, making it chosen method for implementation. However, lack of balance between speed and accuracy in processing can limit randomized search's ability to discover best hyper parameter combinations. Hence, proposed methodology also incorporates the use of grid search method. Nevertheless, varying outcomes arise when hyper parameter optimizations are combined with various classifiers.
Grid Search
Grid search is used to optimize the classifiers parameters through hyper parameter optimization techniques. In grid search, number of layers and learning rate are the two key parameters regarded as most significant. Grid search is perhaps one of the most straightforward traditional methods for conducting hyper-parameter optimization. It results in combination of hyper-parameter options by creating a Cartesian product. Grid evaluates and educates the ML algorithm with every possible hyper parameter combination, with assistance from performance metrics. Grid search is regarded as the most straightforward method among all hyper parameter tuning techniques. Search on a grid. The main purpose of employing the grid search algorithm is to ensure the discovery and recognition of the optimal hyper parameter. Grid search method aids in discovering the best hyper parameter to enhance and maximize the effectiveness of the suggested model. Therefore, Grid search algorithm was surpassed by alternative weighted random search techniques as the complexity of the ML model increased.
Genetic Algorithm
Genetic algorithm (GA) is determined by principles of evolution, where individuals with superior endurance and adaptability to their environment are more likely to survive and pass on their traits to the next generation. GA offers various benefits for hyper parameter tuning such as yielding multiple optimal solutions, being probabilistic and needing minimal information. GA utilizes evolutionary theory of constraints for optimization, where each chromosome represents a hyper parameter.
The proposed methodology has incorporated grid search, randomized search, and genetic algorithm as hyper parameter optimization techniques for these reasons.
RESULTS AND DISCUSSION
Dataset description
UNSW-NB15 dataset was generated in cyber range lab by by IXIA PerfectStorm tool. This dataset comprises of 9 attacks which includes worms, exploits, and generic, DoS, fuzzers, backdoor, shellcode, analysis and reconnaissance.
Dataset link-
Performance Metrics
The Performance metrics have become a part of each ML. Performance metrics are utilized in analyzing the classification models for the provided balanced datasets. The performance of the proposed IDS design is determined with the performance metrics like F1-score, precision, accuracy and recall.
-
a) Precision (Pc)
The term precision is signified as the covariance unit of the technique which is resulted by the appropriately recognized cases (TRP) to the total group of cases that are accurately categorized (TRP+FLP). It includes repeatability and reproducibility of the capitals. It is calculated with the equation (4.1).
Pc =
TRP
FLP+TRP
(4.1)
In equation (4.1), TRP refers to True-positive and FLP refers to False-positive respectively.
-
b) Recall (Rc)
The term recall is signified as the reclusive of the production metric that estimates the total of accurate positive categories made out of all the optimistic categories. It is calculated with the following equation (4.2).
Rc =
TRP
FLN+TRP
(4.2)
In equation (4.2),FLN refers to False-negative.
c) F1-score
F1 score is denoted as the weighted harmonic-mean value of recall and precision, the F1 score is estimated with the following equation (4.3).
i „ RcxPc
(4.3)
F1 — score = 2 x----
Rc+Pc
d) Accuracy (Acc)
The term accuracy is denoted as the system organization rate that is conveyed through the quantity of correctly classified cases (TRN+TRP) to the total cases of the dataset (TRP+FLP+TRN+FLN). The accuracy range is calculated with the following equation (4.4).
Acc =
TRN+TRP
TRP+FLP+TRN+FLN
(4.4)
where, TRN refers to True-negative and FLN refers to False-negative.
-
4.3 Performance Analysis
Random Forest
Performance of the present proposed system is assessed with regard to confusion matrix and ROC curve. A confusion matrix is constructed which is a table that defines the classifier performance. This matrix visualizes and concludes the classifier performance. It affords information regarding errors made by classifier and error kinds that prevail. It also explores the way in which a classifier is confused or disorganized in making predictions. Confusion matrix is given in table 1 while, ROC curve is shown in figure 4.
ROC curve is a graph which shows the performance of a model associated with classification, at all classification thresholds.
-
2 parameters involved in ROC are- true positive rate and false positive rate.
Accuracy, precision, recall and F1 score of random forest with grid search is mentioned in the table 2. In which accuracy obtained is 0.924596, precision is 0.93, recall is 0.92 and F1-score is 0.93.
Table 1 Random forest with grid search
|
Confusion matrix for percentage split data |
Random forest with grid search |
|
|
Attack(-) |
Non attack (+) |
|
|
Attack (-) |
7741 |
402 |
|
Attack (+) |
1541 |
16084 |
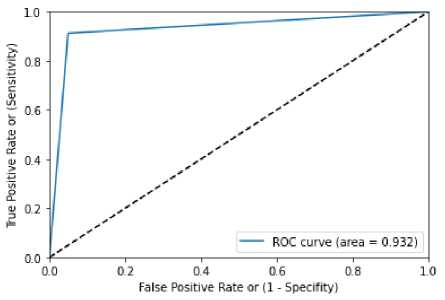
Figure 4 ROC curve for Random forest with grid search
Table 2 performance metrics for Random forest with grid search
|
Accuracy value |
Precision Rate |
Recall rate |
F1-Score rate |
|
0.924596 |
0.93 |
0.92 |
0.93 |
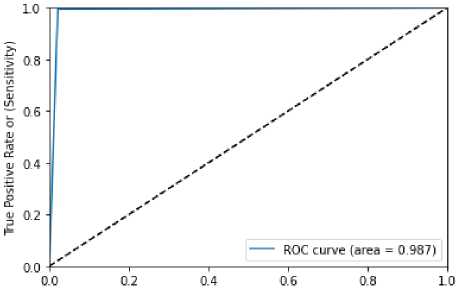
Confusion matrix table and ROC curve figure for random forest with randomizedsearchCV is demonstrated in table 3 and figure 5. ROC value obtained by the figure 4 0.987. Accuracy rate of 0.99, precision value of 0.99, recall value of 0.99, F1-score of 0.99 are tabulated in table 4.
Table 3 Random Forest with RandomizedSearchCV
|
Confusion matrix for percentage split data |
Random Forest With RandomizedSearchCV |
|
|
Attack(-) |
Non attack (+) |
|
|
Attack (-) |
9210 |
200 |
|
Attack (+) |
72 |
16286 |
False Positive Rate or (1 - Specifity)
Figure 5 ROC curve for Random Forest with RandomizedSearchCV
Table 4 performance metrics for Random Forest with RandomizedSearchCV
|
Accuracy value |
Value of Precision |
Recall rate |
F1-Score value |
|
0.99 |
0.99 |
0.99 |
0.99 |
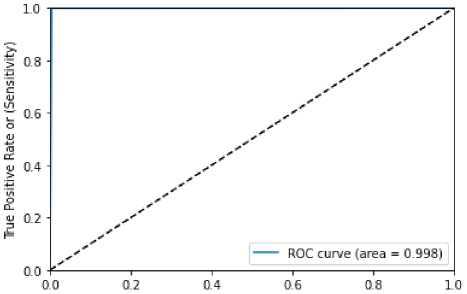
Confusion matrix table 5 and ROC curve figure for random forest with genetic algorithm is demonstrated in figure 6. Value of ROC obtained by the figure 5 is 0.998. Accuracy rate of 0.998, precision value of 0.99, recall value of 0.99, F1-score of 0.99 are tabulated in table 6.
Table 5 Random Forest with Genetic Algorithm
|
Confusion matrix for percentage split data |
Random Forest With Genetic Algorithm |
|
|
Attack(-) |
Non attack (+) |
|
|
Attack (-) |
9275 |
32 |
|
Attack (+) |
7 |
16454 |
False Positive Rate or (1 - Specifity)
Figure 6 ROC curve Random Forest with Genetic Algorithm
Table 6 performance metrics Random Forest with Genetic Algorithm
|
Value of Accuracy |
Precision value |
Recall rate |
F1-Score value |
|
0.998 |
0.99 |
0.99 |
0.99 |
Decision Tree
Confusion matrix table 7 and ROC curve for Decision Tree WITH Grid Search figure is demonstrated in figure 6. Value of ROC obtained by the figure 7 is 0.909. Accuracy rate of 0.918232, precision of 0.92, recall of 0.92, F1-score of 0.92 are tabulated in table 8
Table 7 Decision Tree with Grid Search
|
Confusion matrix for percentage split data |
Decision Tree WITH Grid Search |
|
|
Attack(-) |
Non attack (+) |
|
|
Attack (-) |
8271 |
1174 |
|
Attack (+) |
933 |
15390 |
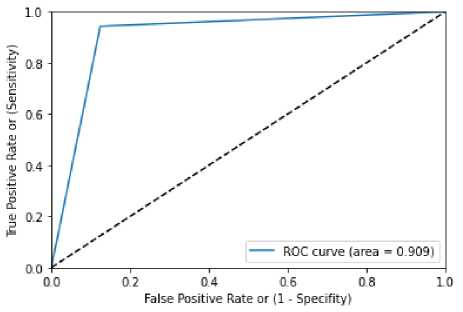
Figure 7 Roc Decision Tree with Grid Search
Table 8 Performacne Metrics For Decision Tree with Grid Search
|
Value of Accuracy |
Precision value |
Recall rate |
F1-Score value |
|
0.918232 |
0.92 |
0.92 |
0.92 |
Figure 8 denoted the curve of ROC and confusion matrix table 9 for Decision Tree WITH Random Search is demonstrated. Value of ROC obtained by the figure 8 is 0.909. Rate of Accuracy 0.891, value of precision 0.91, recall value of 0.89, finally 0.89 is denoted as F1 score value are tabulated in table 10.
Table 9 Decision Tree with Random Search
|
Confusion matrix for percentage split data |
Decision Tree WITH Random Search |
|
|
Attack(-) |
Non attack (+) |
|
|
Attack (-) |
6755 |
358 |
|
Attack (+) |
2449 |
16206 |
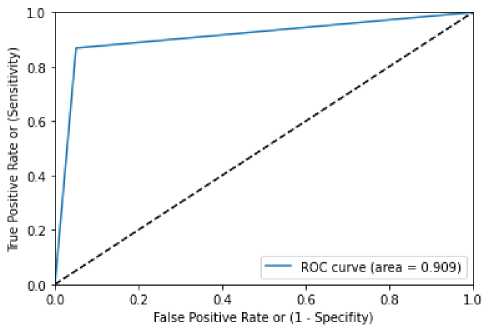
Figure 8 ROC curve for Decision Tree with Random Search
Table 10 performance metrics of Decision Tree with Random Search
|
Value of Accuracy |
Value of Precision |
Recall rate |
F1-Score value |
|
0.891 |
0.91 |
0.89 |
0.89 |
ROC curve figure for Decision Tree with Genetic Algorithm and table 11 for confusion matrix is demonstrated in figure 9. Value of ROC obtained by the figure 9 is 0.902. 0.891 is denoted as accuracy, 0.91 is denoted as value of precision, 0.89 is denoted as recall and 0.89 is denoted as F1 score value are tabulated in table 12.
Table 11 confusion matrix for Decision Tree with Genetic Algorithm
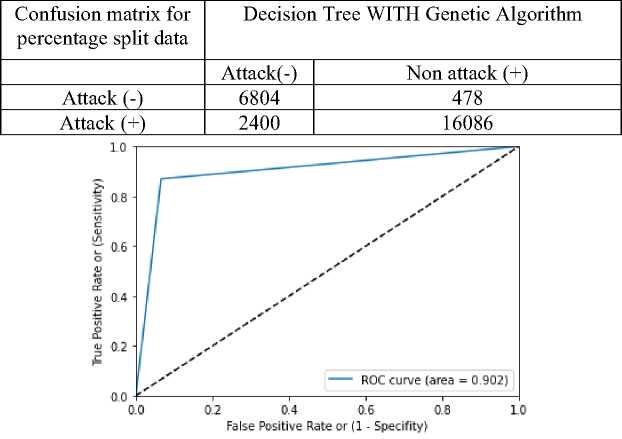
Figure 9 ROC curve for Decision Tree with Genetic Algorithm
Table 12 performance metrics for Decision Tree with Genetic Algorithm
|
Accuracy value |
Precision value |
Recall rate |
F1 Score score value |
|
0.891 |
0.91 |
0.89 |
0.89 |
XGBoost
Table 13 for confusion matrix and ROC curve for XGBoost with Grid Search is demonstrated in figure 10. Value of ROC obtained by the figure 8 is 0.954. Value of accuracy obtained is 0.957389, value of precision attained is 0.96, recall rate attained is 0.96 and finally 0.96 is attained by F1 score value. These values are tabulated in table 14.
Table 13 confusion matrix XGBoost with Grid Search
|
Confusion matrix for percentage split data |
XGBoost with Grid Search |
|
|
Attack(-) |
Non attack (+) |
|
|
Attack (-) |
8837 |
554 |
|
Attack (+) |
544 |
15833 |
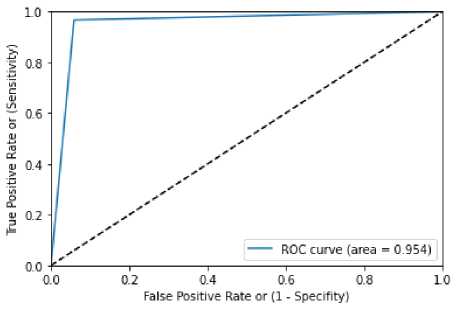
Figure 10 ROC curve for XGBoost with Grid Search
Table 14 performance metrics of XGBoost with Grid Search
|
Accuracy |
Precision |
Recall |
F1 Score |
|
0.957389 |
0.96 |
0.96 |
0.96 |
Figure 11 denoted ROC curve for XGBoost with Randomized Search CV and table 15 for confusion matrix is demonstrated in figure 11. Value of ROC obtained by the figure 11 is 0.957. Value of accuracy, value of precision, recall rate and F1 score value obtained are 0.959717, 0.96, 0.96, 0.96. These values are tabulated in table 16.
Table 15 confusion matrix of XGBoost with Randomized Search CV
|
Confusion matrix for percentage split data |
XGBoost with Randomized Search CV |
|
|
Attack(-) |
Non attack (+) |
|
|
Attack (-) |
8851 |
508 |
|
Attack (+) |
530 |
15879 |
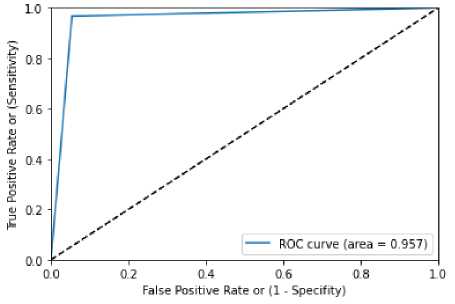
Figure 11 ROC curve for XGBoost with Randomized Search CV
Table 16 performance metrics of XGBoost with Randomized Search CV
|
Accuracy value |
Precision value |
Recall rate |
F1 Score value |
|
0.959717 |
0.96 |
0.96 |
0.96 |
Table 17 denoted the confusion matrix for XGBoost with genetic algorithm and figure denoted the ROC curve is demonstrated in figure 12. Value of ROC obtained by the figure 12 is 0.992. Accuracy rate obtained by XGBoost with genetic algorithm is 0.992627, precision value obtained is 0.99, recall value obtained is 0.99, F1-score obtained is 0.99 are tabulated in table 18.
Table 17 Confusion matric for XGBoost WITH Genetic Algorithm
|
Confusion matrix for percentage split data |
XGBoost WITH Genetic Algorithm |
|
|
Attack(-) |
Non attack (+) |
|
|
Attack (-) |
9290 |
99 |
|
Attack (+) |
91 |
16288 |
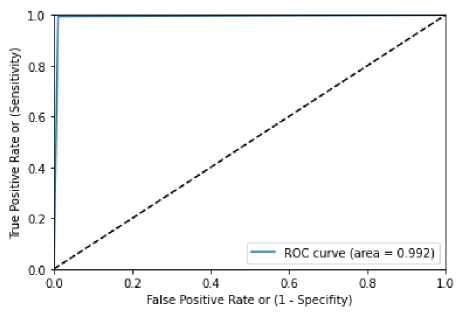
Figure 12 ROC curve for XGBoost with Genetic Algorithm
Table 18 performance metrics of XGBoost with Genetic Algorithm
|
Accuracy value |
Precision value |
Rate of Recall |
F1 Score value |
|
0.992627 |
0.99 |
0.99 |
0.99 |
KNN Classification
Figure 11 denoted KNN with grid search and table for confusion matrix is demonstrated in table 19. Value of ROC obtained by the figure 13 is 0.969. Finally, rate of accuracy obtained is 0.973494, value of precision obtained is 0.97, recall rate obtained by KNN with grid search is 0.97, F1-score attainted is 0.97 are tabulated in table 20.
Table 19 confusion matrix of KNN WITH Grid Search
|
Confusion matrix for percentage split data |
KNN WITH Grid Search |
|
|
Attack(-) |
Non attack (+) |
|
|
Attack (-) |
9001 |
463 |
|
Attack (+) |
220 |
16084 |
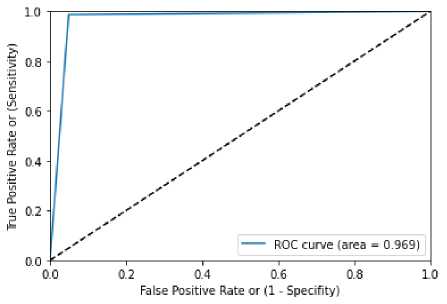
Figure 13 ROC curve of KNN WITH Grid Search
Table 20 performance metrics of KNN WITH Grid Search
|
Accuracy value |
Value of Precision |
Recall rate |
F1 Score value |
|
0.973494 |
0.97 |
0.97 |
0.97 |
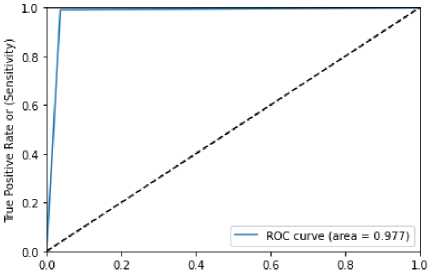
Confusion matrix table for KNN with randomized search CV and ROC is denoted in table 21 and figure 14 respectively. Value of ROC obtained by the figure 14 is 0.977. Accuracy rate of 0.980635, precision of 0.98, recall of 0.98, F1-score of 0.98 are tabulated in table 22.
Table 21 confusion matrix of KNN WITH Randomized Search CV
|
Confusion matrix for percentage split data |
KNN WITH Randomized Search CV |
|
|
Attack(-) |
Non attack (+) |
|
|
Attack (-) |
9070 |
348 |
|
Attack (+) |
151 |
16199 |
False Positive Rate or (1 • Specifity)
Figure 14 ROC curve of KNN WITH Randomized Search CV
Table 22 performance metrics of KNN WITH Randomized Search CV
|
Rate of Accuracy |
Value of Precision |
Recall rate |
F1 Score value |
|
0.980635 |
0.98 |
0.98 |
0.98 |
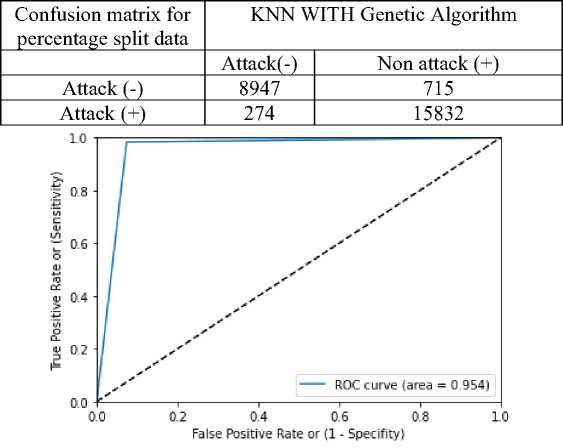
Table 23 denoted the confusion matrix and figure 15 represented the ROC for KNN with genetic algorithm respectively. Value of ROC obtained in the figure 15 is 0.954. The accuracy rate attained by KNN with genetic algorithm is 0.961619, precision is 0.96, Recall is 0.96 and F1 score of 0.96 is illustrated in table 24.
Table 23 confusion matrix of KNN WITH Genetic Algorithm
я
-
Figure 15 ROC curve of KNN WITH Genetic Algorithm
Table 24 performance metrics of KNN WITH Genetic Algorithm
|
Rate of accuracy |
Value of precision |
Recall rate |
Value of F1 Score |
|
0.961619 |
0.96 |
0.96 |
0.96 |
COMPARATIVE ANALYSIS
Accuracy rate of different models are compared in the table 25. The dataset used to compare these models is UNSW-NB15 dataset. The table shows that proposed model performed better than the existing models. The accuracy obtained by DBN is 82, CDBN is 82.29, existing model is 86.49 and finally the proposed model outperformed the existing models in terms of accuracy by obtaining accuracy rate of 99%. Graphical representation of the comparison is illustrated in the figure 16.
Table 25. Comparison Table [25]
|
UNSW-NB15 dataset |
|
|
Model |
Accuracy |
|
I-GA |
85.99% |
|
DBN |
82% |
|
CDBN |
82.29% |
|
Existing model |
86.49% |
|
Proposed model |
99% |
Accuracy

I-GA DBN CDBN Existing Proposed model model
Models
-
Figure 16 Comparison Graph with existing and proposed model
It is very important to detect the anomalies as soon as possible since these anomalies can cause various problems in the network system. These attacks have the potential to ruin the safety and security of the network. Hence detection of the anomalies are crucial, therefore proposed study has introduced modified linearity based grey swarm algorithm for feature selection as it reduces the convergence rate and reduce the repetition in order to maintain the linearity. In addition to feature selection, hyperparameter optimization has also introduced in the proposed methodology which provides the ability of the model to perform well. Finally, the results shows hyperparameter optimization techniques with different classifiers at last proposed method is compared with existing methods.
Overall results states that, KNN obtained highest accuracy rate of 0.973494 for grid search, random forest obtained highest accuracy rate of 0.99 for randomized search again random forest obtained highest accuracy rate of 0.998 for genetic algorithm. Highest ROC curve value is obtained by random forest with genetic algorithm with a value of 0.998. Finally, the proposed model is compared with the other models, from which, it was identified that proposed model outperformed the existing model by gaining accuracy rate of 99%.
CONCLUSION
The main objective of the proposed study is to detect and identify the type of anomaly present in the network. Therefore proposed methodology implemented modified linearity based grey swarm algorithm and hyperparameter optimization techniques. Hyperparameter techniques implemented were Genetic algorithm, Randomized search and grid search. These parameters helped in yielding an optimal model and helped in minimizing the pre-defined loss of data. Modified linearity based grey swarm algorithm and hyperparameter optimization techniques reduced the convergence rate and also helped in reducing the repetition that occurred in the model. Finally, results of various classifiers with hyperparameter optimization techniques were implemented in which highest accuracy for grid search was obtained by KNN 0.973494, for randomized search obtained was 0.99 by random forest and for genetic algorithm value obtained was 0.998 by random forest. From comparative analysis, it was demonstrated that, proposed model was obtained accuracy rate of 99% when compared with other existing model. This study may assist security professionals to safe guard the information from unauthorized access. In future, hyperparameter optimizations techniques or feature selection methods can be replaced with robust algorithms which helps in avoiding inevitable threats.
References Anomaly detection using modified linearity based grey swarm optimization algorithm and efficient hyper parameter optimization techniques
- R. Alanazi and A. Aljuhani, "Anomaly detection for industrial internet of things cyberattacks," Computer Systems Science and Engineering, vol. 44, pp. 2361-2378, 2023.
- T. A. Ahanger, A. Aljumah, and M. Atiquzzaman, "State-of-the-art survey of artificial intelligent techniques for IoT security," Computer Networks, p. 108771, 2022.
- V. Rimmer, A. Nadeem, S. Verwer, D. Preuveneers, and W. Joosen, "Open-World Network Intrusion Detection," in Security and Artificial Intelligence: A Crossdisciplinary Approach, ed: Springer, 2022, pp. 254-283.
- H. Albasheer, M. Md Siraj, A. Mubarakali, O. Elsier Tayfour, S. Salih, M. Hamdan, et al., "Cyber-attack prediction based on network intrusion detection systems for alert correlation techniques: a survey," Sensors, vol. 22, p. 1494, 2022.
- P. Spadaccino and F. Cuomo, "Intrusion detection systems for iot: opportunities and challenges offered by edge computing," arXiv preprint arXiv:2012.01174, 2020.
- A. Khraisat, I. Gondal, P. Vamplew, J. Kamruzzaman, and A. Alazab, "A novel ensemble of hybrid intrusion detection system for detecting internet of things attacks," Electronics, vol. 8, p. 1210, 2019.
- V. Hamolia, V. Melnyk, P. Zhezhnych, and A. Shilinh, "Intrusion detection in computer networks using latent space representation and machine learning," International Journal of Computing, vol. 19, pp. 442-448, 2020.
- S. Khonde and V. Ulagamuthalvi, "Ensemble-based semi-supervised learning approach for a distributed intrusion detection system," Journal of Cyber Security Technology, vol. 3, pp. 163-188, 2019.
- W. Song, W. Shen, L. Gao, and X. Li, "An early fault detection method of rotating machines based on unsupervised sequence segmentation convolutional neural network," IEEE Transactions on Instrumentation and Measurement, vol. 71, pp. 1-12, 2021.
- A. Abhaya and B. K. Patra, "An efficient method for autoencoder based outlier detection," Expert Systems with Applications, vol. 213, p. 118904, 2023.
- S. Bhatia, "Streaming Anomaly Detection," arXiv preprint arXiv:2301.13199, 2023.
- S. Sivanantham, V. Mohanraj, Y. Suresh, and J. Senthilkumar, "Association Rule Mining Frequent-Pattern-Based Intrusion Detection in Network," Computer Systems Science and Engineering, vol. 44, pp. 1617-1631, 2023.
- M. Douiba, S. Benkirane, A. Guezzaz, and M. Azrour, "An improved anomaly detection model for IoT security using decision tree and gradient boosting," The Journal of Supercomputing, vol. 79, pp. 3392-3411, 2023.
- S. K. Das, S. Samal, P. Ranjan, and S. P. Das, "An Efficient Data Mining Technique for an Intrusion Detection System in Network," in Constraint Decision-Making Systems in Engineering, ed: IGI Global, 2023, pp. 1-17.
- S. Mishra, R. Sagban, A. Yakoob, and N. Gandhi, "Swarm intelligence in anomaly detection systems: an overview," International Journal of Computers and Applications, vol. 43, pp. 109-118, 2021.
- S. Gadal, R. Mokhtar, M. Abdelhaq, R. Alsaqour, E. S. Ali, and R. Saeed, "Machine Learning-Based Anomaly Detection Using K-Mean Array and Sequential Minimal Optimization," Electronics, vol. 11, p. 2158, 2022.
- P. Lin, K. Ye, and C.-Z. Xu, "Dynamic Network Anomaly Detection System by Using Deep Learning Techniques," 2019.
- S. H. Park, H. J. Park, and Y.-J. Choi, "RNN-based prediction for network intrusion detection," in 2020 International Conference on Artificial Intelligence in Information and Communication (ICAIIC), 2020, pp. 572-574.
- M. Monshizadeh, V. Khatri, B. G. Atli, R. Kantola, and Z. Yan, "Performance evaluation of a combined anomaly detection platform," IEEE Access, vol. 7, pp. 100964-100978, 2019.
- M. Imran, S. Khan, H. Hlavacs, F. A. Khan, and S. Anwar, "Intrusion detection in networks using cuckoo search optimization," Soft Computing, vol. 26, pp. 10651-10663, 2022.
- A. H. S. Al-Safi, Z. I. R. Hani, and M. M. A. Zahra, "Using a hybrid algorithm and feature selection for network anomaly intrusion detection," J. Mech. Eng. Res. Dev, vol. 44, pp. 253-262, 2021.
- A. George, "Anomaly Detection based on Machine Learning: Dimensionality Reduction using PCA and Classification using SVM," International Journal of Computer Applications, vol. 975, p. 8887.
- A. Abusitta, G. H. de Carvalho, O. A. Wahab, T. Halabi, B. C. Fung, and S. Al Mamoori, "Deep learning-enabled anomaly detection for IoT systems," Internet of Things, vol. 21, p. 100656, 2023.
- M. Ragab and M. F. S. Sabir, "Outlier detection with optimal hybrid deep learning enabled intrusion detection system for ubiquitous and smart environment," Sustainable Energy Technologies and Assessments, vol. 52, p. 102311, 2022.
- Y. Zhang, P. Li, and X. Wang, "Intrusion detection for IoT based on improved genetic algorithm and deep belief network," IEEE Access, vol. 7, pp. 31711-31722, 2019.
