Anthropogenic impact on an area used as a landfill and possible methods to avoid the aquifer's pollution because of the Leachate

Author: Giambattista Piazzes
Journal: Антропогенная трансформация природной среды @atps-psu
Section: Техногенная трансформация природной среды. Влияние промышленности
Article in issue: 3, 2017.
Free access
In this report will be reconstructed the piezometry of an area interested by a landfill of Urban Solids Waste (USW) and will be treated the most common techniques to protect the soil and aquifers from the pollution of the waste leachate.
Landfill, waste
Short address: https://sciup.org/147229956
IDR: 147229956 | UDC: 5023/.7
Text of the scientific article Anthropogenic impact on an area used as a landfill and possible methods to avoid the aquifer's pollution because of the Leachate
Starting from the measurements of the piezometric levels of some observing-well, recorded in the area represented in Fig. 1 (located in Piedmont, North of Italy), reported in Table 1, we have rebuilt the piezometry, that is the lines at an equal piezometric head (also called “isopieze” in this paper) present in the area under examination, considered below tire landfill. The seven observing wells (piezometers) are indicated in Fig.l as Sx , where x can assume the integer values from 1 to 7. From Fig. 1, we can observe the water flow directions, indicated with blue arrows, the aquifer under consideration, which proceed from piezometric levels greater at lower piezometric levels, orthogonally to the isopieze. under tire effect of a hydraulic gradient. The gradient itself, was calculated using tire formula i = hl~h2 [1]. With hl is meant any higher piezometric level and h2 with any lower piezometric level. Considering two points with piezometric heads, respectively, hi and h2, it has been calculated also their mutual distance L. They were chosen in tire specific case h] = 255,95, h2 = 255,55 m and so their difference Ah = hr h2 is equal to 0.4 m. By calculating the distance between the two isopieze that turns out to be L = 140 in. applying the above formula, you get a hydraulic gradient i = 0.285 %. Following the topographic acronym (m s.l.m.) means “meters above sea level ". The piezometric height is defined as the difference between topographic height, and the depth to water table. It is necessary to define the expression of hydraulic conductivity of a porous medium. Tlirough the famous Darcy’s experiment, in the mid-nineteenth century the French engineer Henry Darcy quantified the flow tliat passes tlirough a given section in a given time, tlirough the following formula [2]:
Q = KA i
Where:
Q = flow flowing in the maximum section underlying the landfill |nr/s|
К = hydraulic conductivity [m/s]
A = maximum section underlying the landfill | nr]
i = hydraulic gradient calculated previously [-adimensionate parameter]
We have previously defined the Hydraulic gradient i. but we didn’t define the hydraulic conductivity K. It may be referred to as the coefficient of permeability:
Q L3/T
^ТГ^ПГ^
Where L = length
T = time
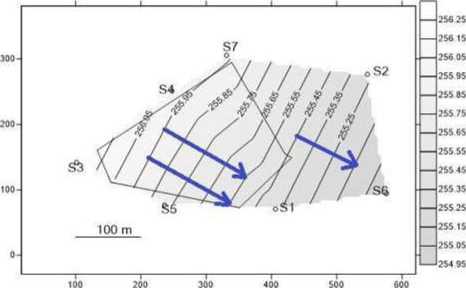

Figure 1 Reconstruction of the piezometry of the area in exam through the Surfer software
Darcy didn't address the fact that the value of К is a function of properties of both the porous medium and the fluid passing tlirough it. It is fairly intuitive that a viscous fluid (one which is thick). such as crude oil. will move at a slower rate than water, which is thinner and lias a lower viscosity. The hydraulic conductivity is directly proportional to the specific weight, g. of the fluid. The specific weight is the force exerted by gravity on a unit of volume of the fluid. Hydraulic conductivity is also inversely proportional to the dynamic viscosity of the fluid, p. which is a measure of the resistance of the fluid to the sharing that is necessary' for fluid flow. A proportionality expression for К can be written as:
у K = Kt-
The new constant Ki. is representative of the properties of the porous medium alone. It's termed the intrinsic permeability. This is basically a function of the size of openings through which the fluid moves.
Knowing that the conceptual model of the stratigraphy (Fig.2) is characterized by three sandy-gravelly levels having hydraulic conductivity respectively equal to k] = 4,2 10"3, k2 = 1,1 10"3 and k3 = 3.5 IO"3 m / s and thickness respectively equal to bi = 12 , b2 = 10 and b3 = 8 m. it calculates the equivalent horizontal hydraulic conductivity (with subscript h) and vertical (with subscript v) as shown in Fig.2. For the calculation of these quantities, the following formulas were used [2]:
^eq,h 6 ^i ^i^i ^^d ^eq,v b, where: b = b, + b2 + b3.
By applying these formulas to the case under examination, you arc obtained respectively the value of Keq. h = 3.14 • 10"3 m / s and the value of Keq. v = 2.31 • 10"’ m / s. As can be seen from Table. 2, the estimated hydraulic conductivity of the aquifer in question, substantially constituted by sand-gravel material, amounts within the range of variability of the hydraulic conductivity of the medium-coarse sand. Therefore, the results obtained are consistent with (he host geological formation of the ground w ater.
Table 1
Table on piezometric and topographical data collected in situ
|
Measurement point |
Topographical height |
depth to water table |
Piezometric height |
|
- |
m s.Lm. |
m |
m s.Lm |
|
SI |
278.17 |
22.80 |
255.37 |
|
S2 |
275.37 |
20.10 |
255.27 |
|
S3 |
280.66 |
24.41 |
256.25 |
|
S4 |
280.69 |
24.69 |
256 |
|
S5 |
278.4.3 |
22.65 |
255.78 |
|
S6 |
275.11 |
20.14 |
254.97 |
|
S7 |
280.55 |
24.58 |
255.97 |
|
b. |
ki |
|
ba |
к; ‘k. |
|
bj |
kj |
Figure 2 Stratigraphy of the area in exam
Table 2
Table covering the range of variability of the hydraulic conductivity К as a function of particle size
|
К [m/s] |
to i io-‘ io-2 to3 1о->ючо-<10-7 10 s IO-91O-io io» |
|||||||
|
Size of the grain |
Homogeneous |
Gravel |
Sand |
Very fine sand |
Silt |
Clay |
||
|
Various |
Medium and Large Gravel |
Gravel and Sand |
Sand Clay and Silt |
|||||
|
Permeability level |
High |
Low |
Absent |
|||||
|
Geological Formation |
Permeable |
Semi - permeable |
Impermeable |
|||||
Assuming as a wider section of the AA section shown in Fig. 3. whose estimated width from the piezometric map is about 256 in, and as the height of (he sum of (he three tliicknesses b (equal to 30 m), indicated in the previous page, on the basis Darcy’s law [1 ].
Q = К A i
Wliere:
Q = flow flowing in the maximum section underlying the landfill
К = Keq h calculated previously = 3,14 • IO"3 in / s
A = maximum section underlying the landfill equal to 256 x 30 = 7680 m2
i = hydraulic gradient calculated previously = 0.285 %
By applying the previous relation is obtained by a flow rate Q equal to 6,89T0"2 m’/s. If you divide following the speed V = ^ for the effective porosity of the host geological formation nc = 0.2 is obtained the effective speed of groundwater equal to Ve = — = 4.485 ne
-
■ 10 m/s.
Conclusions and possible methods to reduce the impact of the waste on the aquifer. It is important to note that because the surrounding area used as a landfill, and being constituted substantially from geological formations in the medium particle size - coarse and therefore feature good vertical hydraulic conductivity (of the order of I0"3 m / s as calculated previously), it is appropriate to waterproofing the bottom of the landfill itself as discussed following.
The two main factor that help the passage of the leacliate through the soil till the aquifer, are tltc rain water and the vertical hydraulic conductivity as we have seen. To reduce this impact we could design a landfill that contains the leacliate with a series of waterproof layers
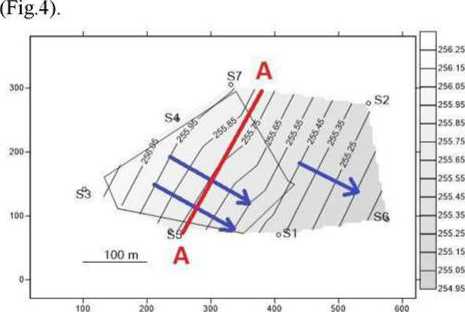

Figure 3 Location of the section in exam
Tlie insulation systems that prevent tlie leachate reaching the aquifer, van depending on whether it is hazardous waste landfills or not. Also (he geological and hydrogeological context is foundamental. The landfill, when finished filling with municipal solid waste, it must be covered otherwise the rainwater washes away the waste and leachate reaches tlie groundwater. The fermentation processes, are regulated by bacteria and generate biogas. If we are in the presence of oxygen.
aerobic fermentation takes place and produces Carbon
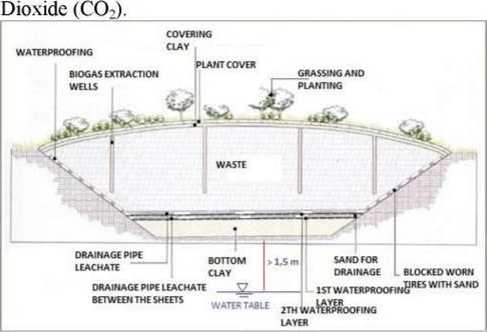
Figure 4 Scheme of a complete landfill
Instead, under anaerobic conditions, it produces Methane (CH4) in which more than 12% concentration can cause explosions. To be in safety conditions should be well below 8% methane (it’s ven' important to install pipes to extraction of generated gas). The main parts of tlie landfill shall be equipped with [3]:
CAPPING: It constitutes a casing from which it is possible to extract the leachate produced from waste and does not allow the leaching and must be the seat of the "vegetation recover) " (grassing and planting) in order to impact as little as possible on the environment also visually.
EXTRACTION WELL: to catch biogas produced from waste.
MINIMUM DISTANCE FROM UNDERGROUND WATER: between the bottom of the landfill and the top of underground water table must be at least 1.5 meters.
LATERAL SLOPE: to achieve the geoteclinical stability of the banks, the inclination angle of the banks should be lower than 22-23°.
Tlie most important part of a waterproofing design of a landfill, is the bottom. In the following Fig.5 we can observe the final result after the complete filling of the landfill and in the Fig.6 is shown a focus on the correct tecluiical to realise the capping of a landfill.
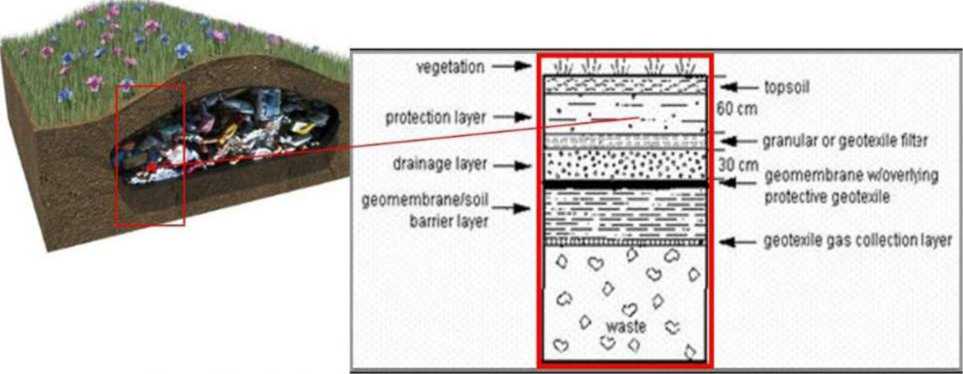
Figure 5 Result of a grassed landfill, Scheme of a correct landfill’s capping
■» МММ nwn
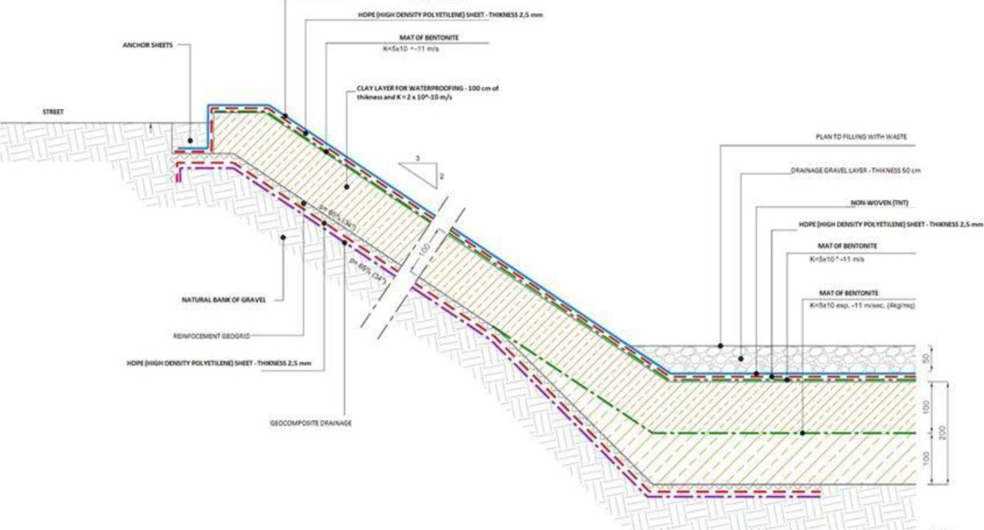
Figure 7 Example of scheme of a complete landfill’s bottom
The Fig.7. instead show as could be realised the waterproofing of the landfill"s bottom. The clay’s layer for waterproofing on the bottom lias a minimum thickness of 1 meter and maximum hydraulic conductivity of 2- 10"Ul m/s. On this layer is positioned a bentonite’s layer and on this is positioned a sheet of HOPE (High Density Polyethylene sheet). On the HDPE s sheet traditionally it's filled of drainage gravel to allow the leachate flow in the appropriate collection channels (thickness of gravel's layer must be at least 50 cm) and on this layer can be positioned the waste.
References Anthropogenic impact on an area used as a landfill and possible methods to avoid the aquifer's pollution because of the Leachate
- Ingegneria Degli Acquiferi, Sethi-Di Molfetta, Springer, Milano 2012 - 415 pp
- Applied Hydrogeology, C.W. Fetter, CBS, New Dehli 2007 - 591 pp
- Didactic material of course of "Improvement technology for rocks and land", Politecnico di Torino, 2016.
- Бузмаков С.А., Воронов Г.А. Основные подходы в определении качества окружающей среды // Известия Самарского научного центра Российской академии наук. 2016. Т. 18. № 2-2. С. 587-590.
