Anthropogenic transformation of forest ecosystems by geochemical and photosynthetic parameters

Author: Andreev Dmitrii N., Buzmakov Sergei A.
Journal: Антропогенная трансформация природной среды @atps-psu
Section: Трансформация природной среды
Article in issue: 2 т.7, 2021.
Free access
Geochemical and physiological indices gained at the background area and at the area under anthropogenic impact were compared. The study sites comprise 30 sample areas each. Overall, 600 samples of pine needles were designated for the delayed chlorophyll fluorescence measurement as well as 60 samples of soil and pine needle correspondingly were selected to perform the geochemical analysis. The biological uptake of the pine urban ecosystems is represented in the range: Mn (10,16) > P (7,19) > Ag (2,78) > Ba (2,76) > Cu (2,31) > Sr (1,85) > Ni (1,80) > Zn (1,75) > Pb (0,86) > Co (0,48) > Cr (0,40) > Zr (0,37) > V (0,36) > Ga (0,33) > Ti (0,21). In comparison with the background site data the biological uptake is increased in regard to V, Ti, Ni, Cu, Cr. The methodology implies the method of recording the relative index of delayed fluorescence with the help of fluorimeter “Photon 10”. The data accumulated in the course of the geochemical analysis allowed to distinguish common geochemical features of the study sites and revealed differences in soil and needle qualities. The value of relative index of delayed fluorescence (RIDF) under the impact of considerable anthropogenic impact is lower by 25% and more related to the background site. This deviation testifies that the human impact is present even on the early stage of ecosystem degradation.
Forest ecosystems, anthropogenic influence, delayed fluorescence, geochemical indices, stage of degradation
Short address: https://sciup.org/147236809
IDR: 147236809 | UDC: 577.355 | DOI: 10.17071/2410-8553-2021-2-49-57
Антропогенная трансформация лесных экосистем по геохимическим и фотосинтетическим параметрам
Сравнивались геохимические и физиологические показатели, полученные на фоновой территории и на территории, подвергающейся антропогенной нагрузке. Исследуемые участки состоят из 30 пробных площадок каждый. В целом, для измерения флуоресценции замедленного хлорофилла было отобрано 600 образцов сосновой хвои, а также 60 образцов почвы и сосновой хвои соответственно для проведения геохимического анализа. Биологическое поглощение ресурсов городских экосистем представлено в ряде: Mn (10,16) > P (7,19) > Ag (2,78) > Ba (2,76) > Cu (2,31) > Sr (1,85) > Ni (1,80) > Zn (1,75) > Pb (0,86) > Co (0,48) > Cr (0,40) > Zr (0,37) > V (0,36) > Ga (0,33) > Ti (0,21). По сравнению с данными фонового участка биологическое поглощение увеличивается в отношении V, Ti, Ni, Cu, Cr. Методика подразумевает метод регистрации относительного показателя замедленной флуоресценции с помощью флуориметра “Photon 10”. Данные, накопленные в ходе геохимического анализа, позволили выделить общие геохимические особенности исследуемых участков и выявить различия в качестве почвы и хвои. Значение относительного индекса замедленной флуоресценции (RIDF) под воздействием значительного антропогенного воздействия ниже на 25% и более по отношению к фоновому участку. Это отклонение свидетельствует о том, что антропогенное воздействие присутствует даже на ранней стадии деградации экосистем.
Text of the scientific article Anthropogenic transformation of forest ecosystems by geochemical and photosynthetic parameters
Nowadays the anthropogenic impact on the environment has reached its critical level due to the highly developed industrial production. Large quantities of pollutants are emitted into the urban air basins on a daily basis and their cumulative effect is hard to forecast and inhibit. The qualitative characteristics of the atmospheric air exert a direct influence on health and reproductive potential of the population, expenses for healthcare, etc.
Ecosystems degraded as a result of anthropogenic activity represent an urgent issue which is especially aggravated in urban areas exposed to integrated environmental effects [9]. Atmosphere contamination is caused by transport and plants/factories emissions, which are regarded as the major factors of modern anthropogenic transformation affecting urban forest ecosystems [16,]. Anthropogenic impact results in the alteration of the initial geochemical system [12]. It is known that technogenesis leads to gradual changes of average concentrations of elements in soil. The ecological situation of ecosystems is adequately estimated on the basis of geochemical features of soil and vegetation condition [1].
The major indicator of sustainable development is eventually the quality of the habitat. Environmental quality indices are specified by a wide range of ecological indicators, the majority of which are represented by biological ones [10; 13].
Bioindication is a detection and determination of ecologically significant natural and anthropogenic impacts in terms of the reactions to them of living forms in their immediate habitat. Biological indicators possess the features, proper for a system or a process, on the basis of which such issues as qualitative or quantitative assessment of trends, determination or evaluative classification of ecological systems conditions, processes and events are accomplished [8].
Accumulation and circulation of pollutants in various land ecosystems differ enormously due to the fact that contaminating elements act differently in various environmental conditions. Ecological monitoring should be held separately for every ecosystem (forest), for every element and type of an indicator plant [6]. Ecosystems of pine forests can serve as an example since. The Pinus sylvestris intercepts the major portion of atmospheric trace elements in forest ecosystems of the north hemisphere [24]. Special methods of sampling were elaborated for the Pinus sylvestris and other species and considerable data were received concerning the concentration of chemical elements in their needle [7; 17; 18].
At present there is a variety of methods for the indication of anthropogenic transformation of environment; however, the majority of them are unable to detect early stress responses of an ecosystem [14]. The most significant information is about the impact of chemical elements concentration in the ecosystem on biological objects [20].
Methods aimed at measuring parameters of photosynthetic apparatus of plants have been extensively exploited in ecological studies [22]. One of these methods implies detecting different parameters of chlorophyll fluorescence in a variety of plants (chloroplasts, water plants, needle and leaves of plants, lichens) [4; 21].
Materials and methods
Geochemical and physiological indices gained at the background area (protected area (PA) “Osinskaya lesna-ya dacha”) as well as the area under anthropogenic impact (PA “Chernyaevsky les”) were compared.
Protected area “Chernyaevsky les” (685,97 ha area) represents a forest area of local significance which is situated near the centre of the city Perm and surrounded by residential areas. Protected area of regional relevance “Osinskaya lesnaya dacha” (12 168 ha area) situated as far as almost 100 km to the south-west of Perm city was chosen as a background study site.
Pine types of forest located in the study sites and belonging to the green moss group were preliminarily selected for the experiment, further they were field-specified. The study sites comprise 30 sample areas (then – SA) each. Overall, 600 samples of pine needle were designated for the delayed chlorophyll fluorescence measurement as well as 60 samples of soil and pine needle correspondingly were selected to perform the geochemical analysis.
The geochemical sampling of soil and pine needle was accomplished according to the standard practice and environmental regulations [2,19].
Soil was sampled according to the method of “envelope” by mixing increment samples into a composite sample. The samples were extracted at the depth of 0– 20 cm (excluding forest litter) whereas the weight of a composite sample amounted to not less than 1 kilogram. Sampling was performed with auger Edelman. Needle samples were gathered from the south facing Pinus syl-vestris undergrowth at the height of 1.3 m subsequently, and then they were mixed. The selected branches were freed from year-long needle.
The soil samples were dried and representative extracts were selected for the analysis. The portions underwent sifting through a soil sieve (1,0 mm) followed by grinding in an agate mortar. Biogeochemical sample points such as needle and wood cores were dried and then combusted in a laboratory.
The prepared samples were put into a special laboratory for the measurement of their microelements concentration. The atomic absorption analysis was conducted with the diffraction spectrograph STE-1 using the method of evaporation from the crater. Every sample was scrutinized for the concentration of 34 chemical elements: Ni, Co, Cr, Mn, V, Ti, Sc, P, Ge, Cu, Zn, Pb, Ag, As, Sb, Bi, Mo, Ba, Sr, W, Sn, Be, Zr, Ga, Y, Yb, Nb, Li, Tl, Ce, Ta, In, Au, Hg.
All manipulations with the compiled data were done in Microsoft Excel office software. For the elements with the concentration exceeding 70 % the partition law was determined, background and anomalous content values as well as sampling variance and average quadratic deviation which serve to measure dispersion related to the average concentration value were performed in every representative extract.
The results of the analysis allowed to determine the following indicators: indicator of a chemical element concentration [15], cumulative indicator of contamination (Zc) [19], indicators of absolute (IAA) and relative accumulation (IRA) and indicator of biological uptake [2].
During the investigations of soils in the study area of 1 km2 the difference was determined between the background content before the start of these processes and after their completion: IAA = C1 – C2. If after the end of the processes the content decreased (i.e. the loss of elements occurred), the IAA value was negative [2].
The determination of the average density of soils allowed to assume after accounts that the increase (decrease) in the concentration of chemical elements in soils by an amount equal to 1 * 10-3 %, within the upper 30 cm layer corresponds to an increase (decrease) of their weight by 6 tons on an area of 1 km2.
IRA value was estimated the following way [2]:
IRA=IAA/C1
The research in question applies the method of recording the relative index of delayed fluorescence
(RIDF). The phenomenon of delayed fluorescence is characterized by a light excitation in photosynthesizing cells followed by a subtle and continuously fading emittance produced by chlorophyll [22]. This emittance results from the elimination of the quick fluorescence due to the energy released during light-independent reactions of initial photosynthetic products in reactive centers [14].
Among the forest forming species, Pinus sylvestris is one of the most widely spread indicator species [15]. Pinus sylvestris is distinctive of high sensitivity to increased concentrations of toxic substances in environment.
The methodology of identifying the level of environmental pollution according to photosynthetic indices of vegetation on the basis of pine ecosystem surveys was developed by the Department of biogeocenology and environmental protection in Perm State University [14]. This methodology allows to perform researches aimed at determination of physiological conditions of vegetation in differently polluted areas of atmospheric air.
The methodology implies the method of recording the relative index of delayed fluorescence with the help of fluorimeter “Photon 10” (fig. 1 / рис. 1). The measurement of a sample’s emittance is designed for two previously set light and time regimes, conventionally named as «high light mode» and «low light mode» [14].
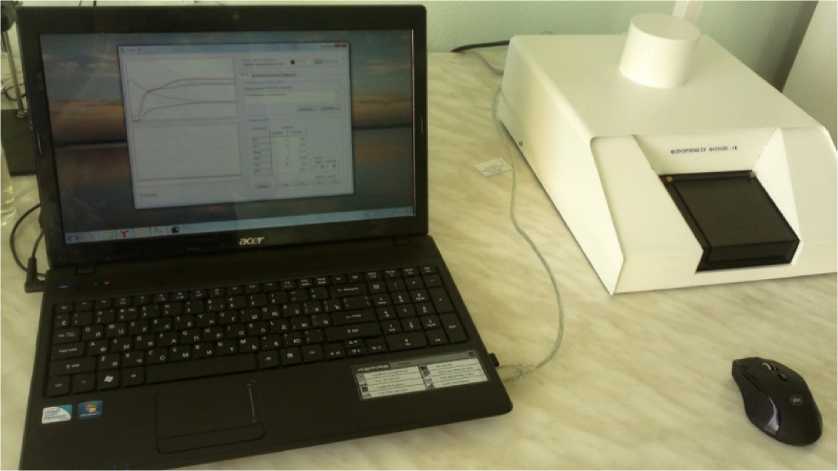
Fig. 1. Fluorimeter «Photon 10»
Рис. 1. Флуориметр «Фотон 10»
The methodology in question consists of the following units:
-
• The specifics of sample selection for analysis.
-
• The specifics of sample analysis with the help of “Photon 10”.
-
• “Photon 10” adjustment when dealing with pine needle.
-
• Interpretation of measurement results.
The rate of photosynthesis is correlated with a plenty of different natural factors such as temperature and air humidity, time of day and others [23]. Consequently, for further objective interpretation of data, received with the help of fluorimeter “Photon 10” in 2011, studies are de- signed for the elaboration of the bioindication concept of air pollution. Indices of chlorophyll fluorescence of pine needle foliage were recorded at the identical study sites; however, a different methodology of sample selection was conducted. Beyond that it is recommended to perform 24-hour measurement with the interval of 1 hour.
Results and discussion
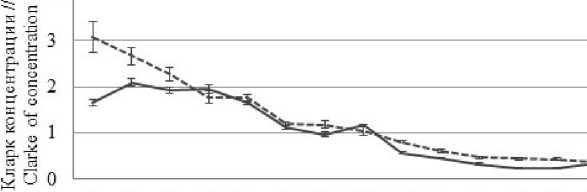
The data accumulated in the course of the geochemical analysis allowed to distinguish common geochemical features of the study sites (table 1 / таблица 1; fig. 2, 3 / рис. 2, 3). Concentration of Zn, Cu, P, Co in the soil nearly doubles the Clarke number characteristic for the world soils [25]. Concentration of Ni within the Clarke number is indistinctive for the soils with light mechanical composition. Relatively low concentration was detected for a number of elements such as Ti, Cr, Sc, Zr, Ba, Ga,
Sr, Y and Sn. Ga and Mn concentrations exceed the Clarke number [11] in the pine needle. Low concentrations of such elements as V, Cr, Ba, Ti, Pb, Co, Zn, Cu [3] were identified.
Table 1
Concentrations of microelements in pine forest ecosystems
Pb Zn Си P Co V Mn Ni Ti Cr Sc Zr Ba Ga Sr Y Sn
Таблица 1
Содержание микроэлементов в сосновых экосистемах
|
Территория // Study area |
Содержание микроэлементов, мг/кг // Concentrations of microelements, mg/kg |
||||||||||||
|
Ni |
Co |
Cr |
Mn |
V |
Ti |
P |
Cu |
Zn |
Pb |
Ag |
Ba |
Zr |
|
|
Почва // Soil |
|||||||||||||
|
Черняевский лес // Chernyaevsky les |
41,6 |
14,0 |
122 |
1010 |
120 |
3725 |
1417 |
45,5 |
133 |
30,7 |
0,16 |
218 |
132 |
|
Погрешность // Error |
4,1 |
0,7 |
8 |
79 |
4 |
123 |
107 |
2,8 |
10 |
3,4 |
0,02 |
15 |
7 |
|
Осинская лесная дача // Osinskaya lesnaya dacha |
46,6 |
13,3 |
91 |
818 |
112 |
2629 |
1568 |
38,4 |
105 |
16,5 |
0,08 |
119 |
69 |
|
Погрешность // Error |
1,1 |
0,3 |
3 |
44 |
4 |
116 |
72 |
1,5 |
4 |
0,6 |
0,001 |
5 |
4 |
|
Кларк // Clarke [25] |
40 |
8 |
200 |
850 |
100 |
4600 |
800 |
20 |
50 |
10 |
– |
500 |
300 |
|
Фон подзолистой зоны // Background of podzolic zone [1] |
32,2 |
8,4 |
180 |
715 |
63,5 |
4045 |
400 |
15,3 |
41,3 |
11,5 |
0,1 |
– |
– |
|
Хвоя // Needle |
|||||||||||||
|
Черняевский лес // Chernyaevsky les |
1,9 |
0,2 |
1,2 |
266 |
1,1 |
20,2 |
264 |
2,7 |
6,0 |
0,7 |
0,01 |
15,6 |
1,3 |
|
Погрешность // Error |
0,1 |
0,02 |
0,8 |
13 |
0,1 |
3,3 |
8 |
0,3 |
0,5 |
0,07 |
0,001 |
1,1 |
0,1 |
|
Осинская лесная дача // Osinskaya lesnaya dacha |
1,4 |
0,1 |
0,6 |
257 |
0,6 |
7,9 |
254 |
1,5 |
6,8 |
0,6 |
0,01 |
13,0 |
1,0 |
|
Погрешность // Error |
0,1 |
0,01 |
0,4 |
7 |
0,1 |
0,9 |
8 |
0,1 |
0,7 |
0,07 |
0,001 |
1,2 |
0,05 |
|
Кларк // Clarke [11] |
2 |
0,5 |
1,8 |
205 |
1,5 |
32,5 |
- |
8 |
30 |
1,25 |
0,6 |
22,5 |
7,5 |
-----Черняевский лес ----Осинская лесная дача Chernyaevsky les Osinskaya lesnaya dacha
Fig. 2. Clarke numbers of microelements in soil
Рис. 2. Кларки концентраций элементов в почве
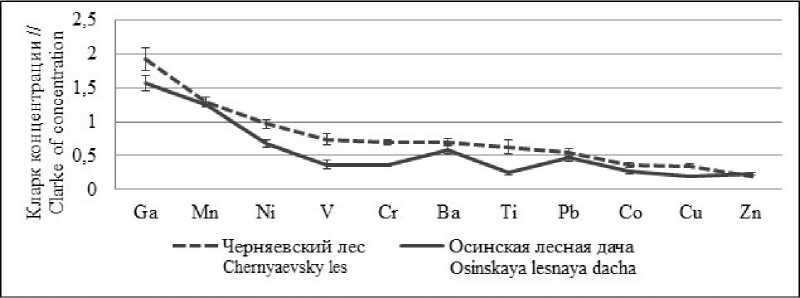
Fig. 3. Clarke numbers of microelements in needle of Pinus sylvestris Рис. 3. Кларки концентраций элементов в хвое Pinus sylvestris
The results obtained through the geochemical studies revealed differences in soil and needle qualities in “Chernyaevsky les” and “Osinskaya lesnaya dacha”. Soils of light mechanical composition in “Chernyaevsky les” contain an increased concentration of some microelements. The most considerable discrepancies are found in concentrations of Pb, Ag, Zr, Ba, Sn, Sc, Ti, Cr, Zn.
Great accumulations of Ti, V, Cr, Cu, Ni, Co, Zr, Ga were established in the pine needle in “Chernyaevsky les” related to the contents determined in the background study site.
The cumulative estimation of the soil contamination [19] in “Chernyaevsky les” revealed a dangerous level of pollution at two sample areas and a relatively dangerous level at eight areas (fig. 4 / рис. 4). By contrast, the level of soil contamination determined at all the sample areas in background study site “Osinskaya lesnaya dacha” is considered permissible.
The measurements of IAA, IRA and the indicator of biological uptake [2] were conducted to determine the geochemical properties of the study sites.
By contrast with the background study site, the soils in “Chernyaevsky les” are characterized by significantly higher contents of such elements as Ti (650 t/km²), Mn (115 t/km²), Cr (18 t/km²), Zn (17 t/km²). However, with the consideration of the background content Pb and Ag accumulations are more crucial (table 2 / таблица 2).
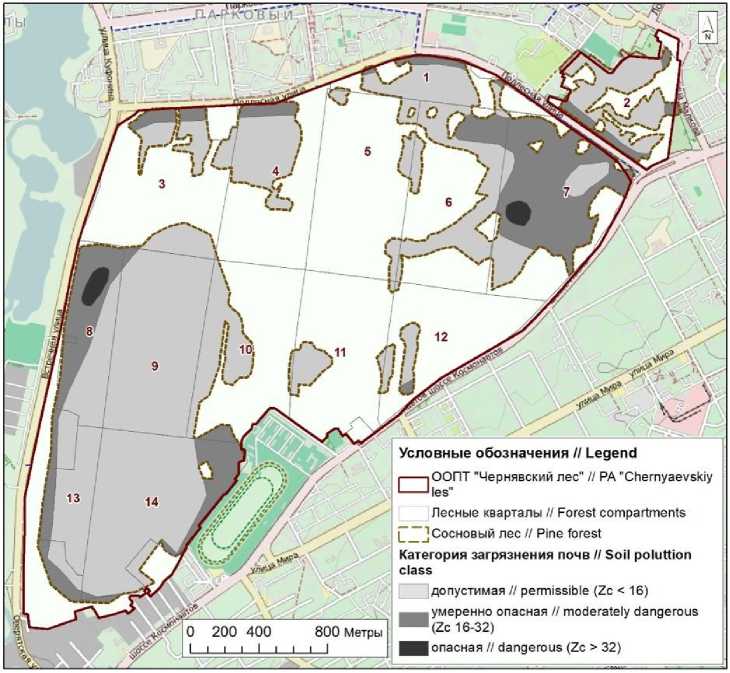
Fig. 4. Cumulative estimation of soil contamination in “Chernyaevsky les”
Рис. 4. Суммарный показатель загрязнения почв Черняевского леса
Table 2
Accumulation of microelements in soils of Chernyaevsky les
Таблица 2
Накопление микроэлементов в почвах Черняевского леса
|
Элемент // Element |
Cr |
Mn |
V |
Ti |
Cu |
Zn |
Pb |
Ag |
Sr |
Sn |
|
Показатель абсолютного накопления ПАН (т/км²) // Indicator of absolute accumulation IAA (t/km²) |
18,2 |
114,7 |
4,9 |
657,8 |
4,2 |
17,2 |
8,5 |
0,05 |
8,8 |
0,6 |
|
Показатель относительного накопления ПОН // Indicator of relative accumulation IRA (t/km²) |
0,20 |
0,14 |
0,04 |
0,25 |
0,11 |
0,16 |
0,52 |
0,60 |
0,09 |
0,32 |
The biological uptake distinctive of the pine ecosystems in “Chernyaevsky les” is in the range: Mn (10,16) > P (7,19) > Ag (2,78) > Ba (2,76) > Cu (2,31) > Sr (1,85) > Ni (1,80) > Zn (1,75) > Pb (0,86) > Co (0,48) > Cr (0,40) > Zr (0,37) > V (0,36) > Ga (0,33) > Ti (0,21).
Rows of these elements for the pine ecosystems of “Osinskaya lesnaya dacha” are as follows: Mn (12,11) > P (6,24) > Ag (4,82) > Ba (4,21) > Sr (3,78) > Zn (2,52) > Cu (1,49) > Pb (1,37) > Ni (1,12) > Zr (0,56) > Co (0,37) > Ga (0,29) > Cr (0,27) > V (0,19) > Ti (0,12).
The analysis of biological uptake rows allowed to reveal the substantial absorption of Mn, P, Ag, Ba, Cu, Sr, Zn, Ni by pine needle in both study sites.
The other elements are only seized as incoming elements are fixated and are able to be kept in soils thus blocking the way to plants. Also, concentrations of heavy metals in soil can be caused by protective mechanisms which monitor their appearance into an organism.
The index of biological uptake is increased with regard to V, Ti, Ni, Cu, Cr in “Chernyaevsky les”. It testifies that needle possesses high concentrations of these elements related to soil. The index of biological uptake is increased regarding Sr, Ag, Pb, Ba, Zn in “Osinskaya lesnaya dacha”. It can be primarily explained by lower concentrations of these elements in the soil of the background study site related to “Chernyaevsky les”.
Anthropogenic impact is observed in high concentrations of microelements in soil and in assimilation organs of vegetation in terms of geochemical influence. In pine ecosystems human activity leads to Pb and Zn accumulations in soil more than two times exceeding the Clarke number. Considerable impact exerted by anthropogenic factor can be extrapolated from the high concentrations of Cu, Mn, Ba, Sn, Zr and Ag.
Anthropogenic impact results in the remarkable increase of Ni, Cr, V, Ti, Cu and Ga concentrations in the needle of Pinus sylvestris .
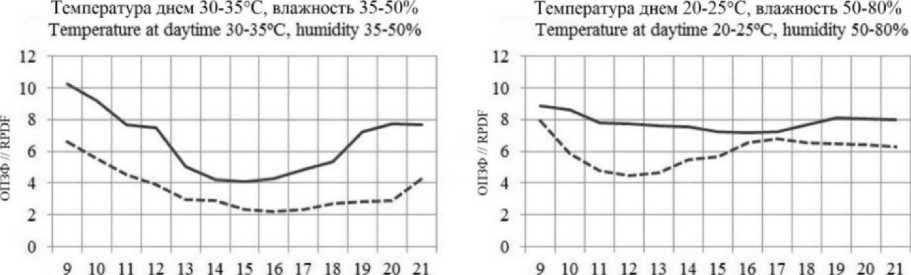
The performed experiments allowed to reveal that such factors as temperature and water humidity (fig. 5 / рис. 5), dark and water regimes of sampling, sampling point on a shoot, needle age as well as the phase of physiological activity are of importance.
During the daytime photosynthetic activity decay occurring at hot and dry weather RIDF is lowered to 2 and to 4 at the modelling sites in “Chernyaevsky les” and “Osinskaya lesnaya dacha” correspondingly. Morning and evening times are distinctive of some differences. At low temperatures and high humidity considerable variations are observed from 10 a.m. to 3 p.m.
Diurnal fluctuations of the chlorophyll fluorescence at study site “Osinskaya lesnaya dacha” are regarded as background data when assessing photosynthetiс activity of assimilation organs at study areas of both PA (table 3 / таблица 3).
Время суток // Time of the day Время суток // Time of the day
---Черняевский лес
Chernyayevsky Forest
Осинская лесная дача
Osinskaya lesnaya dacha
Fig. 5 Diurnal fluctuations of the delayed fluorescence relative index at different weather conditions Рис. 5. Дневное изменение относительного показателя флуоресценции хлорофилла при разных погодных условиях
Table 3
Values of relative index of chlorophyll fluorescence, background site shares
Таблица 3
Значения относительного показателя флуоресценции хлорофилла, доли фона
|
Черняевский лес // Chernyaevsky les |
Осинская лесная дача // Osinskaya lesnaya dacha |
||||||||||
|
№ ПП // № SA |
ОПЗФ // RIDF |
№ ПП // № SA |
ОПЗФ // RIDF |
№ ПП // № SA |
ОПЗФ // RIDF |
№ ПП // № SA |
ОПЗФ // RIDF |
№ ПП // № SA |
ОПЗФ // RIDF |
№ ПП // № SA |
ОПЗФ // RIDF |
|
1 |
0,90 |
11 |
1,03 |
21 |
0,77 |
1 |
1,19 |
11 |
1,15 |
21 |
0,85 |
|
2 |
0,94 |
12 |
1,02 |
22 |
0,98 |
2 |
1,35 |
12 |
1,12 |
22 |
0,83 |
|
3 |
0,60 |
13 |
0,63 |
23 |
0,76 |
3 |
1,25 |
13 |
0,93 |
23 |
0,54 |
|
4 |
0,65 |
14 |
0,74 |
24 |
0,92 |
4 |
1,30 |
14 |
0,89 |
24 |
1,00 |
|
5 |
0,59 |
15 |
0,52 |
25 |
0,89 |
5 |
0,98 |
15 |
0,98 |
25 |
0,89 |
|
6 |
0,44 |
16 |
0,76 |
26 |
0,82 |
6 |
1,20 |
16 |
0,97 |
26 |
0,72 |
|
7 |
0,57 |
17 |
0,79 |
27 |
0,84 |
7 |
0,97 |
17 |
0,48 |
27 |
0,87 |
|
8 |
0,57 |
18 |
0,66 |
28 |
0,89 |
8 |
1,02 |
18 |
0,49 |
28 |
0,80 |
|
9 |
0,64 |
19 |
0,75 |
29 |
0,64 |
9 |
0,91 |
19 |
0,63 |
29 |
0,86 |
|
10 |
0,92 |
20 |
0,70 |
30 |
0,61 |
10 |
0,82 |
20 |
0,69 |
30 |
0,78 |
|
Среднее ОПЗФ // Average RIDF |
0,75 ± 0,3 |
Среднее ОПЗФ // Average RIDF |
0,92 ± 0,4 |
||||||||
On average the value of RIDF at study areas in “Osinskaya lesnaya dacha” is lower by 8% (± 4%) from the background site. On average the value of RIDF at study areas in “Chernyaevsky les” is lower by 25% (± 3%) from the background site.
The value of RIDF under the impact of considerable anthropogenic impact is lower by 25 % and more related to the background site. This deviation testifies that the human impact is present even on the early stage of ecosystem degradation.
The delayed chlorophyll fluorescence is substantially decreased when assimilation organs of Pinus sylvestris undergo anthropogenic influence.
Conclusions
-
1. The developed methodology according to geochemical and physiological indices was applied in order to estimate the forest ecosystems conditions under the influence of anthropogenic impact. Comparative analysis of the background site and the urbanely exposed forest ecosystem elucidated the effects of geochemical and physiological changes in the Pinus sylvestris .
-
2. Increased concentrations of Pb, Ag, Zr, Ba, Sn, Sc, Ti, Cr, Zn lead to the appearance of technogenic geochemical fields in sand soils of urban forest ecosystems. Pinus sylvestris needle comprises remarkable amounts of Ti, V, Cr, Cu, Ni.
-
3. The background site is distinctive of the permissible level of pollution. The cumulative index of soil contamination demonstrates dangerous and relatively dangerous levels of pollution in the urban areas.
-
4. The measurement of IAA revealed the highest accumulations of such elements as Ti, Mn, Cr, Zn. However, with the consideration of the background content Pb and Ag accumulations are more crucial. Thus, IRA correlates with values of concentration index and gives additional data about soil pollution.
-
5. The biological uptake of the pine urban ecosystems is represented in the range: Mn (10,16) > P (7,19) > Ag (2,78) > Ba (2,76) > Cu (2,31) > Sr (1,85) > Ni (1,80) > Zn (1,75) > Pb (0,86) > Co (0,48) > Cr (0,40) > Zr (0,37) > V (0,36) > Ga (0,33) > Ti (0,21). In comparison with the background site data the biological uptake is increased in regard to V, Ti, Ni, Cu, Cr.
-
6. The value of RIDF under the impact of considerable anthropogenic impact is lower by 25% and more related to the background site. This deviation testifies that the human impact is present even on the early stage of ecosystem degradation (at the absence of morphological discrepancies).
-
7. The increased anthropogenic impact as a result of urbanization changes the quality of environment. Pine ecosystems are adversely affected. At an early stage of degradation such processes as accumulation of some elements in soil and needle in Pinus sylvestris , decreases in photosynthesis rate and productivity of woody plants occur.
Contribution of the authors:
-
D. N. Andreev – field work, desk data processing, preparation of the primary version of the manuscript, proofreading and correction of the final version of the publication.
S. A. Buzmakov – formulation of the general idea of the study; partial preparation of sections (Results, Discussion, Conclusions), proofreading and correction of the final version of the publication.
Сведения об авторском вкладе:
Д. Н. Андреев – полевые работы, камеральная обработка данных, подготовка первичного варианта рукописи, вычитка и корректировка финального варианта публикации.
-
С. А. Бузмаков – разработка общей идеи исследования; частичная подготовка разделов (Результаты, Обсуждение, Выводы), вычитка и корректировка финального варианта публикации.
References Anthropogenic transformation of forest ecosystems by geochemical and photosynthetic parameters
- Alekseenko, V., Buzmakov, S., Panin, M., 2013. Geokhimiya okruzhauschei sredy [Geochemistry of environment]. Perm, Perm State National Research University. 359 p. (in Russian)
- Alekseenko, V., Suvorinov, A. and Vlasova, E., 2008. Metally okruzhauschei sredy. Lesnye landshafty Severo-Zapadnogo Kavkaza [Metals in the environment. Forest landscapes of the North-West Caucuses]. Moscow, University book. 264 p. (in Russian)
- Andreev, D., 2012. Ecogeokhimixeskaya indi-katsiya antropogennoi transformatsii sosnovyh ecosistem [Ecogeochemical indication of anthropogenic transformation of pine ecosystems]. Russian journal of Earth Sciences. 10 (10), pp. 44-49 (in Russian)
- Andreev, D., 2013. Bioindikatsiya zagryazneniya vozdushnoi sredy po zamedlennoi fluorestsentsii khloro-filla sosny obyknovennoi [Bioindication of air pollution by delayed fluorescence of chlorophyll of Scots pine]. Esstestvennye nauki. 4(45), pp. 48-52 (in Russian)
- Angehrn-Bettinazzi, C., Thoni, L. and Hertz. J., 1989. Popytka otsenit nekotorye factory, vliyauschie na nakoplenie tyazhelyh metallov v drevostoe [An attempt to evaluate some factors affecting the heavy metal accumulation in a forest stand. International]. Zhurnal analit-icheskoi khimii okruzhauschei sredy. (35), pp. 69-79.
- Bergvist, B., Folkeson, L. and Berggren, D., 1989. Fluxes of Cu, Zn, Pb, Cd, Cr and Ni in temperate forest ecosystems. Water, Air, & Soil Pollution, 47, pp. 217-286.
- Berthelsen, B., Steinnes, E. and Solberg, W., 1995. Heavy metal concentrations in plants in relation to atmospheric heavy metal deposition. Journal of Environmental Quality, (24), pp. 1018-1026.
- Melehova, O., SarapuFtseva, E., 2010. Biolog-icheskii control" okruzhauschei sredy: bioindikatsiya i biotestirovanie [Biological control of the environment: Bioindication and bioassay]. Moscow, Izdatel'skiy tsentr «Akademiya», 288 p. (in Russian)
- Buzmakov, S., 2012. Antropogennaya transfor-matsiya prirodnoi sredy [Anthropogenic transformation of environment]. Geograficheskiy vestnik. 4(32), pp. 4650. (in Russian)
- Buzmakov, S., Ovesnov, S., Shepel, A., Zaytsev, A., 2011. Metodicheskie ukazaniya: «ekologicheskaya otsenka sostoyaniya prirodnoi sredy osobo ohranyaemyh prirodnyh territorii regionaFnogo znacheniya» [Methodical instructions «Environmental assessment of protected arias of regional importance»]. Geograficheskiy vestnik. (2), pp. 49-59. (in Russian)
- Dobrovolsky, V., 2003. Osnovy v biogeohimii [Introduction to biogeochemistry]. Moscow, Publ. centre «Academia». 400 p. (in Russian)
- Dziuba, E., Buzmakov, S. and Sivkov, D., 2021. Certificate of state registration of the database No. 2021620099 Russian Federation. Geoinformation database of geochemical properties of soils in the Perm Territory from 19.01.2021. Applicant: Perm State National Research University.
- Gatina, E., 2009. Antropogennaya transformatsi-ya botanicheskogo raznoobraziya na territorii Permskogo kraya [Anthropogenic transformation of botanical diversity in the Perm region]. Problemy regional'noy ekologii. (5), pp. 160-165. (in Russian)
- Grigor'ev, Yu., Andreev, D., 2012. K voprosu o metodike registratsii zamedlennoy fluorestsentsii hloro-filla pri bioindikatsii zagryazneniya vozdushnoi sredy na hvoinyh [About the technique of registration of the chlorophyll delayed fluorescence at bioindication of the air pollution on coniferous]. Estestvennye nauki. 2(39), pp. 36-39. (in Russian)
- Grigor'ev, Yu., 2005. Fluorestsentsiya hlorofilla v bioindikatsii zagryazneniya vozdushnoi sredy [Chlorophyll fluorescence in biological indication of air pollution]. Vestnik Mezhdunarodnoy akademii nauk ekologii i bezopasnosti zhiznedeyatel'nosti (MANEB). 10(4), pp. 77-91. (in Russian)
- Khaustova, A., Redina, M., 2021. Assessment of the pyrogenic pollution of the soil-plant system on the base of geochemical markers for a local model of transport pressure. Anthropogenic Transformation of Nature. 7(1), pp. 65-86. https://doi.org/10.17072/2410-8553-2021-1-65-86 (in Russian)
- Lichtenthaler, H., Rinderle, U., 1980. RoF flu-orestsentsii hlorofilla v vyavlenii stressovyh sostoyanii u rastenii [The role of chlorophyll fluorescence in the detection of stress conditions in plants]. C R C Critical Reviews in Analytical Chemistry, (19), pp. 529-585.
- Markert, B., 1990. Multi-element analysis in a forest ecosystem. Variations in chemical composition of trees and ground flora. Angewandte Botanik. (64), pp. 19-36.
- Methodical recommendations: MU 2.1.7.730-99. Hygenic assessment of soil quality in residential areas, 1999. Available from: https://docs.cntd.ru/document/1200003852 (in Russian)
- Pakharkova, N., Kalyakina, O., Shubin, A. and Grigoriev, Y. 2009. Fluorescent methods of assessment of winter dormancy conifers from city ecosystems with different levels of air pollution. Journal of Siberian Federal University. Chemistry, 2(4), pp. 359-367. (in Russian)
- Rubin, A., 2000. Biofizicheskie metody v ekolo-gicheskom monitoringe [Biophysical methods in environmental monitoring]. Sorosovskiy obrazovatel'nyy zhurnal. (4), pp. 7-13. (in Russian)
- Shubert, R., 1982. Vozmozhnosti primeneniya rastiteFnyh indikatorov v biologo-tekhnicheskoy sisteme kontrolya okruzhauschei prirodnoy sredy [Possible applications of plant bio-indicators in the technical system monitoring the environment]. Problemy fonovogo monitoringa sostoyaniya prirodnoy sredy. (1), pp. 104-111. (in Russian)
- Suvorova, G., 2008. Fotosintez khvoinykh der-ev'ev v usloviyakh Sibiri [Photosynthesis of needle foliage trees in Siberia]. Nauka, Novosibirsk. 222 p. (in Russian)
- Vilkka, L., Aula, I. and Nuorteva, P., 1990. Comparison of the levels of some metals in roots and needles of Pinus sylvestris in urban and rural environments at two times in the growing season. Annales Bo-tanici Fennici, (27), pp. 53-57.
- Vinogradov, A., 1957. Geokhimiya redkih i ras-seyannyh rhimicheskih elementov v pochvah [Geochemistry of rare and dispersed chemical elements in soils]. Moscow, AS USSR. 279 p. (in Russian)
