Application of geostatistical tools to assess geological uncertainty for Sinquyen Copper mine, Vietnam

Author: Mai Ngoc Luan, Bui Xuan Nam
Journal: Горные науки и технологии @gornye-nauki-tekhnologii
Section: Геология месторождений полезных ископаемых
Article in issue: 2, 2016.
Free access
Geostatistics-based estimators, i.e. ordinary kriging and simple kriging, are state-of-the-art estimation techniques widely used in the mining industry. However, the estimation result of kriging techniques is not able to cope with the well-known uncertainty of geological attributes in mineralization deposits. Moreover, the smoothing effect of kriging algorithms has led to over/under estimation in many circumstances. To overcome these drawbacks, the deterministic estimation result of kriging is usually followed by stochastic results provided by stochastic simulation. In this paper, the application of ordinary kriging and stochastic simulation are performed to build the resource model together with the uncertainty assessment of the Sinquyen copper mine.
Geostatistics, ordinary kriging, sequential gaussian simulation, ore resource estimation
Short address: https://sciup.org/140215864
IDR: 140215864
Text of the scientific article Application of geostatistical tools to assess geological uncertainty for Sinquyen Copper mine, Vietnam
In the modern mining industry, all mining projects are developed based under a block model in a three-dimensional space (hereafter called block model). The objective of block modeling is to intuitively represent the real but unknown geological conditions of the mineralization area. In the geological block model, each of the unit blocks contains geological attributes i.e., grades of different metals and minerals comprising the deposit, and their specific gravity, tonnage, and lithology. Once the geological block model is built, economic parameters such as mining and processing cost and commodity price will be applied to convert that geological block model into an economic block model, which forms the platform for the mine planning process. The source of information for the estimation process mainly comes from a limited number of exploratory boreholes, which is obviously not available at all blocks. The process that interpolates values of unsampled blocks from nearby boreholes is called ore resource estimation. Ore resource estimation is a complicated task in terms of algorithms, the large amount of data and computation cost.
To date, many estimation methods have been developed to tackle this challenge. One of the first approaches is to assign the value of the nearest sample point to an unknown point, called the nearest neighbor. The nearest neighbor methodology is illustrated in Fig. 1.
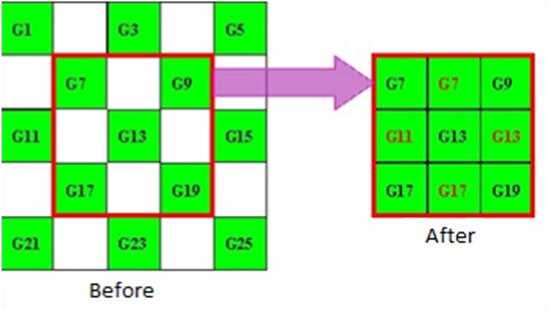
Fig. 1. Illustration of nearest neighbor method
Inverse distance is a more advanced interpolation technique, which is capable of considering the impact of distance between different sample points to the estimating point. The methodology of this approach based on the assumption that those points have the same distance to the unsampled point will have the same similarity. The similarity will decrease gradually as the distance increases. With this assumption, the weights of different sample points to the estimated point will be different, and only depend on the distance.
Due to the explicit interpolating mechanism, nearest neighbor and inverse distance are classified as deterministic methods. These methods are quite simple and easy to implement in terms of algorithm and computational intensity. The result is acceptable when the variation of dataset is not complicated or when the requirement of estimation quality is not too high, e.g. estimating attribute grades of waste blocks.
Danie Krige (1951), a mining engineer working in a gold mine in South Africa, suggested a new statistical estimation method where the gold content of blocks not only depends on the attribute inside but also the surrounding spatial information. This new idea was subsequently developed as a brand new scientific subject called geostatistics. The family of average estimation algorithms is named kriging, after the pioneering work of Danie Krige. In this approach, the spatial features of the survey area are quantified into a calculating equation, e.g., anisotropy, correlation between different variables, or spatial continuity. Kriging algorithms release estimate results with the smallest estimation variance constraint to an unbiased condition. Among the kriging algorithms, regular kriging is considered the most popular due to its simple application.
Generally speaking, the estimation methods, include kriging algorithms, aim to obtain a single “best” estimation result and they are not capable of accessing the associated uncertainty of the estimation. Dimitrakopoulos et al. (2002) proposed an application of stochastic simulation in resource estimation. Differing from kriging methods, the result of stochastic simulation is a series of probable possibilities (or realizations) that a mineral deposit may have; therefore, this technique can access the uncertainty associated with the resource estimation.
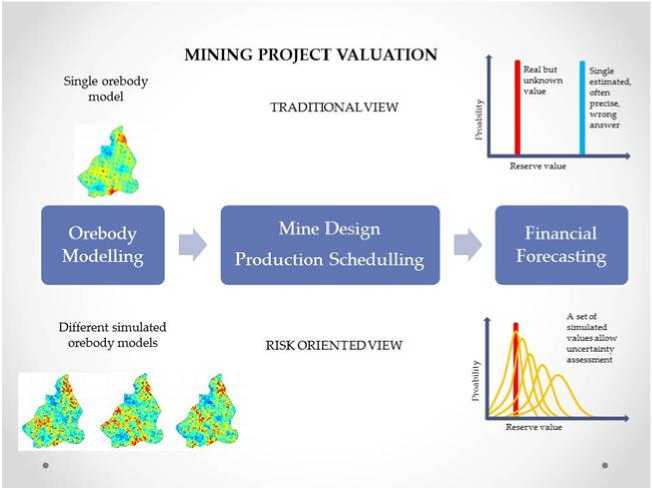
Fig. 2. Illustration of the application of estimation and simulation
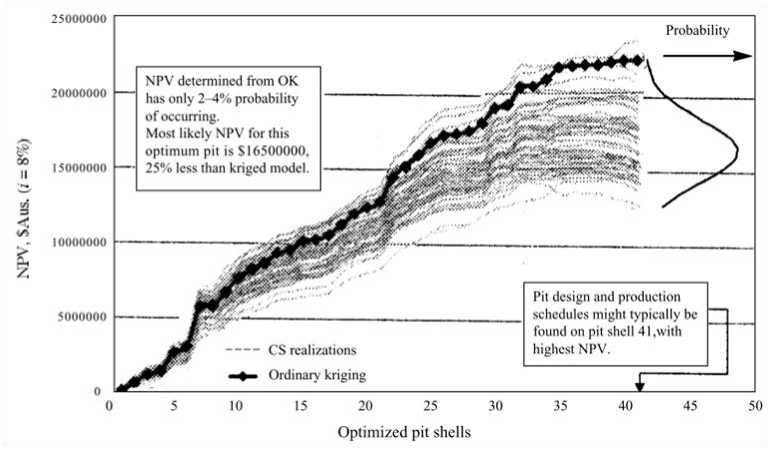
Fig. 3. Illustration of NPV distribution of a mining project
When it comes to mine planning, instead of using a single ore body model to release a unique project NPV as a traditional method, applying stochastic simulation will result in different schemes, from the most optimistic to the most pessimistic a mining project may experience. This new approach, so-called stochastic mine planning, has opened a new dimension for the mining industry. The differences of traditional and stochastic mine planning are illustrated in Fig. 2 and 3.
In this paper, the methodology of ordinary kriging (OK) and sequential Gaussian simulation (SGS) are reviewed in Section 2. Section 3 is devoted to a large-scale case study with results analysis and conclusions drawn in Section 4.
METHODOLOGY REVIEW
Ordinary Kriging
The general methodology of kriging interpolators is reviewed from the work of Goovaerts (1997).
Let’s define study area A with a dataset including n sample points:
Z ua , ос = 1,2,..., n , where Z is the continuous attribute that is being surveyed, such as metal content, mineral density, porosity ..., u is the location of the corresponding n sample point.
The problem is estimating the value of Z * u at any unsampled point belonging to A .
The estimating value at unsampled point u by kriging algorithm is defined as:
nu
Z* u -m u = ^Xa u ZZ ua -m ua ], (1)
a=1
where:
Z * u - Estimating value of unsampled point;
Z ua - Value of sample point a;
Xa u - Weight of sample point a to estimating unsampled point;
mu- Local arithmetic mean;
m ua - Arithmetic mean of study area.
Estimation error is defined as:
о E u = Var Z* u -Z u .
All kriging methods aim to minimize estimation error crj( u ) by setting the unbiased condition:
E Z* u -Z u =0: Expected value of estimated value and real value (average estimated value) is 0.
According to the equation (1), these parameters Zu , mu are constant, so the difference between kriging methods basically concerns the issue of how to define local arithmetic m(u) and weight u of sample points.
With ordinary kriging, this method is named “ordinary” because it is based on the assumption that local mean mu is constant and cannot be determined, and so can be removed from the equation. This makes the calculation very convenient to apply. This method even has the nickname “BLUE”: Best Linear Unbiased Estimator.
ry *
Zu
n ( u )
= 2^ OK (u) Z (u„ ) + a=1
n ( u )
1- L^OK ( u )
m ( u ),
where
Z* u - Estimating value of unsampled point;
Z ( u a) - Value of sample point a;
X O K ( u ) - Weight of sample point a by OK method;
m ( u ) - Local arithmetic mean.
Local mean m ( u ) is removed from the equation by the assumption that the sum of weights is 1:
n ( u )
«OK ( u ) = 1 .
Therefore:
n ( u )
Z * u =ухо°к ( u ) Z ( u a ) .
a=1
Sequential Gaussian simulation (SGS)
SGS is one of the simplest and most common geostatistical simulations which relies on the normal (Gaussian) distribution of input data to have a zero mean and unit variance (Deutsch & Journel, 1998). This feature provides an extremely analytical simplicity for simulation process. Normally, the distribution of most raw datasets on earth is not normal; therefore, a normal transformation needs to be implemented before simulation.
SGS is a sequential simulation approach, which means that the simulation procedure of a node is conditional on all neighboring data inside the search radius, including both original data and previously simulated nodes. A random path will be set to ensure that all nodes are simulated randomly and sequentially.
Steps of SGS:
-
1) Normal transformation of original data;
-
2) Draw a random path to visit every node;
-
3) Withdraw a random value to a node from a cumulative distribution function generated from data within the search radius, assign this value to that node as the simulated value;
-
4) Repeat step 3 until all nodes, except original nodes, have been simulated;
-
5) Back transform the simulated values into their original form;
-
6) Check the result: reproduce and check the histogram and variogram of realizations to target features.
Repeat step 2 to step 6 to generate other realizations.
CASE STUDY
In the case study, the OK and SGS were applied to the Sinquyen copper deposit in Vietnam. The block model consists of 802,944 blocks, of which 10,613 are ore blocks with block size of 25×25×25 m.
Geostatistical analysis showed that the deposit has the best spatial continuity direction from North East to South West with the anisotropic ratio of 1.823. The geostatistical analysis results are presented in Fig. 4, 5, 6, and 7.
This variogram model was applied to implement OK and 10 realizations of SGS on the Sinquyen copper mine. The grade-tonnage curves are presented in Fig. 8.
It is clear from the grade-tonnage curves that OK has underestimated the grade of copper. For instance, at cut-off 1 % Cu, the metal tonnage estimated by OK is 47 % while SGS ranges from 68 to 72 %. The average copper grade
Azimuth: α = 45o
Range: a = 41,53
Sill: C = 0,50
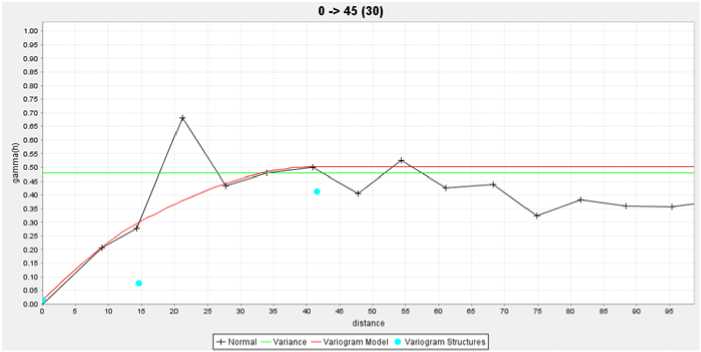
Fig. 4. Variogram model has the best spatial continuity
Azimuth: α = 135o
Range: a = 22,78
Sill: C = 0,50
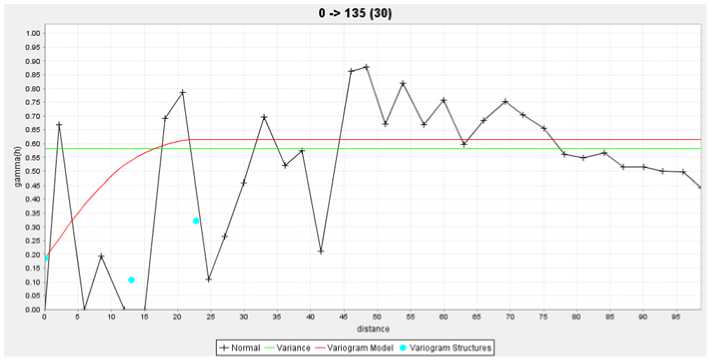
Fig. 5. Variogram model has the least spatial continuity
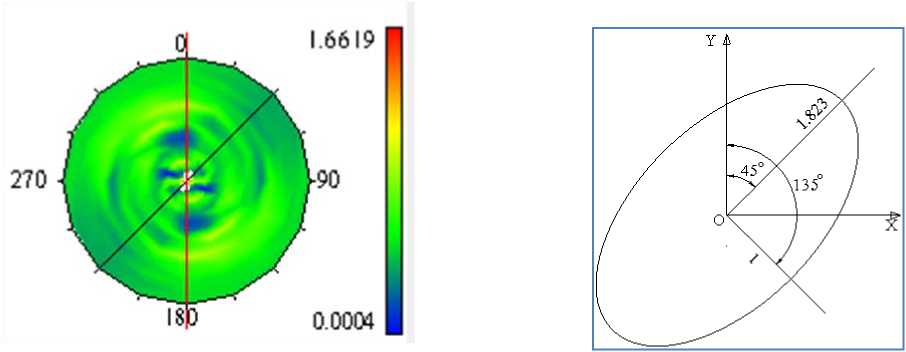
Fig. 7. Anisotropic ellipse
Fig. 6. Variogram map
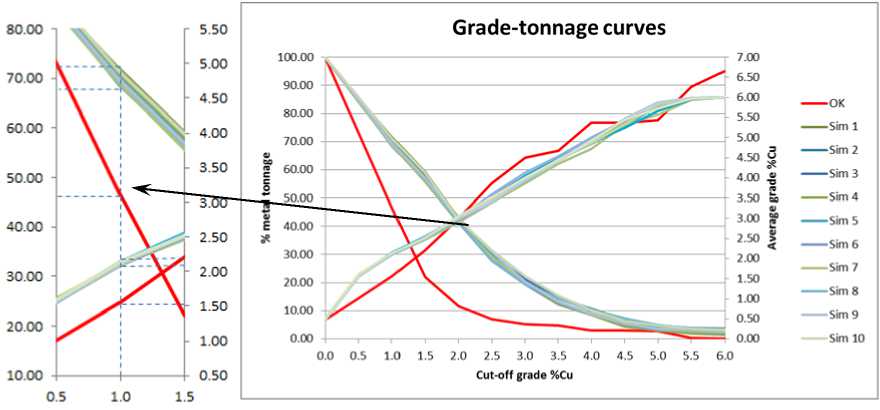
Fig. 8. Grade-tonnage curves of OK and SGS.
( Follow increasing trend of cut-off: Downward lines: tonnage curves, upward lines: grade curves )
estimated by OK with cut-off 1 % is 1.56 % and the result of SGS is from 2.1 to 2.2 %.
Another important conclusion from the stochastic simulation result is that the variability of simulation-based copper metal tonnage is around 4 %.
CONCLUSION
In this paper, ordinary kriging and sequential Gaussian simulation have been reviewed and applied at the Sinquyen copper deposit. The result shows that there is a high possibility that OK has underestimated the grade of copper. Moreover, the variability of copper metal in the deposit is 4%. This information is very helpful when performing the mine planning for this project.
In future, it would be interesting to incorporate the geological uncertainty generated by SGS into the mine planning process, so we can evaluate its impact on the project’s NPV.
References Application of geostatistical tools to assess geological uncertainty for Sinquyen Copper mine, Vietnam
- Deutsch, C.V., & Journel, A.G. (1998). Geostatistical software library and user’s guide (GSLIB).
- Dimitrakopoulos, R., Farrelly, C. & Godoy, M. (2002). Moving forward from traditional optimization: grade uncertainty and risk effects in open-pit design. Mining Technology, 111(1), 82-88.
- Goovaerts, P. (1997). Geostatistics for natural resources evaluation. Oxford University Press, New York, NY.
- Mai Ngoc Luan (2013). Research and application of geostatistical tools to model mineral deposits or surface mine planning and design. Master thesis, Hanoi University of Mining and Geology, Vietnam.
- Mai Ngoc Luan, Bui Hoang Bac, Bui Xuan Nam (2013). Geostatistical approach to ore reserves estimation and 3D geological map for mineral deposits in Vietnam. Vietnam Mining Industry Journal, Issue No. 2/2013.
