Application of Models based on Human Vision in Medical Image Processing: A Review Article

Author: Farzaneh Nikroorezaei, Somayeh Saraf Esmaili
Journal: International Journal of Image, Graphics and Signal Processing @ijigsp
Article in issue: 12 vol.11, 2019.
Free access
Nowadays by growing the number of available medical imaging data, there is a great demand towards computational systems for image processing which can help with the task of detection and diagnosis. Early detection of abnormalities using computational systems can help doctors to plan an effective treatment program for the patient. The main challenge of medical image processing is the automatic computerized detection of a region of interest. In recent years in order to improve the detection speed and increase the accuracy rate of ROI detection, different models based on the human vision system, have been introduced. In this paper, we have provided a brief description of recent works which mostly used visual models, in medical image processing and finally, a conclusion is drawn about open challenges and required research in this field.
Medical Image Processing, Region of Interest (ROI), Saliency Map, Visual Attention
Short address: https://sciup.org/15017055
IDR: 15017055 | DOI: 10.5815/ijigsp.2019.12.03
Text of the scientific article Application of Models based on Human Vision in Medical Image Processing: A Review Article
Published Online December 2019 in MECS
Medical imaging is the use of imaging modalities to get pictures of the human body, which can assist diagnosis and treatment. There are many different types of medical imaging techniques which use different technologies to produce images for different purposes. The simplest, earliest developed and frequently used form of medical imaging is by use of X-rays. The X-rays, which are a type of electromagnetic radiation pass through the body, the energy is absorbed by different parts of the body at different rates, and a detector on the other side will be able to generate an image by effectively comparing the absorption of tissues. Computed tomography (CT) is the technique of providing visualization of the body section. The CT has been applied to a variety of diagnostic applications, such as determining the extent of cancerous growth. Magnetic resonance imaging more commonly known as MRI scanners, use strong magnetic fields and radio waves to generate anatomical and functional images within the body. Another technique is positron emission tomography, or PET which is a nuclear medicine functional imaging system. The PET scanner can create a three-dimensional image of the inside of the body by computer analysis. They are used to detect the progress of cancer and can be used to get high resolution images of the brain. By improving the image acquisition modalities, several attempts have been made to develop systems to assist doctors and speed up medical image understanding. These systems are known as computer-aided diagnosis systems (CAD). The goal of a CAD system is to detect, segment and diagnose abnormalities in medical imaging data. Early detection of abnormalities using CAD systems can help doctors to plan an effective treatment program for the patient. To improve computer aided diagnosis algorithm, medical image perception has been widely studied to identify specialists’ behavior during visual examination. One way to model the behavior of specialist in automated image analysis is through visual saliency computation thus computationally visual attention has been widely investigated during the last two decades and different visual saliency models have been introduced to improve the performance of CAD systems. As shown in fig.1 human vision divided into two main processing pathways. Dorsal stream for eye movement and visual attention, and ventral stream which processes object and face details [1]. These two pathways are not completely independent and have interactions in higher levels.
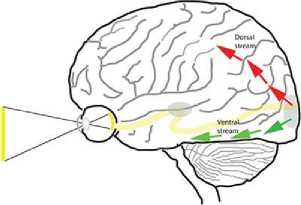
Fig.1. Dorsal and Ventral stream
The rest of this paper is organized as follow: section II presents the different models based on ventral stream in visual cortex and section III describes the models that based on dorsal stream. In section IV the related recent works that used these models in medical image processing are presented. Finally, the conclusion of the paper is introduced in section V.
-
II. Models based on Ventral Stream In Visual Cortex
One of the first studies on visual cortex neuron characteristics has been done by Hubel and Wiesel in 1962. Most of the models which presented after their work are somehow inspired from their work and tried to complete it. The other important ventral stream models which has been proposed and used as basis models are HMAX and VisNet.
-
A. Hubel and Wiesel
In their study, neurons of the primary visual cortex are interpreted into units that extract features of the image. They described the hierarchy of cells in primitive mammal visual cortex. Below this hierarchy, there are symmetric radial cells that respond to a small point of light. On the second level, there are simple cells that detect features such as changing in brightness and are sensitive to position and direction. On the next level of the hierarchy, complex cells are located which are selective to particular line direction. At the highest level, there are ultra combined cells, which are selective to length of line [2]. The structure of a simple cell and a complex cell proposed by this model is shown in fig.2.
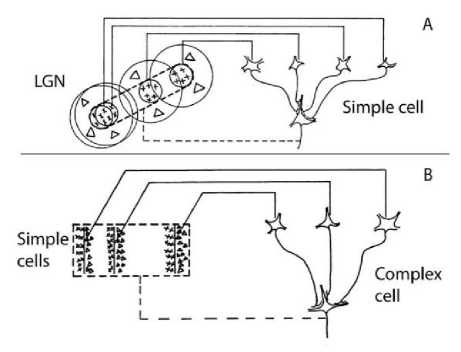
Fig.2. Structure of a simple cell (A) and complex cell (B) proposed by Hubel and Wiesel [2]
-
B. VisNet model
This model developed based on invariant object recognition in visual cortex. It has a hierarchy four-layer feed forward structure and also provides competition mechanism between neurons within each layer by use of lateral inhibitory connections. A trace learning rule was implemented by a consistent sequence of transforming objects [3]. The VisNet architecture is shown in fig.3.

Fig.3. VisNet four-layer network [3]
-
C. HMAX Model
This model is the most important and actually, the best model based on the ventral stream of the visual cortex. This model first proposed by Riesenhuber and Poggio in 1999. Their model had a hierarchical feed-forward architecture which could perform object recognition like the cognitive task done by the brain. The key element of this model was a set of position and scale invariance feature detectors. They used a nonlinear maximum operation (MAX) pooling mechanism which was capable of providing a more robust response of recognition in clutter cases [4]. Fig.4 provides a sketch of the model.
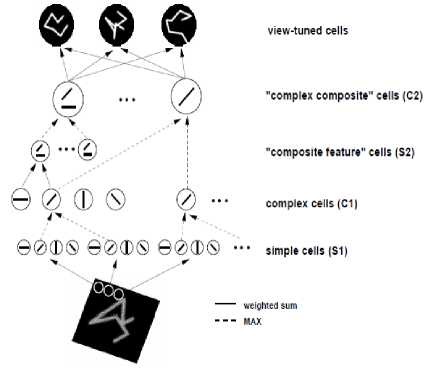
Fig.4. HMAX model [4]
-
III. Visual Attention Models Based On Dorsal Stream In Visual Cortex
Visual attention is the ability of the human vision system to detect salient parts of the scene, on which higher vision tasks, such as recognition can focus. Attention is usually categorized into two distinct functions: bottom-up attention and top-down attention. In the other words, the process of selecting and getting visual information can be based on saliency in the image itself (bottom-up) or on prior knowledge about scenes, objects and their interrelations (top-down) [5]. Koch and Ulman was the first bottom-up computational model, which can be totally implemented [6]. By developing this model, Itti saliency visual attention model was proposed which has been widely used in image processing applications. Graph-based visual saliency is one of the other important models that have been introduced in this field.
-
A. Koch and Ulman visual attention model
In this model, a number of elementary features, such as color, orientation, direction of movement, disparity, and etc. are computed in parallel and their conspicuities are represented in several topographic maps. These feature representations are integrated by a winner-take-all (WTA) saliency map. In this model, inhibiting the selected location causes a shift to the next most salient location [6].
-
B. Visual attention model based on Itti saliency map
This model based on a second biologically plausible architecture introduced by Koch and Ulman. It mimics the properties of primate vision. The visual model is first decomposed into a set of topographic feature maps. Each feature is computed by a set of linear “center-surround” operations. Different spatial location then competes for saliency within each map, such that only locations which locally stand out from this surround can persist. The linear combination of all these feature maps builds the “saliency map” [7]. Fig.5 presents the general architecture of this model.
-
IV. Review of related Research
In recent years several models based on human vision have been introduced in the context of medical image processing. These models have been applied to a wide variety of medical images from simple X-ray to PET and MRI scans for automated abnormality detection through CAD systems. The application of these models in different modalities and their results are discussed below.
In 2012 Jampani et al. investigated the usefulness of three popular computational bottom-up saliency models, Itti-Koch, GBVS, and SR, to detect abnormalities in chest X-ray and color retinal images. The AUC values of their result were all significantly higher than 0.5 and showed that all these three models are good at picking up lesions, but SR has a better localization performance for retinal images. For chest X-rays, GBVS has the best performance. Their study also showed that bottom saliency plays a significant role in medical image examinations [9]. Saliency maps which computed by these three models for a sample chest X-ray are shown in fig.6.
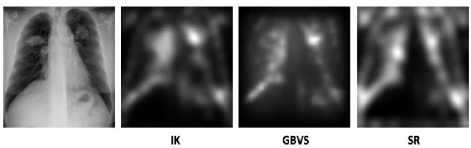
Fig.6. A sample chest x-ray and the saliency maps computed using different saliency models [9]
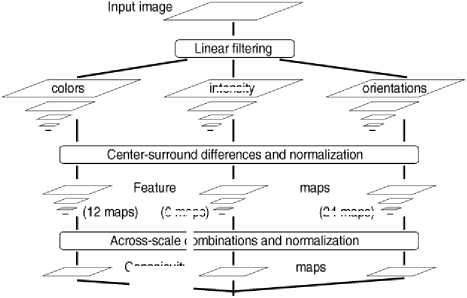
intensity
(6 maps)
24 maps)
Conspicuity
I Linear combinations J Saliency map - *
Winner-take-all |
Inhibition of return
In 2014 Agrawal et al. proposed a novel framework which automatically performs mass detection from mammograms. Their framework used saliency maps generated by GBVS algorithm for ROI segmentation and entropy features for classifying the regions into a mass or non-mass class as illustrated in fig.7. Due to breast anatomy, it is difficult for an automatic algorithm to differentiate between pectoral muscles and mass, therefor commonly, the pectoral muscles are removed before ROI segmentation, but their proposed method did not require pectoral muscle removal, it also suggested that entropy features derived from both Discrete Wavelet Transform and Redundant Discrete Wavelet Transform yield the maximum classification accuracy. The results showed that DWT entropy feature yield the best AUC of 0.876±0.001 and RWDT yield the best performance of AUC=0.870±0.001 [10].
Attended location
Fig.5. General architecture of Itti-Koch model [7]
-
C. Graph-based visual saliency
GBVS is a bottom-up visual saliency model proposed by Harel et al. This model implemented two steps. First, activation maps were computed on certain features and then normalization of these maps were done in order to mass concentration. They used dissimilarity and saliency to specify edge weights on graphs were explicated as Markov chains [8].
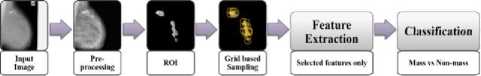
Fig.7. Illustrating the steps involved in the proposed framework [10]
The most common imaging modality to detect lung nodules and tumors is computed tomography (CT) of patient’s chest. Due to a great number of images, the analysis of chest CT images is a boring process. Computer-aided detection for CT images can perform the analysis of the images automatically which can lead to improve diagnostic accuracy and decrease the rate of misdiagnosis. In 2016 Han et al. used Visual attention mechanism in order to find a lung cancer region more quickly. As shown in fig.8 they used the Itti method in combination with shape feature of target to extract the region of interest in lung cancer. To generate a saliency map, at first they chose some primary features such as gray scale, direction edge and corner point, after that the significant regions are segmented and judged. Their method improves the accuracy rate of lung cancer detection of suspected medical images [11].
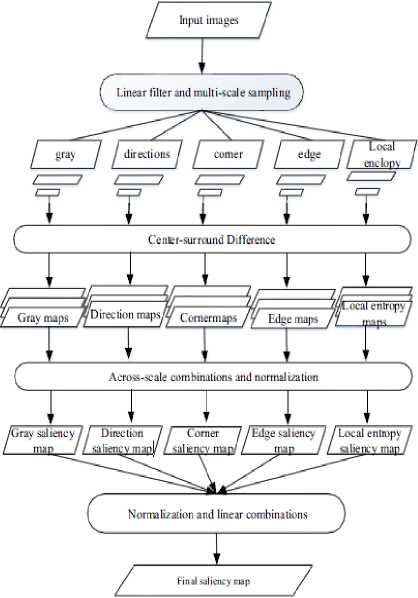
Fig.8. The flow diagram of visual attention model combined with shape feature of target [11]
The chest radiographs are also frequently used in the initial assessment of suspected lung cancer. Detecting small pulmonary nodules may be challenging despite the high resolution of chest X-rays. In 2018, Pesce et al. investigated the feasibility of deep learning for lung nodule detection. They introduced strategies based on attention mechanism within the classifier, first implemented a soft attention mechanism which focuses on the most salient image regions and second a hard attention mechanism whereby learning focuses on selectively chosen regions. Their first approach which is a convolutional neural network with attention feedback (CONAF) improves the classification performance and achieves very good localization. The ability of CONAF model to differentiate between normal chest radiographs and chest radiographs with nodules was assessed and the result was as follow: accuracy=0.85, sensitivity=0.85, precision=0.92. Their second architecture RAMF was a recurrent attention model with attention feedback that speeds up the learning process. Result of this model showed the accuracy of 0.73, sensitivity of 0.74 and precision of 0.74 [12].
Positron emission tomography (PET) is also able to diagnose and detect the development stage of the lung cancer. Due to low quality and spatial resolution of PET images, the common segmentation algorithm does not show a good efficiency. In 2016, Lu et al. proposed a segmentation algorithm based on visual saliency model of PET images. In their method, the salient images acquired by the Itti visual model were segmented by optimized Grab Cut algorithm. By this, they improve the efficiency and precision of PET image segmentation and also reduce the processing time to 31.21 seconds [13].
Banerjee et al. used visual saliency to propose an algorithm to find the location of brain tumors and perform segmentation in multi sequence MR images. Saliency maps built up based on bottom-up visual attention strategy. Comparison between their saliency detection algorithms with four other popular saliency models had shown that in all cases the AUC scores were more than 0.999±0.001 [14].
Although visual attention models for CAD systems have been attracted much attention for tumor detection, recently saliency models also proposed for computer -aided diagnosis of Alzheimer’s disease. Ben-Ahmed et al. in 2017 proposed a method for Alzheimer’s diagnosis through MRI images based on visual saliency. To build a saliency map, a fusion of bottom-up and top-down saliency maps was used and then a Multiple Kernel Learning classifier was applied to classify subjects into three classes, Alzheimer’s disease (AD), Normal control (NC) and Mild Cognitive Impairment (MCI). Their method achieved the classification accuracy of 88.98% AD versus NC, accuracy of 81.31% NC versus MCI and accuracy of 79.8% AD versus MCI [15]. A block diagram of this system is shown in fig.9.
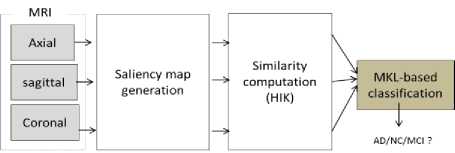
Fig.9. Block diagram of the multi-view visual saliency-based classification framework [15]
Images from different modalities reveal distinct structural and functional information, so image fusion has the privilege of better assessment of patients. Bi-dimensional empirical mode decomposition (BEMD) is one of the techniques which are used in image fusion. Mozaffarilegha et al. in 2017 proposed the use of HMAX visual cortex models as a fusion rule for higher bi-dimensional intrinsic mode functions (BIMFs) and Teager-Kaiser energy operator (TKEO) for lower BIMFs. A Schematic diagram of their method is presented in fig.10. They applied this method on the fusion of MRI/PET and MRI/SPECT images. The results of their study showed better performance compared with other fusion techniques such as HIS, DWT, LWT, PCA, NSCT and SIST in the era of color distortion and spatial information [16].

Fig.10. Schematic diagram of the BEMD-based medical image fusion method [16]
In 2018 Bagheri and Saraf Esmaili also use the HMAX model for adaptive detection of liver disease in CT images. As illustrated in fig.11 their method consists of three steps: first using discrete wavelet transforms for noise removal and ROI selection, second extracting features by Gray-level Co-occurrence matrix and HMAX, for identifying recognition pattern and the last step, performance evaluation through K-fold method. Evaluation is done under two conditions, with many features and after feature reduction. By considering factors such as accuracy, specificity and sensitivity, the results show better prediction of liver disease with an accuracy of more than 91% [17].
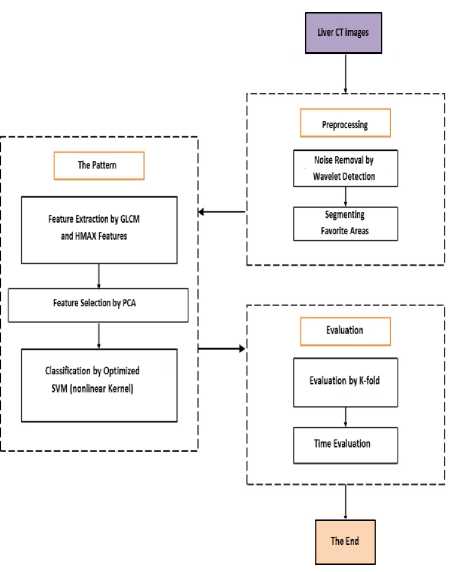
Fig.11. Flowchart of the method proposed for determining liver disease
Summary of different methods are shown in table1.
Table1. Summary of different methods
|
Image type |
objective |
Method |
Year |
Result |
|
chest X-ray and color retinal images |
Lesion detection |
Itti-Koch, GBVS and SR |
2012 |
GBVS performs better for chest X-rays.(ROC area 0.77) SR performs better for retinal images.(ROC area 0.73) |
|
Mammogram |
Mass detection |
saliency maps generated by GBVS algorithm |
2014 |
DWT entropy features, No. of features=9, AUC: 0.8767±0.001 RDWT entropy features, No. of features=12, AUC:0.8707±0.001 |
|
computed tomography (CT) of patient’s chest |
Lung cancer detection |
Itti method in combination with shape feature of target |
2016 |
Visual attention model combined with shape features of lung cancer can better highlight the ROC |
|
Chest X.rays |
Lung nodules detection |
Soft attention mechanism (CONAF) Hard attention mechanism (RAMF) |
2018 |
Classification performance (nodule vs. normal only): CONAF(accuracy=0.85,sensitivity=0.85,precision=0.9 2) RAMF(accuracy=0.73,sensitivity=0.74,precision=0.74 ) |
|
Positron emission tomography (PET) |
Fast PET image segmentation |
Salient images acquired by Itti visual model were segmented by optimized Grab Cut algorithm. |
2016 |
Image processing time(seconds) of the algorithm for a sample image: Grab Cut=34.26, Snake=90.50, Proposed algorithm=31.21 |
|
multi sequence MR images of brain |
Tumor regions identification |
bottom-up visual attention strategy based on pseudocoloring |
2016 |
AUC: 0.997 for Simulated low-grade images 0.992 for High-grade images |
|
Brain MRI |
Alzheimer’s disease diagnosis |
A fusion of bottom-up and topdown saliency maps |
2017 |
Classification accuracy of 88.98% AD versus NC, accuracy of 81.31% NC versus MCI and accuracy of 79.8% AD versus MCI |
|
MRI/PET MRI/SPECT |
Image fusion |
HMAX |
2017 |
Better performance compared to six typical fusion methods, improve spatial information and decrease color distortion |
|
Liver CT images |
Detection of liver disease |
Gray-level Co-occurrence matrix and HMAX |
2018 |
Better prediction of liver disease with an accuracy of more than 91%. |
-
V. Conclusion
This paper discusses the overview of applications of human vision based models in medical image processing, such as abnormality detection and medical image fusion. The performance of these models is summarized in the form of a table. These techniques applied to a wide variety of medical imaging modalities and cause to improve the effectiveness of CAD systems in terms of classification performance and image processing time. It is important to emphasize that with the improvement of computer and image acquisition technology, medical image processing especially image segmentation is still a challenging issue to develop. Future research should be done towards the improvement of the precision and accuracy of segmentation techniques as well as increasing processing speed so all of the algorithms we have described here are open to noticeable improvement.
References Application of Models based on Human Vision in Medical Image Processing: A Review Article
- L. G. Ungerleider and J. V. Haxby, “‘‘what’’ and ‘‘where’’ in the human brain,” Current Opinion in Neurobiology, vol.4, pp. 157-165, 1994.
- D. H. Hubel and T. N. Wiesel, "Receptive fields, binocular interaction and functional architecture in the cat’s visual cortex," The Journal of Physiology, vol. 160, pp. 106–154, 1962.
- E. T. Rolls and T. Milward, “A model of invariant object recognition in the visual system: learning rules, activation functions, lateral inhibition, and information-based performance measures,” Neural Computation, vol. 12, pp. 2547-2572, 2000.
- M. Riesenhuber and T. Poggio, “Hierarchical Models of Object Recognition in Cortex,” Nature euroscience, vol. 2, pp. 1019-1025, 1999.
- L.Itti and C.Koch, “Computational modeling of visual attention,” Nature Reviews Neuroscience, vol.2 (3), pp.194–203, 2001.
- C. Koch and S. Ullman, “Shifts in selective visual attention: Towards the underlying neural circuitry,” Human Neurobiology, vol.4, pp.219-227, 1985.
- L. Itti, C. Koch and E. Niebur, “A model of saliency-based visual-attention for rapid scene analysis,” IEEE Transaction on Pattern Analysis and Machine Intelligence, vol. 20, pp.1254-1259, 1998.
- Harel, J., Koch, C., & Perona, P. (2007). Graph-based visual saliency. In NIPS.
- V.Jampani, J.Sivaswamy et al., “Assessment of computational visual attention models on medical images,” Proceeding of the Eighth Indian Conference on Computer Vision, Graphics and Image Processing, 2012.
- P.Agrawal, M.Vatsa and R.Singh, “Saliency based mass detection from screening mammograms,” Signal processing 99, pp.29-47, 2014.
- G.Han, Y.Jiao and X.li, “The research on lung cancer significant detection combined with shape feature of target,” MATEC Web of Conferences 77, 13001, 2016.
- E. Pesce, P.P. Ypsilantis et al., “learning to detect chest radiographs containing lung nodules using visual attention networks”, arXiv: 1712.00996v1, 2017.
- L.Lu, Y.Xiaoting and D.Bo, “A fast segmentation algorithm of PET images based on visual saliency model”, Procedia Computer Science 92, pp.361–370, 2016.
- S.Banerjee, S. Mitra et al., “A novel GBM saliency detection models using multi-channel MRI,”PLOS ONE | DOI:10.1371/journal.pone.0146388, 2016.
- O. Ben-Ahmed, F. lecellier et al. “Multi-view saliency-based MRI classification for Alzheimer’s disease diagnosis,” Seventh International Conference on Image Processing Theory, Tools and Applications, 2017.
- M. Mozaffarilegha, A.Yaghobi joybari, A.Mostaar, “Medical image fusion using BEMD and an efficient Fusion scheme’” www.jbpe.org, 2018.
- S. Bagheri, S. Saraf Esmaili, “An automatic model combining descriptors of Gray-level Co-occurrence matrix and HMAX model for adaptive detection of liver disease in CT images,” Signal Processing and Renewable Energy, pp.1-21, March 2019.
