Application of remote sensing technique to detect and map iron oxide, clay minerals, and ferrous minerals in Thai Nguyen province (Vietnam)
")
Author: Trinh Le Hung
Journal: Горные науки и технологии @gornye-nauki-tekhnologii
Section: Геология месторождений полезных ископаемых
Article in issue: 1, 2016.
Free access
This article presents a study on the application of remote sensing techniques to detect clay minerals, iron oxide and ferrous minerals using LANDSAT 7 ETM+ multispectral images. We used band ratio method to determine areas that are rich and poor in mineral composite content. The results obtained in this study can be used to create a distribution map of clay mineral and iron oxide, and to facilitate mineral mining and exploration
Remote sensing, iron oxide, clay mineral, ferrous mineral, band ratio
Short address: https://sciup.org/140220584
IDR: 140220584 | DOI: 10.17073/2500-0632-2016-1-60-65
Text of the scientific article Application of remote sensing technique to detect and map iron oxide, clay minerals, and ferrous minerals in Thai Nguyen province (Vietnam)
Mineral resources are one of the most important natural resources of every country. Minerals are a source material for many industries, such as energy production, building materials, metals, agriculture, and other branches of industry. The exploration of mineral composites is a complex and urgent problem in the research and monitoring of natural resources. Traditional methods based on field surveys only solve the problem on a small scale because of the high cost involved. Remote sensing technology with advantages such as wide area coverage and short revisit interval has been used effectively in the study of mining and exploration minerals [1-5].
Band ratio is a useful method for preprocessing satellite images, especially in areas where topographic effects are important. Band ratio is based on dividing the pixels in one band by the corresponding pixels in a second band. There are two reasons for this: one is that the differences between the spectral reflectance curves of surface types can be highlighted. The second is that illumination and, consequently, radiance may vary, while the ratio between illuminated and non-illuminated areas of the same surface type will be the same [2, 5].
Today, band ratio has been widely used in spectral index building (soil degradation index, leaf area index) for monitoring land cover and minerals, and for analyzing pollution. This article indicates a band ratio method for building spectral indices and mapping the distribution of iron oxide, clay minerals and ferrous minerals.
II. MATERIALS AND METHODS
2.1 Study area
Thai Nguyen district is located in the northeast path of Vietnam, in the Pacific mineral belt. The study area is located within the latitudes 20020’N and 22025’N and longitudes 105025’E and 106016’E, covering an area of approximately 3,562.82 km². The average temperatures in the hottest and the coldest months are 28.9 °C in June and 15.2°C in January. The lowest recorded is 13.7°C. The total number of sunshine hours in a year ranges between 1300 and 1750, which is equally distributed over the months in a year. The climate of Thai Nguyen has two distinct seasons: the rainy season from May to October and the dry season from October to May. The average rainfall per annum lies in the range of 2000 to 2500 mm; it rains most in August and least in January. Generally speaking, Thai Nguyen’s climate is favorable for developing agriculture and forestry. With its rich mineral resources and favorable climate, the province offers significant opportunities for industrial development for both domestic and foreign investors [8].
2.2 Methodology
Band ratio is a technique that has been used for many years in remote sensing to display spectral variations effectively. It is based on highlighting the spectral differences that are unique to the materials being mapped [1, 2, 5]. Identical surface materials can give different brightness values because of the topographic slope and aspect, shadows, or seasonal changes in sunlight illumination angle and intensity. These variances influence the viewer’s interpretations and may lead to misguided results. Therefore, the band ratio operation could be able to transform the data without reducing the effects of such environmental condition. In addition, ratio operation may also provide unique information that is not available in any single band which is very useful for disintegrating the surface materials. The band ratio images are known for enhancing spectral contrast among the bands considered in the ratio operation and have successfully been used in mapping alteration zones [1-4].
Fig. 1 shows the reflectance spectra for iron oxide (goethite and hematite). The vertical axis shows the percentage of incident sunlight that is reflected by the materials. The horizontal axis shows wavelengths of energy for the visible spectral region (0.4 to 0.7 µm) and the reflected portion (0.7 to 3.0 µm) of the infrared (IR) region. Reflected infrared energy consists largely of solar energy reflected from the earth at wavelengths longer than the sensitivity range of the eye. The spectral reflectance curve shows that the maximum reflectance of iron oxide occurs in the red band (band 3) and that reflectance is considerably lower in the blue band (band 1). The brightness signatures in the ratio image band3/band1 correlate with iron oxide [2, 5].
Fig. 2 shows the reflectance spectra of clay minerals and other hydrothermal alterations. The vertical axis shows the percentage of incident sunlight that is reflected by the materials. The horizontal axis shows the wavelengths of energy for the reflected portion (1.0 to 3.0 µm) of the infrared (IR) region. The spectral reflectance curve shows that the maximum reflectance of iron considerably lower in band 7 LANDSAT multispectral images. The brightness signatures in the ratio image band5/band7 correlate with clay minerals [2, 5].
The methodology is based on the mineral composite (clay mineral, ferrous mineral and iron oxide) and normalized difference vegetation indices NDVI, calculated according to the following equation:
NDVI = р RED __р NIR
рRED + р NIR
where р RED , р - surface reflectance of red band and near infrared band respectively.
The role of NDVI is to mask dense plant areas. From the theoretical knowledge of the mineral’s spectral properties, it is well recognized that the LANDSAT ETM+ band ratios of 3/1, 5/7, 5/4 are analyzed for iron oxides, clay minerals and ferrous minerals respectively [1, 5, 6, 7].
oxide occurs in band 5 and that reflectance is
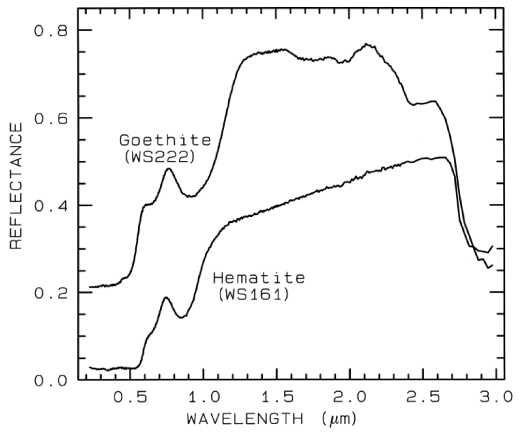
Fig. 1: Spectral features of iron oxide
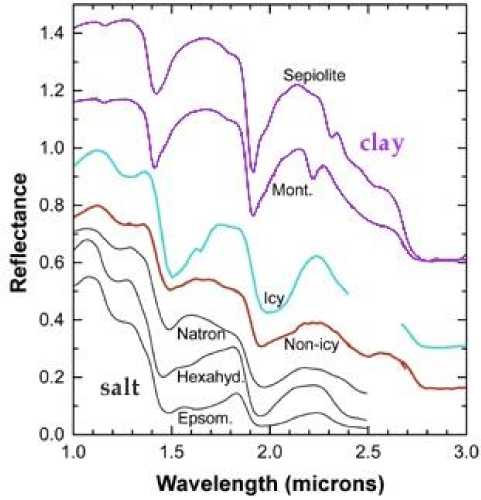
Fig. 2: Spectral characteristic of clay minerals
Table 1
Algorithms of employed indices
|
No. |
Indices |
Algorithms |
|
1 |
Clay minerals |
Band5/band7 |
|
2 |
Iron oxide |
Band3/band1 |
|
3 |
Ferrous minerals |
Band5/band4 |
III. RESULTS AND DISCUSSIONS
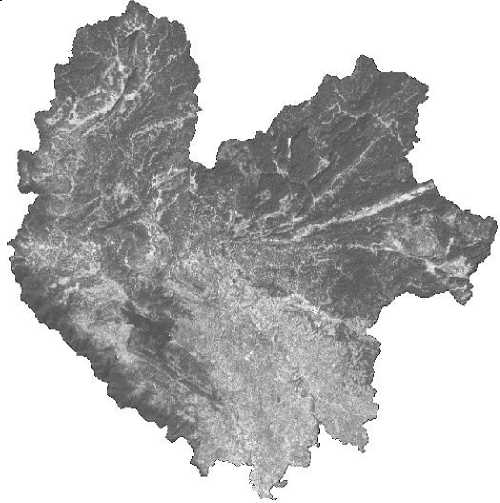
To detect and map iron oxide, clay and ferrous minerals we used a LANDSAT ETM+ satellite image on November 8, 2007 (fig. 4). The Enhanced Thematic Mapper (ETM+) on board LANDSAT-7 is a multi-spectral radiometric sensor that records eight bands of data with varying spectral and spatial resolutions (30 m spatial resolution for red, green, blue, near infrared, and two bands of medium infrared; 60 m
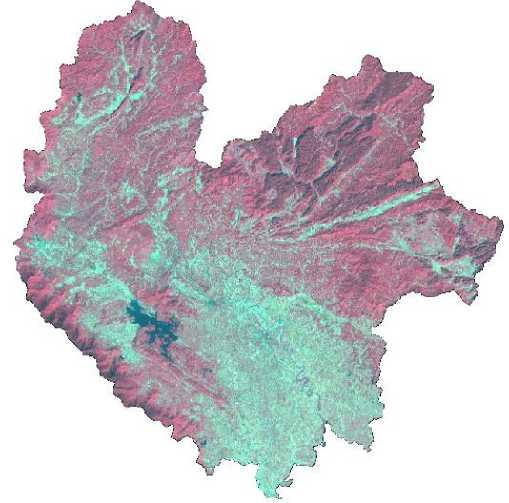
for thermal infrared; and a 15 m panchromatic band). With average spatial resolution, thermal infrared LANDSAT ETM+ image applications in the region of study (fig. 3).
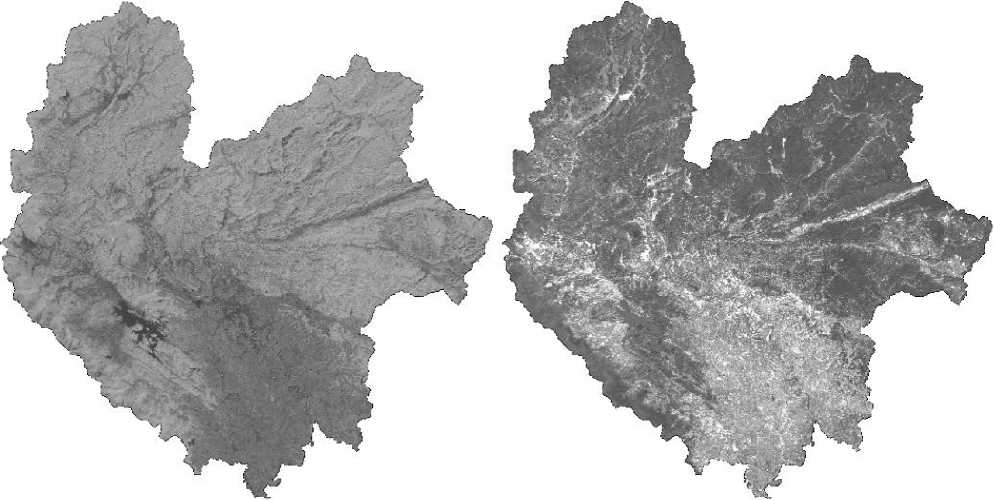
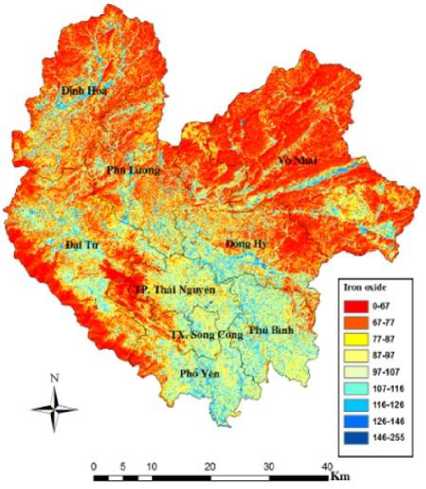
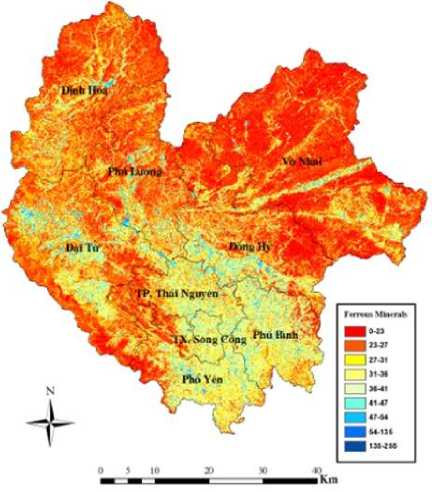
Spatial distribution of clay mineral, iron oxide and ferrous mineral classes is determined and given in figure 4 (a-c). Nine-index classes ware interpreted into four categories named: very race, race, and medium, high – very high.
a b
c d
Fig. 3: LANDSAT ETM+ image 08 – 11 – 2007 of study area in color composite 432 ( a ), iron oxide index ( b ), clay mineral index ( c ) and ferrous mineral index ( d )
Spatial distribution of clay mineral, iron oxide and ferrous mineral classes is determined and given in figure 4 (a-c). Nine-index classes ware interpreted into four categories named: very race, race, and medium, high – very high.
According to the spatial distribution of iron oxide, the main part of the study area (76.79%) is assessed in very race – race category, while the areas “medium” category covered a small portion (23.04%) of the total study area. The areas that contain iron oxide in “medium – high – very high” category covered minor portion (0.17%) of the study area (table 2).
Spatial distribution of clay minerals shows that more than half of the study area (62.14%)
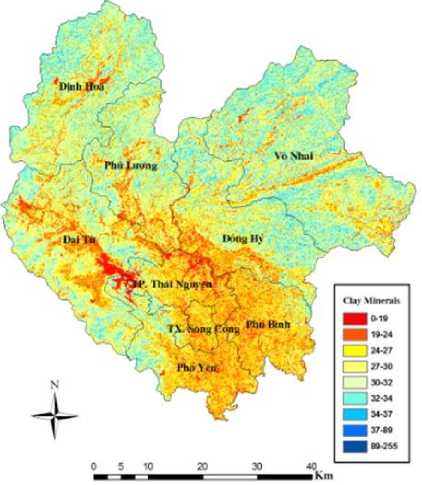
participates in the “race” category and this is ensued by “race – medium” (37.86%) and no area is detected for “high – very high” categories (Table 3).
Spatial distribution of ferrous minerals shows that the majority (72.13%) of the study area is evaluated in the “race” category. The area that contains ferrous minerals in the “medium” category covers 25.75% of the total study area and the area “medium – high” categories covers only a very small part (2.11%) of the study area and no area is detected for the “very high” category (Table 4).
b
c
Fig. 4: Clay mineral (a), iron oxide (b) and ferrous mineral (c) index maps of Thai Nguyen district
Table 2
Class areas of iron oxide
|
Class |
Index values |
Cover area (km2) |
% of the total district area |
Interpretation |
|
|
Category |
% of the total district area |
||||
|
1 |
0-67 |
781.2 |
22.10 |
Very race – race |
22.10 |
|
2 |
67-77 |
971.85 |
27.49 |
Race |
54.69 |
|
3 |
77-87 |
541.51 |
15.32 |
||
|
4 |
87-97 |
420.04 |
11.88 |
||
|
5 |
97-107 |
361.06 |
10.21 |
Medium |
23,04 |
|
6 |
107-116 |
249.42 |
7.06 |
||
|
7 |
116-126 |
149.23 |
4.22 |
||
|
8 |
126-146 |
54.73 |
1.55 |
||
|
9 |
146-255 |
6.14 |
0.17 |
Medium – high – very high |
0.17 |
|
Total |
3535 |
100 |
100 |
||
Table 3
Class areas of clay mineral
|
Class |
Index values |
Cover area (km2) |
% of the total district area |
Interpretation |
|
|
Category |
% of the total district area |
||||
|
1 |
0 – 19 |
58.39 |
1.65 |
Race |
62.14 |
|
2 |
19-24 |
511.07 |
14.46 |
||
|
3 |
24-27 |
724.09 |
20.48 |
||
|
4 |
27-30 |
903.14 |
25.55 |
||
|
5 |
30-32 |
579.9 |
16.4 |
Race – medium |
37.86 |
|
6 |
32-34 |
520 |
14.71 |
||
|
7 |
34-37 |
220.02 |
6.22 |
||
|
8 |
37-89 |
18.66 |
0.53 |
||
|
9 |
89-255 |
0.01 |
0 |
Medium – high – very high |
0 |
|
Total |
3535 |
100 |
100 |
||
Table 4
Class areas of ferrous mineral
|
Class |
Index values |
Cover area (km2) |
% of the total district area |
Interpretation |
|
|
Category |
% of the total district area |
||||
|
1 |
0-23 |
878.20 |
24.84 |
Race |
72.13 |
|
2 |
23-27 |
1061.69 |
30.03 |
||
|
3 |
27-31 |
610.15 |
17.26 |
||
|
4 |
31-36 |
498.32 |
14.10 |
Medium |
25.75 |
|
5 |
36-41 |
266.11 |
7.53 |
||
|
6 |
41-47 |
146.18 |
4.13 |
||
|
7 |
47-54 |
60.29 |
1.71 |
Medium – High |
2.11 |
|
8 |
54-135 |
14.24 |
0.4 |
||
|
9 |
135-255 |
0.01 |
0 |
Very high |
0 |
|
Total |
3535 |
100 |
100 |
||
IV. CONCLUSIONS
Spectral characteristic analysis of minerals shows that the LANDSAT 7 ETM+ multispectral image with 30 m spatial resolution can be used effectively for detecting and predicting the density distribution of iron oxide, clay and ferrous minerals. Consequently, the areas that are rich and poor in mineral composite content were determined with their coverage and geographical locations faster and more reliably. The overall results indicated that a considerable proportion of the area of Thai Nguyen has moderate iron oxide, but poor ferrous and clay mineral content. The results obtained in this study can be used to create a distribution map of clay minerals, ferrous minerals, and iron oxide for the purposes of mineral mining and exploration.
References Application of remote sensing technique to detect and map iron oxide, clay minerals, and ferrous minerals in Thai Nguyen province (Vietnam)
- Hankan Mete Dogan. Mineral composite assessment of Kelkit River Basin in Turkey using remote sensing (2012), Journal Earth System Science 118, No. 6, pp. 701 -710.
- Md. Bodruddoza Mia, Yasuhiro Fujimitsu. Mapping hydrothermal altered mineral composite using LANDSAT 7 ETM+ image in and around Kuju volcano, Kyushu, Japan (2012), Journal Earth System Science 121, No. 4, pp. 1049 -1057.
- David M. Sherman. Electronic spectra of Fe3+ oxides and oxide hydroxides in the near IR to near UV (1995), American Mineralogist, Vol. 70, pp. 1262 -1269.
- Amro F. Alasta. Using remote sensing data to identify iron composite in central western Libya (2011), International Conference on Emerging Trends in Computer and Image Processing, Bangkok, pp. 56-61.
- Trinh Le Hung (2013), Application of band ratio method to detect iron oxide, clay minerals and ferrous minerals, Mining Industry Journal, Vol. 4, pp. 19-24.
- Trinh Le Hung (2013), A method for analyzing the principal components to detect clay minerals and iron oxide distribution using images from LANDSAT satellite, Journal of Science, Ho Chi Minh National University of Education, Vol. 10, pp. 147-156.
- Trinh Le Hung (2014), Application of remote sensing to detect iron composite and clay minerals based on the Crosta technique, Mining Industry Journal, Vol. 1, pp. 36-40.
- www.thainguyen.gov.vn/
