Applications of Barcode Images by Enhancing the Two-Dimensional Recognition Rate

Author: Jen-Yu Shieh, Jia-Long Zhang, Yu-Ching Liao, Kun-Hsien Lin
Journal: International Journal of Image, Graphics and Signal Processing(IJIGSP) @ijigsp
Article in issue: 7 vol.4, 2012.
Free access
The paper not only proposed the latest Two-Dimensional Barcodes Image-processing Module, but also captured the smallest camera screens (320 240) with different focal distances and tried to find out “Finder Pattern” for positioning images. Further, use CROBU (Conversion Ratio of Basic Unit) the thesis proposed to convert 2-D barcodes into 1-pixel ratio to match images before judging recognition rate of 2-D barcodes through matching. Normally speaking, 2-D barcodes are deciphered and recognized by software while the thesis recognizes 2-D barcodes and enhances implementation speed up to 10-cm accurate max. using image matching. The 2-D barcodes image-processing module the thesis proposed does capture and standardize image with complicated background or raw edge, which enhances 2-D barcodes recognition rate. The main point of this study is to construct a platform to manage or suggest nutrients human body needs. The Quick Response Code image of 2-D barcodes represents vitamin and calories information. 2-D barcodes taken instantly by MATLAB and CCD camera can be used to list nutrients from foods you eat recently and suggest what else you should eat for the purpose of health management.
Color image segmentation, Visible color difference, Region growing, Human color perception
Short address: https://sciup.org/15012338
IDR: 15012338
Text of the scientific article Applications of Barcode Images by Enhancing the Two-Dimensional Recognition Rate
Published Online July 2012 in MECS
At this moment, all product packages are printed with 2-D QR Code (Quick Response Code) patterns everywhere. For example, in Japan, QR Code is widely applied to ticket, poster, coupon and other products, whose contained texts or information can be decoded through QR Code recognition software installed in mobile phones. Combining with mobile phone-interfaced management software, these cell phones can access activity news shop owners provide as well, achieving real-time bulletin and other life applications.
According to a test report relating to “general public’s health food consumption trend” [1] offered by an international food research association, we know people very care diet and health. Right now, modern people concern convenience, quickness, cost-effectiveness in terms of living standards. Plus, iPhone APP mobile software is prevailing. A IDC survey [2] suggests that 70% of organizations are currently deploying at least one mobile application, with more than a third of these companies deploying multiple mobile applications.
As a result, it’s much more important to design a practical application of high recognition rate, which may cater to modern people’s needs.
-
II. QR Code’S Literature Review
-
A. QR Code Image-processing Study
As for the QR Code studies, lots of which put focus on QR Code’s Finder Pattern and how to enhance accuracy. One example of recognition-related applications is how to let computer judge and capture desired region against complicated background when taking pictures in general environment. Another in [3] studied how uneven background light influences QR Code recognition rate, and how to get image’s CRLA (Constraint Run-Length Algorithm) of Finder Pattern for positioning QR Code’s four corners. As in [4] studied the multi-user signals combined with quadratic residue code for monitoring system, which includes five functions. The system composed of FM model, PLL model, ALL model, QR code generation and mobile device, use the MATLAB/Simulink to simulate this system then reached the purpose of monitor. As in [5] brought up linear boundaries to estimate corners , through which four corners could be detected directly. In detail, the method uses Moore-Neighbor Contour Tracing Algorithm to get their boundaries, and then uses Hough Transform (line-detecting technique) to extend lines for estimating barcodes region. As in [6], it mentioned how to standardize original image by area and concluded shifting QR Code to 60-90 degrees at 1020cm could effectively decode barcodes. As in [7] scanned eight image directions against plain background respectively, including up, down, left, right, upper right, right-down, upper left, left-down, for finding three Finder Patterns. Afterwards, extend linear boundaries using three points on coordinate to find the fourth point.
To sum up, the section describes how important Finder Pattern is in capturing QR Code image. Input image normally cannot be recognized or can be mistakenly read if this pattern is not found.
-
B. QR Code applications
Normally speaking, QR Code applications are mobile phone software. These practical and convenient applications are designed according to different environmental conditions. Take research [7] for example, it used GPS navigation system to position QR Code while research [9] used mobile phone to capture QR Code on object, by which users are reminded how to use this stuff. As in [10] is about a learning system by capturing QR Code on object and displaying its English information. Above all, these applications take advantage of embedded software in mobile phones to capture QR Code patterns printed on objects.
On the contrary, example [11] and [12] adapted existing barcodes as self-made ones for recognizing products. The application has good developmental potential in the future.
-
III. System Structure
Hardware structure is composed of capturing QR Code label on product by webcam and displaying product information on screen through image-processing software installed in personal computer.
-
A. Hardware Structure
-
1) Sample QR Code Pattern: Sample product barcodes we want to capture. We sampled 50 QR CODE in this experiment.
-
2) Capture Image: Use webcam to capture full-color QR Code Pattern and input that into a specific software the study created.
-
3) Image-processing: The study puts its focus on this part. The step is to use our software to process and recognize product labels from barcodes just input.
-
4) GUI Interface: Use the interface to display foods individual eats from images we captured and processed.
-
B. QR Code Image-Processing Flowchart
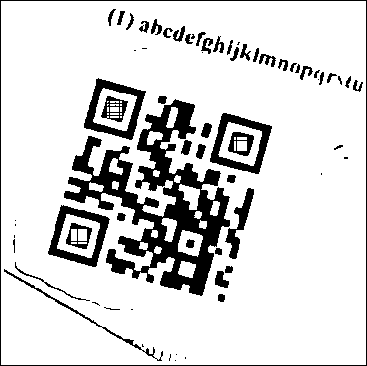
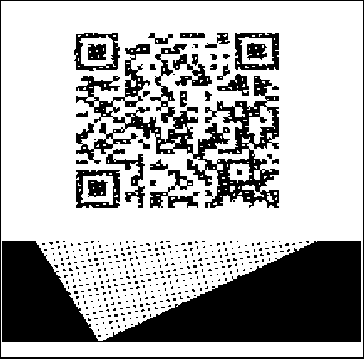
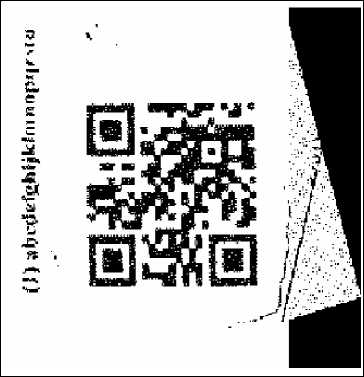
We must transform color mode of the full-color image webcam captures. Since QR Code is black-and-white image, we have to convert QR Code into binary image first, and then scan for its Finder Pattern to find out three coordinates for deciding the correct angle to put it right. Because ordinary images gains salt-and-pepper noise or raw edge after converted, it’s necessary to patch image. For salt-and-pepper noise, it can be solved by expansion and contraction; in contrast, raw edge can be solved by scanning, comparing and equalizing every adjacent horizontal and vertical linear unit (1-pixel width or length) prior to searching for image in database matching resampled image, and exporting image and information at the end, such as Fig. 1.
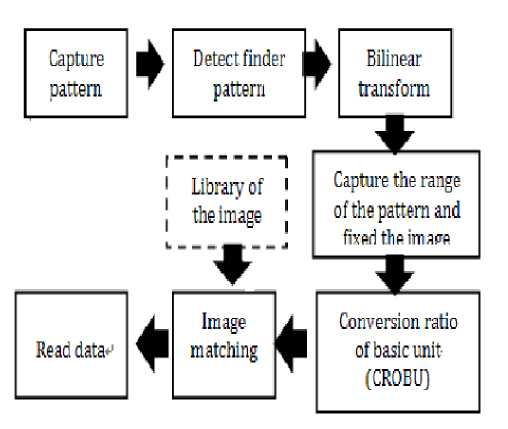
Figure 1. QR Code Image-Processing Flowchart
-
C. GUI Interface Flowchart
Webcam can display real-time picture, and through it, the program can wait for users to input sample image. Once the image is input, our interface will process it and search for products in database to confirm if it exists in database, and then display matched product information and suggestion on monitor according to the “daily nutrient recommendation table” before saving the latest data into personal health management database, as shown in Fig. 2.
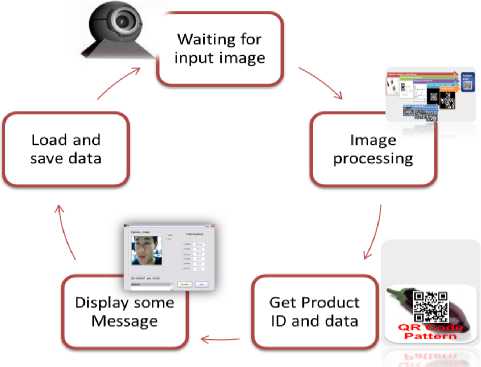
Figure 2. GUI Interface Flowchart
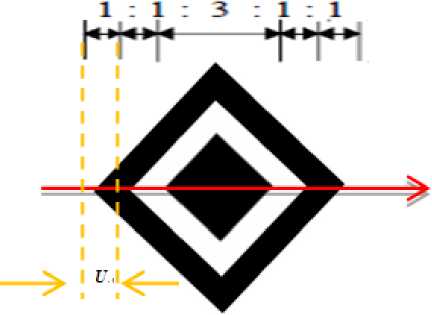
Figure 3. Detect Finder Pattern
-
IV. Research Content and Methods
-
A. QR Code Image-processing Brief Introduction
When recognizing image, normally, there should be these steps: capture image, prior-process image, check database or calculate features. Paragraph B to G are the image-processing module we proposed, they are 1) binary color mode conversion 2) detect three anchor points for Finder Pattern 3) spatial conversion of QR Code image 4) capture image region and patch image 5) Conversion Ratio of Basic Unit 6) image matching.
-
B. Color Mode Conversion
This research inputs a RGB full screen through webcam, whose resolution is 360 × 240, and tries to get a binary black-and-white output. If there is noise signal in image or if its brightness is too low or too high, how should we decide the threshold for binary image. This is a very important key step.
For example, study [13] compares adjacent gray levels and RGB pixels to distinguish target from noise signal. In this study, we apply the same method of research [2]-[3] to QR Code color image. First of all, we take the picture in well-distributed light, and then, convert its color mode into grayscale, set 127 as binary threshold, and convert the image into binary one again. By the result, we sample two pictures at 10 and 15cm focal lengths as our test pictures.
-
C. Detect Finder Pattern
Capturing QR Code image against complicated background needs to detect three coordinates of Finder Pattern. No matter how QR Code turns, it always follows 1:1:3:1:1 ratio. U: QR Code’s unit length is shown in Fig. 3.
To scan original image’s upper, lower, left and right linear pixel region respectively, and then this image will obey 1:1:3:1:1 ratio naturally. Usually, unit length difference results in failure to find linear region’s ratio in searching for Finder Pattern. Consequently, we need fault-tolerant parameter so that we can get proportional linear region by scanning. The fault-tolerant parameter for the study is around 1-2 pixels. We search for images and mark proportional 5-unit linear results at the same time, find out their overlaps, and then look for the largest area composed of Finder Pattern’s coordinates in image. The image this study takes is 5-unit length square consisting of intersection points. Use (1) to calculate new Finder Pattern area by finding out three points forming the largest area in image, the so-called Finder Pattern, as shown in Fig. 4.
(a)
(b)
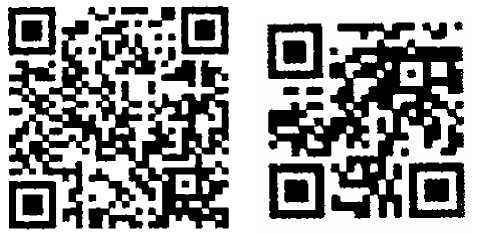
Figure 4. Detect largest area of Finder Pattern (a) 10cm (b)15cm
(a)
And position Finder Pattern directly. F(x, y) stands for area array, f(x, y) is binary array, m is the column for image, n is the row for image, x is pixel’s x value on image’s coordinate while y is pixel’s y value on image’s coordinate.
y +7 x +7
F (x, y) = J J f (x, y) -dx • dy yx
1 < x < n - 71 < y < m - 7
-
D. Bilinear transform
Often, when users are taking pictures, they won’t take it straightly. Hence, several reasons such as hand’s vibration or shooting angle may cause QR Code misreading. That’s also why we need to recalculate how many degrees or what’s the slope we need to turn image in accordance with the Finder Pattern’s coordinates. The study concludes two points in line with Finder Pattern’s every point and substitutes them into (2) to get slope. After that, use the third point’s position to get how many degrees is needed for complementing transformed angle. Substitute discovered slope and angle into (3) to get new spatial conversion image.
(b)
Figure 5. Angle Transformation Illustration
x 1
- 1
< x 2
1 J
y 1
y 2
a
b
-
E. Image-capturing Area and Patch
To accelerate calculating speed after transforming angle through Finder Pattern, we capture 4 points’ featured regions in image using methods shown in TABLE I. We extend boundaries to 7 unit lengths as the new image region we want to capture.
T ( X, Y ) = a ( x cos 9 + y sin 9 , - x sin 9 + y cos 9) (3)
a means slope, b is scalar on axis y, T(X,Y) is converted array, X is x value after coordinate transformation, Y is y value after coordinate transformation, θis the included angel between x value of original picture and converted one, x is the x value on original picture’s coordinate, y is the y value on original picture’s coordinate Fig. 5 is the result of setting right.
TABLE I. N ew C aptured I mage S cope
|
V 1 (x 1 ,y 1 ) |
w 1 (x 1 -7 U,y 1 -7 U) |
|
V 2 (x 2 ,y 2 ) |
w 2 (x 2 +7 U,y 2 -7 U) |
|
V 3 (x 3 ,y 3 ) |
w 3 (x 3 -7 U,y 3 +7 U) |
|
V 4 (x 4 ,y 4 ) |
w 4 (x 2 +7 U,y 3 +7 U) |
The three anchor points in this study are decided by the upper right point of Finder Pattern’s largest central area found. They are repositioned after angel transformation. And the fourth point is decided by V2’s x value and V3’s y value. From Fig. 6, we know 7 unit length is enough for capturing the whole image.
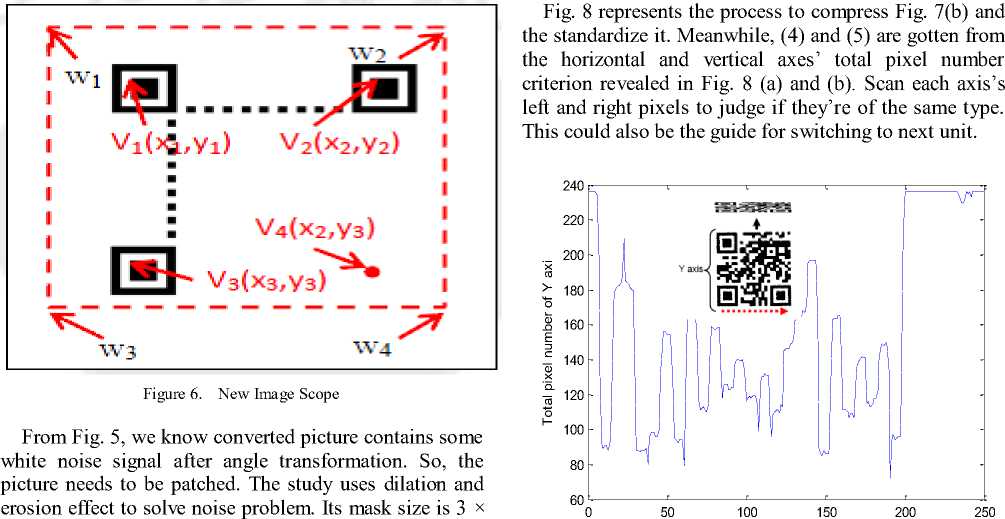
3, as the pixel scope to recognize surroundings. Please refer to Fig. 7.
(a) (b)
Figure 7. Image Dilation and Erosion
F. Image Ration Transfromation
After prior processing, captured image should be standardized for any use and later image recognition. Use “conversion ratio of basic unit” the study proposed to transform image into unit pixel 1’s format, and use (4) and (5) to transform every vertical and horizontal basic pixel value.
m v= x = m v = xU
У Tx ( x ,1: n )---^ У A x ( v ,1: n )
x=1
y = n
У A x (1: m , y )
y = 1 U
n
y u = UТИ
-
-^ У A y (1: m , u)
u=1
Ax is horizontal compressed array, v is row of horizontal compressed array, m is row of image, n is column of image, Tx is the total pixel number of converted image perpendicular to x axis, U is image’s basic unit, Ay is vertical compressed array, u is column of vertical compressed array.
Y axi
(a) y axis’s pixel distribution
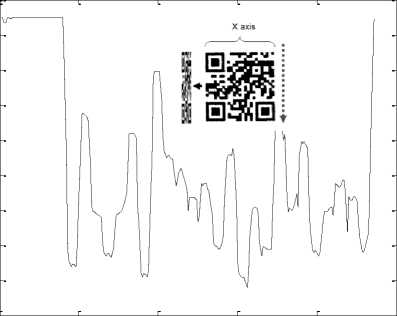
x
о
0 50 100 150 200 250
X axi
-
(b) X axis’s pixel distribution
Figure 8. Image Standardization
Above all, we capture image at 10cm and 15cm from Pattern. Their results are shown in Fig. 9.The study effectively process and standardize image against complicated background.
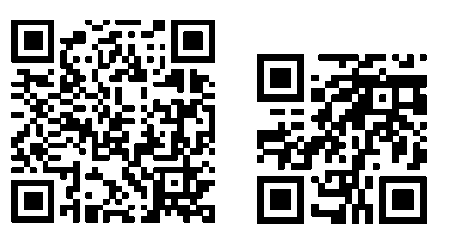
(a) (b)
Figure 9. Standardization of Different Focal Legths
-
G. Image matching
The thesis uses QR Code as ID to recognize products. For this reason, this chapter matches standardized image with images in database using image recognition to get product information. The study takes standardized image as basis, built-in database as the reference to scan, and then uses convolution (6) to find out sample picture of the highest matching rate through (7).
( i = m - t, j = n - r ) ( x = t - 1, y = r - 1)
M = J J ( f 1 ( x + i , y + j ) - f 2 ( x , y )) • dx • dy (6)
( i = 1,j = 1) ( x = 0, y = 0)
M is sample number for matching, f1 is base array after transformation, f2 is database’s reference array, r is the column of reference, t is the row of reference, i is the y coordinate for base array, j is the x coordinate for base array, m_rate is matching rate.
m rate =---x 100% r * t
Match standardized input image with database to judge if they are the same. Regularly, successful matching rate is 100%. However, because of environmental factors, the research’s successful matching rate is set merely above 79% for correct sample picture.
-
V. Experiment Result
-
A. Experiment Environment
The experiment uses webcam as the tool to capture image. Its format is as follows:
-
(1) Camera Resolutions: 300 thousand pixels (640 × 480)
-
(2) QR Code Version: 2 Version (25 × 25)
-
(3) Environmental Light: 100-400 LUX
-
(4) Shooting Distance: 10 – 25 cm
-
(5) Input Image Size: 320 240
-
(6) Binary Threshold: 127
As in [3]-[4], uneven-distributed light may influence accuracy, and the shooting distance influences image’s completeness as well. Both factors may influence the experiment. This study uses measuring conclusion mentioned in forgoing reference to decide our measuring parameter and experimental basis.
-
B. Accuracy Analysis
The experiment tests results of regualr light and bright light at 10cm and 20cm. Sample number is 50. We analyze the system’s accuracy, as TABLE II.
TABLE II. A ccuracy A nalysis in R egular L ight
|
Distance |
Recognized Number |
Failure Number |
Accuracy |
|
10cm |
50 |
3 |
94% |
|
15cm |
50 |
11 |
78% |
|
20cm |
50 |
24 |
52% |
According to the experimental result, we can find recognition rate in well-distributed light is especially high. In which, the study also found light intensity does influence QR Code, or recognition distance reflects in recognition rate directly. These factors are reflected in image’s unit length or pixel value. For example, light intensity may carry influence within around ±2 pixel unit lengths. In the meantime, distance influences unit length proportionally. TABLE II show that accuracy reaches over 70% at 10cm and 15cm in regular well-distributed light. This is enough for getting product information accurately and calculating nutrients you need to intake .
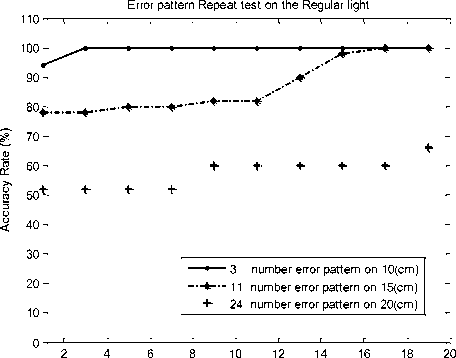
times
Figure 10. re-testing times of accuracy in regular light
According to TABLE II., when taking pictures for the first time in bright and regular light, some images cannot be recognized. Therefore, we take the experiment again by recognizing failed images at different distances repeatedly, including 3 sample pictures at 10cm in regular light, 11 sample pictures at 15cm in regular light, 24 sample pictures at 20cm in regular light, etc. Fig. 11 show the re-testing times of accuracy in bright and regular light. From it, we know only three times is enough for recognizing pictures accurately. The experiment also shows too many times may bring convergence phenomenon.
-
VI. Conclusion
In the condition of 320 × 240 size (the smallest webcam screen), The QR recognition module this study proposed definitely can find out Finder Pattern to position image, and we use CROBU to convert image’s basic pixel unit to unit image prior to judging label’s QR Code information on products through image matching. This ratio-converting method is very suitable for mobile phone-embedded software in the future, which can be used to judge regular self-made barcodes or images. Besides, when capturing QR Code label, often, we need to detect four corners of Finder Pattern. So, the CROBU proposed by this study can directly recognize images from converted images. Finally, the study takes a personal GUI management interface to reveal its application on products. Experimental results show the best accuracy (94%) happens at 10cm in regular light for captured image. In line with the outcome, we compare that with other related studies as shown in TABLE III, accuracy analysis table. The table shows the accuracy of this study significantly surpasses other studies on the basis of similar standards.
TABLE III. A ccuracy C omparison T able
|
Screen Size |
Recognized Number |
Failed Number |
Accuracy Rate |
|
|
Y.H. Chang [2] |
320 X 240 |
50 |
5 |
90% |
|
Su Je-Min[3] |
1024 Х768 |
40 |
2 |
95% |
|
E. Ohbuchi [5] |
320 X 240 |
50 |
5 |
90% |
|
Our Method |
320 X 240 |
50 |
3 |
94% |
References Applications of Barcode Images by Enhancing the Two-Dimensional Recognition Rate
- Functional Foods/Foods for Health Consumer Trending Survey, EXECUTIVE RESEARCH REPORT, International Food Information Council (IFIC), 2009.
- S.D. Drake, “Embracing Next-Generation Mobile Platforms to Solve Business Problems”, a Sybase White Paper, Oct 2008. http://www.sybase.com/detail?id=1060699. Accessed 7/4/2009.
- Y.-H. Chang, C.-H. Chu, and M.-S. Chen., A General Scheme for Extracting QR Code from a non-uniform background in Camera Phones and Applications, Ninth IEEE International Symposium on Multimedia ,pp.123-130, Taichung, Taiwan, 2007.
- C.J. Ho, W.H Hsien, and G.-J. Jong., Multi-user Signals Combined with Quadratic Residue Code for Monitoring System, Eighth International Conference on Intelligent System Design and Application ,pp.100-103,Kaohsiung, Taiwan,2008.
- J.M. Su, Skewed QR Code Recognition on Handheld Device, Department of Computer Science and Information Engineering National Taipei University of Technology, Taiwan, 2007.
- C.Y. Lai, Extracting QR Code from a Non-uniform Background Image in Embedded Mobile Phones, Department of Communication Engineering National Taiwan University Taipei, Taiwan, 2007.
- E. Ohbuchi, H. Hanaizumi, L.A. Hock, Barcode readers using the camera device in mobile phones, Proceeding of IEEE 3rd International Conference on Cyberworlds, pp.260-265 ,Tokyo, Japan, 2004.
- Y.C. Lai, F.N. Han, Y.H. Yeh, A GPS Navigation System with QR Code Decoding and Friend Positioning in Smart Phones, 2nd International Conference on Education Technology and Computer (ICETC), Page V5-66 V5-70,Shanghai, 2010.
- S. Hend A.l. Khalifa, Utilizing QR Code and Mobile Phones for Blinds and Visually Impaired People, Computers Helping People with Special Needs Lecture Notes in Computer Science, Volume 5105/2008, Publisher: Springer, Pages:1065-1069, 2008.
- T.Y. Liu, T.H. Tan, Y.L. Chu, QR Code and Augmented Reality-Supported Mobile English Learning System, Volume: 5960, Publisher: Springer, Pages: 37-52, 2010.
- Y.H. Xue ,G.H. Tian, R.K. Li, H.T. Jiang, A new object search and recognition method based on artificial object mark in complex indoor environment, Intelligent Control and Automation (WCICA), 8th World Congress ,Page(s): 6648 – 6653, 2010.
- J. Matas , L. M. Soh , J. Kittler, Object Recognition Using A Tag, IEEE 1977 International Conference on Image Processing, vol.1 Page(s): 877 – 880, 1997.
- Rachid Hedjam , Reza Farrahi Moghaddam, Mohamed Cheriet, A spatially adaptive statistical method for the binarization of historical manuscripts and degraded document images, Pattern Recognition Volume 44, Issue 9, September, Pages 2184-2196, 2011.
