Applying the index method in the research on consumer sentiment

Author: Dementeva Irina N., Shakleina Marina V.
Journal: Economic and Social Changes: Facts, Trends, Forecast @volnc-esc-en
Section: Modeling and forecast of socio-economic processes
Article in issue: 1 (61) т.12, 2019.
Free access
The index method is an effective tool to study and assess consumer sentiment in the given territory by calculating the aggregated consumer sentiment indices based on sociological data. Our paper discusses methodological approaches used in international practice to measure and evaluate consumer sentiment with the help of integrated indices; we also consider trends in the consumer sentiment index of residents of Russia and the Vologda Oblast. Using multiple regression analysis, we investigate the impact of macroeconomic indicators on consumer sentiment. The information base of the research is presented by the results of the public opinion monitoring conducted by Vologda Research Center of RAS (VolRC RAS), all-Russian analytical centers (Levada-Center, International Institute for Marketing and Social Research GfK Rus), as well as by the data of the Federal State Statistics Service (Rosstat) and the territorial office of the Federal State Statistics Service for the Vologda Oblast (Vologdastat)...
Consumer sentiment, index, auto-regressive distributed lag model, socio-economic development, income, retail trade turnover
Short address: https://sciup.org/147224127
IDR: 147224127 | UDC: 316.65:311 | DOI: 10.15838/esc.2019.1.61.9
Text of the scientific article Applying the index method in the research on consumer sentiment
Consumers play an extremely important role in the modern market economy, because the expenditures they undertake account for more than half of Russia’s gross domestic product. The expenditure indicator, which determines the level of demand for the goods and services produced, largely characterizes the overall economic dynamics in the country (correlation coefficient between the dynamics of household consumption and GDP in 1995– 2017 is 0.98). According to the Center for Macroeconomic Analysis and Short-Term Forecasting, the contribution of household consumption to economic growth in the third quarter of 2017 was 2.6% (for comparison: contribution of gross fixed capital formation was +0.8%, changes in reserves were +0.5%, changes in exports were +1.1%, changes in imports were -3.4%, total GDP growth was +1.8%, changes in other components were +0.1%;)1. Timely information on consumer spending is required for assessing and forecasting overall economic activity. The presence of effective demand is one of the main factors in the planning of activities at enterprises, in making decisions on increasing or reducing capacity utilization, and in the implementation of investment projects. The establishment of optimal proportions between consumer demand and supply is an important condition for the well-being, stability and economic security of the territory [1].
The decisions of consumers to make certain purchases (especially large ones) or to form savings depend not only on objective reasons, such as the level of personal income and prices in the consumer market. The impact of these factors on the behavior of people in the modern economy is inevitably mediated by their attitudes and subjective views, i.e. perceptions, estimates and expectations about their financial situation, employment, price dynamics, and general economic prospects of the country as a whole [2].
In world practice, consumer sentiment surveys are conducted on a regular basis in more than 40 countries. Most studies use the index method, which involves the construction of indices, which are aggregated quantitative indicators that summarize the primary sociological information obtained during the measurement using one or more scales. Sociological indices, on the one hand, are a way of aggregation and compression of information and its presentation in a form convenient for description and interpretation; on the other hand, it is a way of transition from the theoretical to the empirical level of research, a way of constructing an empirical indicator of a theoretical concept [3].
Extent of scientific development of the topic under consideration
Domestic and foreign scientists pay enough attention to the development of the topic. The research is carried out in several directions:
-
1. Studying methodological issues of sociological information processing through the construction and use of analytical indices. Such issues were covered by R. Pinto, M. Grawitz [4], E. Noelle [5], P. Suppes, J.L. Zinnes [6], J. Pfantzagl [7], Yu.N. Tolstova [8], I.F. Devyatko [9], G.G. Tatarova [3], M.S. Kosolapov, V.D. Patrushev [10], G.V. Osipov, E.P. Andreev [11], M.K. Gorshkov, F.E. Sheregi [12], K.G. Gerasimova, V.I. Paniotto, T.I. Zaslavskaya, I.B. Muchnik [13] and others.
-
2. Constructing and calculating sociological indices on the example of solving specific applied problems and assessing various aspects of life. These problems are considered in the works of N.E. Tikhonova, N.M. Davydova, I.P. Popova [14], P.I. Mtiulishvili [15], M.D. Krasilnikova [16], S.G. Klimova, E.G. Galitskaya, E.B. Galitsky [17], I.N. Dementieva [18].
-
3. Applying the index approach to the study of consumer attitudes. The foundations of this direction were laid in the 1950s by the American scientist George Katona [19; 20]. Currently, these issues are addressed by such researchers
-
4. Using the index approach by various Russian and international research institutions: VTsIOM, FOM, Levada-Center, VolRC RAS, international companies like GfK Group, Nielsen, etc.
as A. Birman, R. Curtin [21], C.F. Camerer, G. Loewenstein et al. [22], E.-M. Sent [23], E. Franchak, S. Navotny, E. Gusva-Lesni, D. Ibragimova, S. Nikolaenko [24], R. Kapelyushnikov [25], M. Krasilnikova, V. Cherednichenko [26], etc.
In general, despite the comprehensive elaboration of the possibilities of using the index method in foreign and domestic science and practice, there is not enough research on the issues concerning the use of the index approach to study consumer attitudes, and, in particular at the regional level.
Goal and objectives of the study
The goal of the present research is to analyze the possibility of using the index method as a tool to study consumer sentiment.
Achieving this goal involves addressing the following objectives :
-
1. Review of Russian and international methods for assessing consumer sentiment with the help of integral indices.
-
2. Analysis and comparison of trends in the aggregate consumer sentiment index (CSI) of residents of Russia and the Vologda Oblast and the characteristics of private components of CSI for the period from 2000 to 2017.
-
3. Study of the impact of macroeconomic indicators on consumer sentiment using multiple regression analysis.
Information and empirical base of the research consists of the following sources:
-
1. Official data of the statistical office of the European Union (Eurostat), the Federal State Statistics Service (Rosstat) and the territorial office of the Federal State Statistics Service in the Vologda Oblast (Vologda Oblast).
-
2. Data of sociological research conducted by Yuri Levada’s All-Russian Research Center (Levada-Center), the International Institute of Marketing and Social Research GfK Rus.
-
3. Findings of the VolRC RAS monitoring of the economic situation and social well-being of the Vologda Oblast residents.
Research methodology and technique
-
1. In our research we study consumer attitudes of the Vologda Oblast residents with the help of the method of monitoring research of public opinion used by RAS Vologda Research Center. Every two months (six times per year), 1,500 residents over 18 years of age take part in the survey in two cities (Vologda, Cherepovets) and in eight districts of the Oblast (Babaevsky, Velikoustyugsky, Vozhegodsky, Gryazovetsky, Kirillovsky, Nikolsky, Tarnogsky and Sheksninsky)2. The main method of monitoring is a questionnaire survey at the place of residence. The method allows us to obtain reliable results of the study primarily by creating convenient conditions for interviewers and respondents engaged in direct interaction. The volume of the sample of the study is about nine thousand inhabitants of the region per year.
-
2. We use the index method for processing social data and for analyzing consumer sentiment of the region’s population. On the basis of the data of the monitoring, we calculate the integrated consumer sentiment index and its constituent private indices according to a methodology developed at the University of Michigan Institute for Social Research (USA).
-
3. We use econometric methods, namely, the autoregressive distributed lag model and correlation analysis for a more in-depth analysis of the survey data and statistics in order to determine the impact of macroeconomic factors on consumer sentiment.
Research findings
International and national experience in measuring consumer sentiment with the use of integral indices
We have conducted a review of world’s methodological approaches to the assessment of consumer sentiment using integrated indices and combine these approaches into three groups .
-
1. The first group is based on a methodology developed in the 1950s by the Survey Research Center at the University of Michigan Institute for Social Research (USA); the methodology involves the construction of an aggregate consumer sentiment index3.
-
2. The second group of methods is based on the methodology of the European Union for the calculation of the consumer confidence index (CCI). Since 1990, this indicator is calculated monthly in Belgium, France, Denmark, UK, Italy, Germany, Greece, The Netherlands, Ireland, Portugal and other EU countries; it is calculated according to a
Table 2. Questions used to calculate CCI
No.
Index
Question wording
1.
Index of expected changes in the personal financial situation
Do you expect the financial situation of your household to change over the next 12 months?
2.
Index of expected changes in the economic situation in the country
Do you expect the overall economic situation in the country to develop over the next 12 months?
3.
Index of expected changes in the labor market
Do you expect the number of unemployed in the country to change over the next 12 months?
4.
Index of expected changes in personal savings
Will you save money in the next 12 months?
-
3. The third group includes other techniques, among which we can name the technique of Shinjo Center in Japan, the consumer confidence index (CCI) calculated in the U.S. (Conference Board), in Canada (Conference Board / Canada), in Russia (Rosstat)7.
The index of consumer sentiment is a multicomponent and highly aggregated indicator. It is constructed as a set of subjective assessments of the current personal financial situation, the situation in the consumer market and the expectations of changes in personal financial situation and in the general economic situation. The specific feature of the consumer sentiment index, which distinguishes it from traditional indicators of socio-economic development, is the use of a specially developed methodology, which is at the junction of sociology, economics and psychology and which includes their latest developments [27].
In the US, CSI was originally measured three times a year; surveys were conducted quarterly since 1960, now they are conducted monthly. Since 1955, the results of measu-
Table 1. Questions used to calculate CSI
|
No. |
Index |
Question wording |
|
1. |
Index of current personal financial situation |
How would you assess the financial situation of your family: is it better or worse than it was a year ago? |
|
2. |
Index of personal financial situation prospects |
Do you think that in a year your financial situation will be better or worse or about the same as it is now? |
|
3. |
Index of short-term development prospects for the country’s economy |
Do you think in the next 12 months will be a good or a bad time for the country’s economy, or they will bring something else? |
|
4. |
Index of long-term development prospects for the country’s economy |
If we talk about the next five years, then do you think they will be a good or bad time for the country’s economy? |
|
5. |
Index of expediency of purchasing durable goods |
If we talk about large purchases for the home, what do you think, is it a good or bad time to buy most of these goods now? |
rements are regularly published along with the main macroeconomic statistics of the United States4.
In Russia, the first measurements of the consumer sentiment index were conducted in 1993 by the Russian Public Opinion Research Center (VTsIOM). At first, they were carried out randomly and irregularly. In 1997, a special non-profit organization, the “Promotion of the development and construction of the consumer sentiment index” Fund (CSI Fund), was established; its main purpose was to assist in providing financial, technical and intellectual support to research aimed at studying consumer sentiment in Russia. In 1996–1997 the CSI project was financed by U.S. Treasury’s Office of Technical Assistance, in 1998–2003 – by the grants received from the Ford Foundation and from the sources related to the Russian business community (in particular, from the Moscow Interbank Currency exchange, Sberbank of Russia, etc.), as well as with the support from the CSI Development Center; in 2004–2005, the implementation of the CSI program was supported by the Independent Institute for Social Policy, Levada-Center and Sberbank of Russia [26].
The Institute of Marketing and Social Research GfK Rus – a subsidiary of the largest international research concern GfK Group, which has been monitoring consumer behavior and social attitudes in Russia for more than 15 years on the basis of the all-Russian omnibus research, – makes a significant contribution to the study of CSI, not only on a national scale, but also in the context of federal districts5.
The technique for calculating CSI is based on the data of public opinion polls on five questions (Tab. 1) . Private indices are calculated for each question6. The arithmetic mean of the private indices gives the aggregate value – the index of consumer sentiment.
common methodology that combines the answers in points to four questions regarding the expected changes in (1) personal material and (2) general economic situation, (3) employment and (4) personal savings for the next 12 months. Partial indices are calculated as a balance of the shares of positive and negative answers with half the weight of the intermediate answers, i.e. the indices vary from –100 to +100. The general index is an arithmetic mean of the individual indices (Tab. 2). [28].
Currently, the European Commission has harmonized the consumer confidence index for the main EU countries. The harmonized index is calculated on the basis of confidence indices calculated in the countries by their own services and organizations.
For example, the consumer confidence index is calculated by Rosstat (previously – Goskomstat) since 1998 on the basis of the survey of consumer expectations (OPON) once a quarter. The general consumer confidence index is calculated as an arithmetic mean of five private indices (actual and expected changes in personal financial situation, economic situation in Russia, favorable conditions for large purchases) (Tab. 3)8.
Since 2005, Nielsen international research company conducts the Global Consumer Confidence Survey, which reflects the level of consumer confidence, the main factors affecting this level and the willingness of consumers to spend their money. The study covers more than 27 thousand Internet users from 55 countries, including Russia, Asia-Pacific region, Europe, Latin and North America, Middle East, and Africa. Nielsen’s consumer confidence index is based on the level of consumer confidence in the labor market, the state of their personal finances, and their willingness to spend money. The level of consumer confidence below and above 100 points is an indicator of the degree of consumer pessimism and optimism for each country. The sample is broken down by age and sex quotas for each country and weighted to achieve the representativeness of Internet consumers9.
Table 3. Questions used to calculate CCI
|
No. |
Index |
Question wording |
|
1. |
Index of expected changes in the economic situation in Russia in a year |
How would you assess possible changes in the Russian economy over the next 12 months? |
|
2. |
Index of changes in the Russian economy |
How would you assess the changes that happened in the economic situation in Russia? |
|
3. |
Index of expected changes in personal financial situation in a year |
How would you assess possible changes in your financial situation over the next 12 months? |
|
4. |
Index of actual changes in personal financial situation |
How would you assess the changes in your financial situation during the year? |
|
5. |
Index of favorable conditions for major purchases |
How would you assess the conditions for making major purchases? |
In general, all the above mentioned techniques for studying consumer sentiment differ in the list of questions included in the questionnaire and used to determine the summary indices; besides, they use different algorithms for weighing the answers of respondents and have different quantitative boundaries of changes in the indices obtained. At the same time, the methodological basis for the study of intentions, attitudes and behavior of consumers using sociological data and carried out by various national and international research institutions was laid in the methodology of the University of Michigan for the calculation of the consumer sentiment index.
On that basis, the technique was adopted and since the late 1990s has been successfully used by RAS Vologda Research Center to study consumer sentiment in the monitoring of public opinion on the territory of the Vologda Oblast. An important role in choosing the methodological approach was played by the fact of long-term regular measurements carried out by the autonomous non-profit organization “Yuri Levada Analytical Center” on a national scale, which makes it possible to compare regional and national trends using a comparable methodology.
Main trends in consumer sentiment in Russia and the Vologda Oblast
Let us consider the specific results and characteristics of the main trends in consumer sentiment in Russia and the Vologda Oblast.
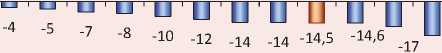
In 2017, according to Eurostat and Rosstat, Russia ranked fifth from the bottom in the rating among the European countries conducting surveys of consumer sentiment on a comparable methodology. Below Russia in the rating there were countries with traditionally prevailing pessimistic sentiments – Greece and Bulgaria, as well as Latvia and Italy. The most favorable countries to live in are Finland, The Netherlands, Sweden and Denmark; these countries have developed an effective system of social support and have high investments in human capital (Fig. 1) .
According to the International Institute of Marketing and Social Research GfK Rus, which calculates the consumer sentiment index according to the method of the University of Michigan, for the period from 2008 to 2017, both in Russia as a whole and in all federal districts there were similar trends in the change of CSI. Its significant decline was noted in the context of the 2008–2009 global financial crisis and the 2014–2015 structural crisis (Tab. 4) . In 2017, the consumer sentiment index in all macro-regions of Russia, except for the Far Eastern and Northwestern federal districts, exceeded 100 points10.
Figure 1. Consumer confidence index in Russia and in some EU countries in 2017, points
21 20 15 14
П П п п
II "
-20
-40
-60
-80
-2
-2
-73

-23

Source: Russia – Federal State Statistics Service data. Available at: ; EU countries – Eurostat data. Available at:
Table 4. Consumer sentiment index in macroregions of Russia, points
|
Macroregion |
2008 |
2009 |
2010 |
2011 |
2012 |
2013 |
2014 |
2015 |
2016 |
2017 |
|
Russia (as a whole) |
85 |
91 |
106 |
107 |
113 |
113 |
95 |
84.5 |
83.4 |
103.2 |
|
Northwestern |
83 |
100 |
106 |
122 |
113 |
106 |
109 |
73.3 |
78.6 |
98.8 |
|
Central |
81 |
88 |
96 |
95 |
111 |
109 |
92 |
88.5 |
84.8 |
107.4 |
|
Southern |
74 |
90 |
106 |
96 |
116 |
108 |
105 |
81.8 |
78.4 |
104.4 |
|
Volga |
81 |
85 |
103 |
102 |
110 |
113 |
99 |
85.3 |
83.4 |
105.2 |
|
Ural |
71 |
94 |
107 |
118 |
117 |
121 |
108 |
92.0 |
85.8 |
108.0 |
|
Siberian |
83 |
97 |
105 |
110 |
119 |
113 |
98 |
88.3 |
77.4 |
103.0 |
|
Far Eastern |
77 |
93 |
105 |
109 |
128 |
94 |
91 |
71.3 |
77.2 |
99.6 |
|
North Caucasian |
– |
– |
119 |
110 |
113 |
130 |
115 |
88.5 |
98.6 |
105.8 |
Source: data of the International Institute of Marketing and Social Research GfK Rus. Available at: (accessed: 11.10.2018).
The data of VolRC RAS regional monitoring correlate in many aspects with nationwide figures. During the period from 2000 to 2017 (except for the time period from 2005 to 2008), the consumer sentiment index of the Vologda Oblast residents was below the neutral level of 100 points, which indicates the predominance of negative assessments regarding people’s own standard of living and quality of life and their uncertainty concerning the prospects of economic development (Fig. 2). The negative dynamics of CSI was most significant in the crisis year of 2009 (the index fell to 75 points) and 2015 (77 points). In 2017, there was a trend of increasing consumer activity in the region: compared to the level of 2016, the consumer sentiment index increased by six points (from 78 to 85 p.).
In addition to the consolidated CSI, its components are of interest as well, since they allow us to analyze individual components of the comprehensive process of formation and realization of the final consumer demand. Although all the components of CSI characterize different sides of the same processes taking place in the economy and people’s attitude toward them, each of these components brings something new [29].
Figure 2. Consumer sentiment index dynamics in the Vologda Oblast, points
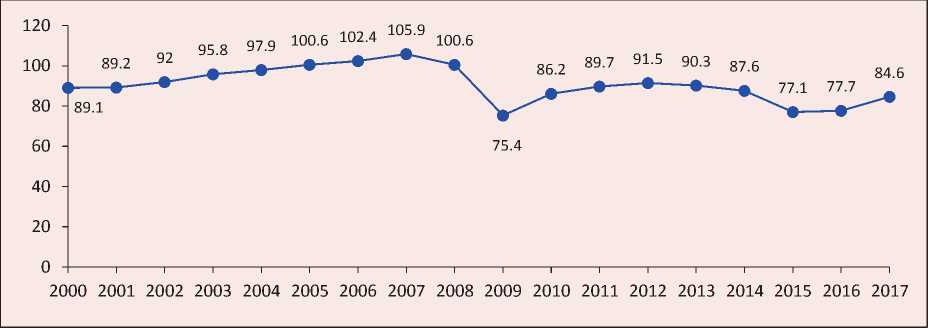
Source: VolRC RAS monitoring data.
“Primary” private components of CSI can be divided into two groups: 1) indices of the current state (current components), which include the index of the current personal financial situation and the index of expediency of making large purchases, and 2) indices of consumer expectations (components of expectations), namely the index of the prospects of the personal financial situation and the indices of short-term (1 year) and long-term (5 years) prospects of the country’s economy.
If we consider the current components, we can observe a complete synchronization of the dynamics of these two partial indices (Fig. 3) . The most significant falls were observed in 1998–1999 (by 28 and 14 points, respectively), in 2008–2009 (by 30 and 23 points), and in 2014–2015 (by 9 and 15 points). In 2016–2017, the situation began to change for the better, but it is too premature to talk about sustainable growth due to the continuing economic and political instability and uncertainty of prospects
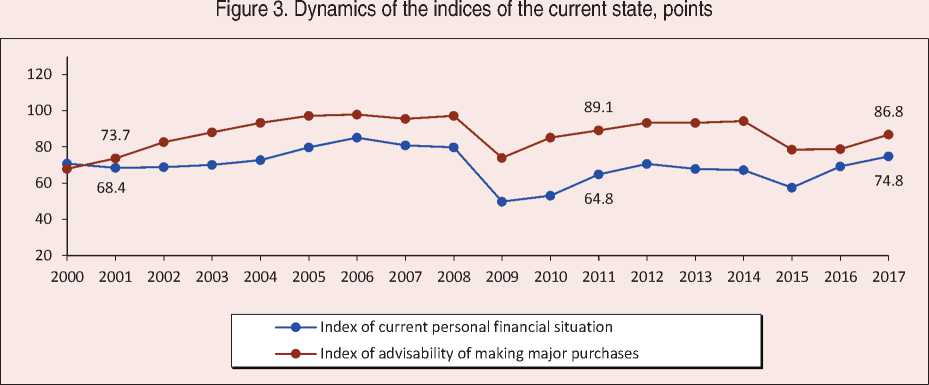
Source: VolRC RAS monitoring data.
Source: VolRC RAS monitoring data.
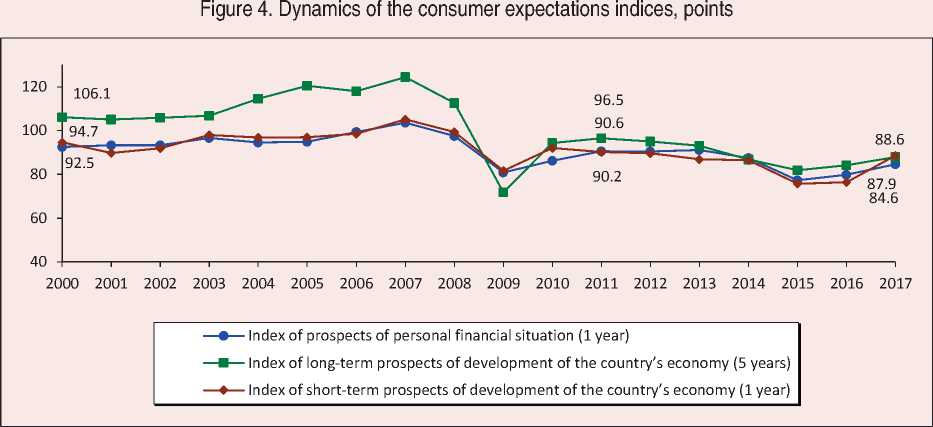
We can compare the analysis of the components of expectations included in CSI with each other in two aspects: on the one hand, expectations related to the “personal” and “public”, the time horizon of which is the same (for a year); on the other hand, the estimates of “social prospects” (in a year and in five years), i.e., short-term and long-term expectations for development of the country’s economy (Fig. 4).
The annual expectations regarding the country’s own financial and economic situation are quite close to each other – the corresponding indices practically coincide. As for the assessment of public prospects for one year and five years, we would like to note the following. First, it is the synchronicity of the dynamics of the two curves, reflecting the short-and long-term economic expectations of consumers. Second, there is a noticeable gap between the two indices: the level of people’s assessment of the five-year prospects for the country’s economic development throughout the observed period remains significantly higher than annual expectations. In addition, it is the only index of the consolidated CSI, the values of which are closest to the threshold of 100 points, and sometimes exceed it. Such a situation is explained not only by national traditions of belief in a “better tomorrow”, but also by quite practical reasons related to the realities of the present – the low standard of living and quality of life of a large part of the population of the region, the lack of a sense of stability, etc.
Thus, the main trends in the consumer sentiment index and its constituent private indices in the region indicate the presence of similar dynamics in the indicators under consideration and allow us to talk about the correlation between the perception of the current state and future expectations. At the same time, long-term forecasts for the development of the country’s economy look more optimistic than the estimates of the current state and short-term prospects.
Impact of macroeconomic indicators on consumer sentiment
Being a synthetic indicator, CSI reflects a wide range of purely economic, political, social and other phenomena and processes taking place in the social life of the country and the region.
Since the changes in consumer sentiment can have a significant impact on the economy of regions and the country as a whole, there is a need to determine the factors that affect consumer sentiment. It is obvious that the mood of a person as a consumer is formed primarily under the influence of economic factors, more precisely, those that directly or indirectly affect his/her budget, purchasing power, material consumption: the factors include the general economic situation in the region, the sectoral structure of employment, features of regional socio-economic policy, state revenue policy, inflation level, retail trade, etc.
The undoubted advantage of the index method is the ability to use mathematical tools for a more in-depth analysis and assessment of the situation. In this regard, we use multiple regression analysis to study the impact indicators characterizing the socio-economic development, standard of living and quality of life of the Vologda Oblast residents on their consumer behavior.
In the course of our research, we build and test autoregressive distributed lag models (ARDL models) on the basis of statistical data and sociological surveys over the period from 2000 to 2017. The time series were made stationary through the use of a chain growth rate of the analyzed indicators. The stationarity test was carried out using the Dickey–Fuller test (see Appendix).
We used several criteria to verify the adequacy of the model: autocorrelation criteria in residuals (Ljung–Box tests), tests to check the normality of distribution of residuals (Shapiro– Wilk tests). Among the adequate models, we selected a model with the fewest number of parameters using the Akaike information criterion (AIC) and the Schwarz information criterion (BIC) [30].
We used R-Studio software product and MS Excel spreadsheets for data analysis and visualization.
We took the following private components of the index of consumer sentiment as explained variables: the index of the current personal financial situation (Y1t), the index of expectations of changes in the personal financial situation (Y2t), the index of expediency of making large purchases (Y3t), the index of short-term prospects of development of the country’s economy (1 year) (Y4t), the index of long-term prospects of development of the country’s economy (5 years) (Y5t) (Tab. 5) .
We used the following macroeconomic indicators as explanatory factor variables: real disposable money income (X1t), retail trade turnover of non-food products (X2t), retail trade turnover of food products (X3t), retail trade turnover (X4t), the index of industrial production in the Vologda Oblast (X5t), consumer price index (X6t) (Tab. 6) .
As a result of the multicollinearity test, factor X4t (retail turnover, % of the corresponding period of the previous year in comparable prices) was excluded from consideration, because it has a high cross-correlation with other explanatory variables (correlation coefficient is above 0.75):
|
Factor |
X 1t |
X 2t |
X 3t |
X 4t |
X 5t |
X 6t |
|
X1t |
1.00 |
|||||
|
X 2t |
0.66 |
1.00 |
||||
|
X 3t |
0.71 |
0.45 |
1.00 |
|||
|
X4t |
0.81 |
0.84 |
0.86 |
1.00 |
||
|
X5t |
0.64 |
0.29 |
0.56 |
0.50 |
1.00 |
|
|
X6t |
0.27 |
-0.03 |
0.47 |
0.25 |
0.26 |
1.00 |
Table 5. Dynamics of the private components of CSI (in % to the previous year)
|
Year |
Index of the current personal financial situation, Y1t |
Index of expectations of changes in the personal financial situation, Y2t |
Index of expediency of making large purchases, Y3t |
Index of short-term prospects of development of the country’s economy (1 year), Y4t |
Index of long-term prospects of development of the country’s economy (5 years), Y5t |
|
2000 |
171.0 |
138.3 |
147.6 |
182.0 |
128.8 |
|
2001 |
96.6 |
99.8 |
108.5 |
99.0 |
94.7 |
|
2002 |
100.6 |
101.1 |
112.1 |
100.9 |
102.5 |
|
2003 |
101.7 |
103.5 |
106.5 |
100.8 |
106.6 |
|
2004 |
103.9 |
97.9 |
106.0 |
107.2 |
98.8 |
|
2005 |
109.6 |
100.3 |
104.1 |
105.2 |
100.2 |
|
2006 |
106.8 |
105.0 |
100.8 |
97.8 |
101.6 |
|
2007 |
94.9 |
104.0 |
97.5 |
105.5 |
106.6 |
|
2008 |
98.8 |
94.1 |
101.8 |
90.5 |
94.5 |
|
2009 |
62.4 |
83.0 |
76.0 |
63.8 |
82.3 |
|
2010 |
106.4 |
106.6 |
115.3 |
131.3 |
112.6 |
|
2011 |
122.3 |
105.1 |
104.6 |
102.3 |
98.0 |
|
2012 |
109.0 |
99.8 |
104.7 |
98.4 |
99.3 |
|
2013 |
96.2 |
101.7 |
100.0 |
98.0 |
97.0 |
|
2014 |
98.8 |
95.2 |
101.1 |
93.2 |
99.5 |
|
2015 |
85.7 |
88.3 |
83.2 |
87.2 |
94.7 |
|
2016 |
120.3 |
103.2 |
100.4 |
100.9 |
102.8 |
|
2017 |
108.1 |
106.0 |
110.2 |
115.9 |
104.4 |
|
Source: VolRC RAS monitoring data. |
|||||
Table 6. Dynamics of indicators of socio-economic development in the Vologda Oblast (in % to the previous year)
Year Real disposable money income, X1t Retail trade turnover of nonfood products, X2t Retail trade turnover of food products, X3t Retail trade turnover, X4t Index of industrial production in the Vologda Oblast, X5t Consumer price index, X6t 2000 113.9 95.6 125.9 112.7 107.7 119.7 2001 103.9 115.1 108.5 111.0 99.5 115.4 2002 110.2 120.8 104.6 110.1 104.2 113.1 2003 108.3 108.8 107.3 107.9 103.3 113.1 2004 105.5 113.7 102.6 106.8 106.6 111.8 2005 106.4 117.7 94.6 103.7 105.9 111.3 2006 122.4 125.0 109.6 117.7 105.2 109.2 2007 109.6 119.4 115.6 117.2 103.0 112.7 2008 100.4 111.4 106.2 108.5 95.3 114.3 2009 90.0 89.4 89.1 89.4 90.5 107.2 2010 108.2 114.9 117.2 116.3 111.8 109.2 2011 100.9 113.8 102.8 107.9 105.6 105.7 2012 110.6 125.9 114.9 119.7 101.3 106.0 2013 105.6 103.5 100.1 101.7 102.5 107.2 2014 102.3 100.3 103.8 102.0 103.7 112.0 2015 97.2 87.4 92.5 90.3 102.6 112.0 2016 98.8 92.8 92.9 92.8 99.1 105.0 2017 92.2 104.6 104.2 103.6 101.0 102.2 Source: data of the territorial office of the Federal State Statistics Service in the Vologda Oblast. Available at:
Econometric modeling often uses the impact of factors on the resultant variable; this impact is not instantaneous, but happens with some delay. Among the reasons, which can cause the delay we can allocate institutional, technological factors, etc. The emerging time lag can include the following components:
– information processing time;
– information transfer time;
– time to implement the decision;
– time to obtain visible effect [31].
Inertia is expressed in the fact that past events have an impact on present and future events.
In the framework of our study, we included lagged dependent variables Xt-1 in the model. This is quite reasonable, since the dependent variable is influenced not only by the current values of the explanatory factor, but also by its lags, namely the consumer sentiment can depend not only on the macroeconomic indicators in the current year, but also on the indicators taken at previous time points.
The distributed lag model can be estimated using the common method of least squares (MLS):
yt = a + b0xt + b1xt–1 + ε t. (1)
However, this model should be distinguished from the autoregressive distributed lag model (ARDL model):
yt = a + b0xt + b1yt–1 + b2xt–1 + ε t (2)
In the model (1), the regressors are not correlated with the errors, so it can be estimated using the method of least squares. In the model (2), yt–1 includes ε t-1, so the error vector ε and the matrix of regressors X are correlated. It follows that the MLS estimates are not unbiased.
The application of MLS to distributed lag models can be difficult due to the following reasons:
-
1) in the case of the tendency of explanatory variables, which causes the multicollinearity of factors;
-
2) due to the autocorrelation of residuals, since the regression is based on time series.
However, the above-mentioned reasons in our paper were eliminated by bringing the time series under consideration to a stationary form by using chain growth rates of the indices and macroeconomic factors that we analyzed.
In the course of our study, we tested several autoregressive distributed lag models on the basis of data for the period from 2000 to 2017. The models we constructed reflect the dependence of consumer sentiment of the Vologda Oblast residents on the indicators that characterize socio-economic development, living standards and the quality of life.
The results of the simulation we carried out are presented in Table 7 .
According to the econometric analysis, the index of retail trade turnover of non-food products exerted positive influence on the indices of the current state (the index of the current personal financial situation and the index of expediency of making large purchases) in the current period and negative influence – in the previous period. This is due to the fact that if the sales of non-food products for the year increased significantly, then people are likely to assess this situation as favorable in terms of their own material well-being and the purchase of durable goods. Negative dependence can be interpreted if we pay attention to the specifics of the interaction between the conditions for the purchase of durable goods and people’s savings. In Russia, in order to make an expensive purchase, in most
Table 7. ARDL models showing the dependence of consumer sentiment on the indicators characterizing socio-economic development of the region
|
Factors |
Index of the current personal financial situation, Y1 |
Index of expectations of changes in the personal financial situation, Y2 |
Index of expediency of making large purchases, Y3 |
Index of shortterm prospects of development of the country’s economy (1 year), Y4 |
Index of longterm prospects of development of the country’s economy (5 years), Y5 |
|
Х1t |
|||||
|
Х1t-1 |
|||||
|
X 2t |
0.71** |
0.68*** |
0.41. |
||
|
X2t-1 |
-0.58** |
-0.38* |
-0.44* |
||
|
X 3t |
0.61* |
0.33* |
|||
|
X3t-1 |
-0.23* |
||||
|
X4t |
|||||
|
X4t-1 |
|||||
|
X5t |
0.81. |
1.72** |
0.65* |
||
|
X5t-1 |
2.17*** |
||||
|
X6t |
-1.31* |
||||
|
X6t-1 |
|||||
|
Yt-1 |
-0.41** |
||||
|
R2 – determination coefficient |
0.58 |
0.77 |
0.79 |
0.87 |
0.90 |
|
N –number of observations |
17 |
17 |
17 |
17 |
17 |
|
Autocorrelation in residuals (Box-Ljung test) |
X-squared = 2.1011, p-value = 0.1472 Absent |
X-squared = 0.24791, p-value = 0.6185 Absent |
X-squared = 3.0495, p-value = 0.08076 Absent |
X-squared = 4.1919, df = 2, p-value = 0.123 Absent |
X-squared = 0.26768, p-value = 0.6049 Absent |
|
Normality of distribution of residuals (Shapiro-Wilk normality test) |
W = 0.98878, p-value = 0.998 Present |
W = 0.92019, p-value = 0.1303 Present |
W = 0.96117, p-value = 0.6536 Present |
W = 0.93633, p-value = 0.2772 Present |
W = 0.9679, p-value = 0.7808 Present |
|
* ,**, *** – significance at the 10% 5% and 1% level, respectively. |
|||||
cases it is necessary to accumulate certain cash savings, so the increase in the sales of non-food products in the past year adversely affects the sentiment in the current year.
The index of industrial production also has a positive impact on the index of the current financial situation and a negative impact on the growth of prices (consumer price index). This is due to the fact that actual events in the economy (production growth, inflation) affect the financial situation of consumers and are reflected in their minds, which ultimately manifests itself in the dynamics of the corresponding index.
Consumer expectations indices (index of expectations of changes in the personal financial situation, indices of short-term and long-term prospects of development of the country’s economy) are affected by the changes in the same macroeconomic indicators (retail trade turnover, industrial production index, consumer price index). This is largely due to the inertia of consumer expectations, and also due to the fact that the dynamics of their expectations are determined by the dynamics of past assessments, i.e., the trends noted in the past are transferred to the future.
In general, the analysis of the relationship between the components of the consumer sentiment index and the real indicators of macroeconomic development of the region leads to the conclusion that this relationship is present and is quite significant. This indicates that people perceive adequately the events that are taking place in the economy and are sensitive to their changes.
Conclusions
The construction and use of indices as generalizing (integral) indicators can provide a comprehensive representation of complex social and economic phenomena and processes.
The index approach, which is an effective tool for processing sociological data, provides a number of unique opportunities for the study and evaluation of consumer sentiment in the given territory.
First, integral indices provide information on the dynamics of people’s optimism in relation to economic and social development in the region or country as a whole. Indices do not show absolute values (i.e. prevalence) of the corresponding estimations and opinions, but they reflect a measure or degree of their “positivity” (sign) in any time or group comparisons [32]. The use of the index method helps identify the ratio of positive and negative attitudes in society, register “critical points” in public opinion, analyze fluctuations and changes in the index over time, comparing it with other socio-political and economic processes taking place in society [33].
Second, by calculating the indices with the use of a comparable methodology, it is possible to analyze consumer sentiment of residents in different territories – countries, federal districts, individual regions, and it is possible to carry out interregional and inter-country comparisons of such sentiment in order to assess the overall socio-economic situation, as well as the standard of living and quality of life in a certain territory.
Third, the use of the index approach provides researchers with ample opportunities to use mathematical tools for modeling the data of official statistics and sociological surveys and for a more in-depth analysis and assessment of the situation. The combination of the index approach with mathematical methods and techniques allows us to identify factors that influence consumers’ mass consciousness and this, in turn, helps predict changes in consumer activity and economic development of the territory.
In addition, the indices and their components can be obtained more quickly than the macroeconomic indicators provided by official statistics and characterizing the external environment for consumer action. Therefore, the indices serve as unique indicators for independent non-state examination of the economic policy of the state and implementation of an integrated approach to assessing the effectiveness of public administration [34].
Our analysis of the dynamics of CSI and its constituent private indices at the national and regional level for the period from 2000 to 2017 allows us to conclude that during the periods of accelerated socio-economic transformations, in particular, economic crises, such indices promptly respond to changes in the social environment and objectively reflect and to some extent predict the development of events.
Having conducted the regression analysis, we find out quite a significant correlation between the components of the consumer sentiment index and the real indicators of macroeconomic development of the region (retail trade turnover, industrial production index, consumer price index). This suggests that the changes in the economic situation, reflected in the moods, estimates, expectations and intentions of the population, affect consumer activity, choice and change of consumer strategies, which, in turn, directly affects economic development in the territory.
The use of the indices under consideration in the studies of consumer behavior provides a rare opportunity to take into account psychological factors in the modeling and forecasting of the economy; this helps identify the trends of the socio-economic situation in time and, on this basis, make adjustments to the management of economic processes.
Appendix
Multiple regression models for the index of current personal financial situation (%of the previous year) and macroeconomic indicators
Call:
lm(formula = Y1 ~ Lag(Y1, 1) + Lag(X2, 1) + X2 + Lag(X5, 1) + X6, data = Book)
Residuals:
|
Min |
1Q .4532 |
Median 0.1003 3. |
3Q 9037 10. |
Max 8546 |
|
|
-12.4490 |
-4 |
||||
|
Coefficients: |
|||||
|
Estimate |
Std. Error |
t value |
Pr(>|t|) |
||
|
(Intercept) |
49.4573 |
60.3880 |
0.819 |
0.430178 |
|
|
Lag(Y1, |
1) |
-0.4085 |
0.1082 |
-3.774 |
0.003078 ** |
|
Lag(X2, |
1) |
-0.5780 |
0.1642 |
-3.521 |
0.004788 ** |
|
X2 |
0.7121 |
0.1661 |
4.287 |
0.001283 ** |
|
|
Lag(X5, |
1) |
2.1674 |
0.4752 |
4.561 |
0.000815 *** |
|
X6 |
-1.3066 |
0.4923 |
-2.654 |
0.022415 * |
|
|
--- Signif. |
code |
s: 0 ‘* |
**’ 0.001 ‘ |
**’ 0.01 |
‘*’ 0.05 ‘.’ 0.1 ‘ ’ 1 |
Residual standard error: 6.992 on 11 degrees of freedom
(1 observation deleted due to missingness)
Multiple R-squared: 0.8145,..........Adjusted R-squared: 0.7301
F-statistic: 9.658 on 5 and 11 DF, p-value: 0.0009655
Tests for autocorrelation and normality of distribution of residuals
Box-Ljung test data: residuals(m1)
X-squared = 2.1011, df = 1, p-value = 0.1472
Shapiro-Wilk normality test data: residuals(m1)
W = 0.98878, p-value = 0.998
Multiple regression models for the expectations of changes in one’s personal financial situation (%of the previous year) and macroeconomic indicators
Call:
lm(formula = Y2 ~ X3 + X5, data = Book) Residuals:
Min 1Q Median 3Q Max
-9.768 -5.116 -1.357 2.468 17.314
Coefficients:
|
Estimate |
Std. Error |
t value |
Pr(>|t|) |
|
|
(Intercept) |
-45.4117 |
35.8578 |
-1.266 |
0.2247 |
|
X3 |
0.6055 |
0.2220 |
2.728 |
0.0156 * |
|
X5 |
0.8123 |
0.4213 |
1.928 |
0.0730 . |
Signif. codes: 0 ‘***’ 0.001 ‘**’ 0.01 ‘*’ 0.05 ‘.’ 0.1 ‘ ’ 1
Residual standard error: 7.186 on 15 degrees of freedom Multiple R-squared: 0.6255,..........Adjusted R-squared: 0.5756
F-statistic: 12.53 on 2 and 15 DF, p-value: 0.0006321
Tests for autocorrelation and normality of distribution of residuals
Box-Ljung test data: residuals(m2)
X-squared = 0.24791, df = 1, p-value = 0.6185
Shapiro-Wilk normality test data: residuals(m2)
W = 0.92019, p-value = 0.1303
Multiple regression models for the index of the advisability of making major purchases (as % of the previous year) and macroeconomic indicators
Call:
lm(formula = Y3 ~ Lag(X2, 1) + X2, data = Book)
Residuals:
Min 1Q Median 3Q Max
-11.212 -5.104 1.816 3.4559.562
Coefficients:
Estimate Std. Error t value Pr(>|t|)
(Intercept) 68.0563 17.6538 3.855 0.001750**
Lag(X2, 1) -0.3769 0.1413 -2.668 0.018389*
X2 0.6840 0.1465 4.667 0.000363***
---
Signif. codes: 0 ‘***’ 0.001 ‘**’ 0.01 ‘*’ 0.05 ‘.’ 0.1 ‘ ’ 1
Residual standard error: 6.393 on 14 degrees of freedom
(1 observation deleted due to missingness)
Multiple R-squared: 0.619, ........... Adjusted R-squared: 0.5645
F-statistic: 11.37 on 2 and 14 DF, p-value: 0.001166
Tests for autocorrelation and normality of distribution of residuals
Box-Ljung test data: residuals(m3)
X-squared = 3.0495, df = 1, p-value = 0.08076
-
> shapiro.test(residuals(m3))
Shapiro-Wilk normality test data: residuals(m3)
W = 0.96117, p-value = 0.6536
Multiple regression models for the index of short-term (1 year) development prospects of the country’s economy (in % to the previous year) and macroeconomic indicators
|
Call: lm(formula = Y4 ~ Lag(X2, 1) + |
X2 |
+ X5, |
data = Book) |
|
Residuals: Min 1Q Median 3Q -9.245 -4.004 -1.888 4.888 13. Coefficients: |
Max 300 |
||
|
Estimate Std. Error |
t |
value |
Pr(>|t|) |
|
(Intercept) -72.4932 46.4455 |
- |
1.561 |
0.14257 |
|
Lag(X2, 1) -0.4405 0.1720 X2 0.4008 0.2011 X5 1.7232 0.4659 |
- |
2.562 1.993 3.699 |
0.02367 * 0.06766 . 0.00268 ** |
Signif. codes: 0 ‘***’ 0.001 ‘**’ 0.01 ‘*’ 0.05 ‘.’ 0.1 ‘ ’ 1
Residual standard error: 7.38 on 13 degrees of freedom
-
( 1 observation deleted due to missingness) Multiple R-squared: 0.7617,..........Adjusted R-squared: 0.7068
F-statistic: 13.85 on 3 and 13 DF, p-value: 0.0002417
Tests for autocorrelation and normality of distribution of residuals Box-Ljung test data: residuals(m4)
X-squared = 4.1919, df = 2, p-value = 0.123
-
> shapiro.test(residuals(m4))
Shapiro-Wilk normality test data: residuals(m4)
W = 0.93633, p-value = 0.2772
Multiple regression models for the index of long-term (5 years) development prospects of the country’s economy (in % to the previous year) and macroeconomic indicators
Call:
lm(formula = Y5 ~ Lag(X3, 1) + X3 + X5, data = Book)
Residuals:
Min 1Q Median 3Q Max
-4.6284 -2.2355 0.0751 2.1033 5.8870
Coefficients:
|
(Intercept) Lag(X3, 1) X3 X5 |
Estimate 23.18491 -0.22934 0.32766 0.65088 |
Std. Error t value |
Pr(>|t|) 0.3663 0.0307 0.0174 0.0110 |
* * * |
|
|
24.77036 0.09464 - 0.12029 0.21954 |
0.936 2.423 2.724 2.965 |
||||
|
— Signif. codes: 0 ‘***’ 0.001 ‘**’ |
0.01 |
‘*’ 0.05 |
‘.’ 0.1 ‘ ’ 1 |
||
Residual standard error: 3.498 on 13 degrees of freedom
(1 observation deleted due to missingness) Multiple R-squared: 0.7714,..........Adjusted R-squared: 0.7186
F-statistic: 14.62 on 3 and 13 DF, p-value: 0.0001857
Tests for autocorrelation and normality of distribution of residuals
Box-Ljung test data: residuals(m5)
X-squared = 0.26768, df = 1, p-value = 0.6049
-
> shapiro.test(residuals(m5))
Shapiro-Wilk normality test data: residuals(m5)
W = 0.9679, p-value = 0.7808
References Applying the index method in the research on consumer sentiment
- Uskova T.V., Selimenkov R.Yu., Anishchenko A.N., Chekavinskii A.N. Prodovol'stvennaya bezopasnost' regiona . Vologda: ISERT RAN, 2014. 102 p.
- Rossinskaya G.M. To the methodology for the analysis of economic behavior of consumers. Vestnik Moskovskogo universiteta. Ser. 6: Ekonomika=Moscow University Herald. Series 6: Economics, 2007, no. 6, pp. 72-80..
- Tatarova G.G. Metodologiya analiza dannykh v sotsiologii . Moscow: Nota Bene, 1999. 224 p.
- Pinto R., Grawitz M. Metody sotsial'nykh nauk . Moscow: Progress, 1972. 607 p.
- Noelle E. Massovye oprosy. Vvedenie v metodiku demoskopii . Moscow: Ava-Estra, 1993. 272 p.
- Suppes P., Zinnes J.L. Basic measurement theory. In: Psikhologicheskie izmereniya: sb. . Moscow: Mir, 1967. Pp. 9-110.
- Pfantzagl J. Teoriya izmereniya . Moscow: Mir, 1976. 248 p.
- Tolstova Yu.N. Analiz sotsiologicheskikh dannykh. Metodologiya, deskriptivnaya statistika, izuchenie svyazei mezhdu nominal'nymi priznakami . Moscow: Nauchnyi mir, 2000. 352 p.
- Devyatko I.F. Metody sotsiologicheskogo issledovaniya . Moscow: KDU, 2009. 296 p.
- Kosolapov M.S. Classification of methods of spatial representation of the structure of initial data. Sotsiologicheskie issledovaniya=Sociological Studies, 1976, no. 2, pp. 98-109..
- Osipov G.V., Andreev E.P. Metody izmereniya v sotsiologii . Moscow: Nauka, 1977. 184 p.
- Gorshkov M.K., Sheregi F.E. Prikladnaya sotsiologiya: metodologiya i metody: interaktivnoe uchebnoe posobie . Moscow: Institut sotsiologii RAN, 2011. 372 p.
- Gerasimova K.G. Sociological indices: methodological reflection on the construction patterns. Vestnik RUDN. Seriya: Sotsiologiya=RUDN Journal of Sociology, 2017, vol. 17, no. 1, pp. 106-115..
- Tikhonova N.E., Davydova N.M., Popova I.P. Index of the Standard of Living and the Model of Stratification of the Russian Society. Sotsiologicheskie issledovaniya=Sociological Studies, 2004, no. 6, pp. 120-130.
- Mtiulishvili P.I. Index of social sentiment and the indicators of protest potential of the population. Monitoring obshchestvennogo mneniya=Public Opinion Monitoring, 2010, no. 6, pp. 55-64..
- Krasil'nikova M.D. Integral indicators of social well-being. Vestnik obshchestvennogo mneniya=Bulletin of Public Opinion, 2011, no. 13, pp. 109-117..
- Klimova S.G., Galitskaya E.G., Galitskii E.B. Innovative behavior at work: the experience of building a sociological index. Monitoring obshchestvennogo mneniya=Public Opinion Monitoring, 2010, no. 5, pp. 5-15..
- Dement'eva I.N. Experience of index method application in sociological research. Monitoring obshchestvennogo mneniya=Public Opinion Monitoring, 2014, no. 4, pp. 15-23..
- Katona G. Psychological Analysis of Economic Behaviour. New York: McGrow-Hill, 1951. 383 p.
- Katona G. Psychological Economics. New York: Elsevier, 1975. 398 p.
- Curtin R. Consumer sentiment surveys: worldwide review and assessment. Business Cycle Measurement and Analysis, 2007, no. 11, pp. 1-37.
- Camerer C.F., Loewenstein G., Rabin M. (Eds.). Advances in Behavioral Economics. Princeton University Press, 2011. 768 p.
- Sent E.-M. Behavioral economics: how psychology made its (limited) way back into economics. History of Political Economy, 2004, vol. 36, no. 4, pp. 735-760.
- Ibragimova D.Kh., Nikolaenko S.A. Indeks potrebitel'skikh nastroenii . Moscow: Pomatur, 2015. 263 p.
- Kapelyushnikov R.I. Povedencheskaya ekonomika i novyi paternalizm: preprint . Moscow: Izd. dom Vysshei shkoly ekonomiki, 2013. 76 p.
- Krasil'nikova M.D. Studying social sentiment and consumer behavior of the population of Russia. Problemy prognozirovaniya=Studies on Russian Economic Development, 2003, no. 2, pp. 124-134..
- Gulin K.A., Novozhilov S.A. Dynamics of consumer sentiment of the Vologda Oblast population in 2000. Ekonomicheskie i sotsial'nye peremeny v regione: fakty, tendentsii, prognoz=Economic and Social Changes in the Region: Facts, Trends, Forecast, 2001, no. 14, pp. 29-40..
- Grishina E.N, Trusova L.N. Assessing consumer expectations and consumer sentiment in Russia. Ekonomika i upravlenie v XXI veke: tendentsii razvitiya=Economics and Management in the 21st Century: Development Trends, 2014, no. 19, pp. 188-191..
- Dement'eva I.N. Consumer sentiment of the population and its impact on the economic development of the regional community. Pskovskii regionologicheskii zhurnal= Pskov Journal of Regional Studies, 2018, no. 1 (33), pp. 40-52..
- Aivazyan S.A., Fantatstsini D. Ekonometrika-2: prodvinutyi kurs s prilozheniyami v finansakh . Moscow: INFRA-M, 2014. 944 p.
- Sazhin Yu.V., Ivanova I.A. Ekonometrika . Saransk: Izd-vo Mordov. un-ta. 2014. 316 p.
- Ilyin V.A., Gulin K.A. Consumer sentiment index: trends and prospects of socio-economic development in the estimates of the population of the Vologda Oblast in 1997. Ekonomicheskie i sotsial'nye peremeny v regione: fakty, tendentsii, prognoz=Economic and Social Changes in the Region: Facts, Trends, Forecast, 1997, no. 4, pp. 73-93..
- Shabunova A.A., Dement'eva I.N. About the crisis, consumption and social policy of the state. Problemy razvitiya territorii=Problems of Territory's Development, 2017, no. 3 (89), pp. 7-22..
- Ilyin V.A., Shabunova A.A. Sociological assessment of public administration efficiency. Ekonomicheskie i sotsial'nye peremeny: fakty, tendentsii, prognoz=Economic and Social Changes: Facts, Trends, Forecast, 2014, no. 2 (32), pp. 18-35..
