Arterial Parameters and Elasticity Estimation in Common Carotid Artery Using Deep Learning Approach

Author: Anoop Kumar Patel, Sanjay Kumar Jain
Journal: International Journal of Image, Graphics and Signal Processing @ijigsp
Article in issue: 11 vol.11, 2019.
Free access
The risk of cardiovascular diseases is growing worldwide, and its early detection is necessary to reduce the level of risk. Structural parameters of the carotid artery as intima-media thickness and functional parameters such as arterial elasticity are directly associated with cardiovascular diseases. Segmentation of the carotid artery is required to measure the structural parameters and its temporal value that is used to estimate the arterial elasticity. This paper has two primary objectives: (i) Segmentation of the sequence of carotid artery ultrasound to measure temporal value of intima-media thickness and lumen-diameter, and (ii) Young’s modulus of elasticity estimation. The proposed segmentation method uses the contextual feature of the image pattern and is based on multi-layer extreme learning machine auto-encoder network. This segmentation method has two parts: (a) region of interest localization and (b) lumen-intima interface and media-adventitia interface detection at the far wall. ROI localization algorithm divides the ultrasound frame into columns and also divides each column into overlapping blocks, ensuring that every column has a region of interest block. A multi-layer extreme learning machine with auto-encoder is trained with labelled data and in testing; system classifies the blocks into ‘region of interest’ and ‘non-region of interest’. Pixels belonging to the region of interest are classified in the first part and a similar network-based method is proposed for lumen-intima and media-adventitia interface detection at the near wall of the carotid artery. Structural parameter of the artery, intima-media thickness and lumen diameter are measured in a sequence of images of the cardiac cycle. The temporal values of structural parameters are used to estimate the young’s modulus of elasticity.
Carotid Artery Segmentation, Extreme Learning Machine, Cardiovascular Disease, Auto-encoder, Overlapping block
Short address: https://sciup.org/15017047
IDR: 15017047 | DOI: 10.5815/ijigsp.2019.11.03
Text of the scientific article Arterial Parameters and Elasticity Estimation in Common Carotid Artery Using Deep Learning Approach
The principal cause of disease based mortality worldwide is cardiovascular diseases (CVD) [1]. Consequences of the pathological process in the carotid artery give rise to a special CVD, known as atherosclerosis. Fundamental cause behind the initialization of the cardiovascular diseases is the repercussion of biochemical changes in the coronary and carotid artery over time [2]. The biochemical changes in carotid artery lead to the change in physical parameters such as intima-media thickness (IMT), lumen diameter (LD) and arterial elasticity [3]. IMT and arterial elasticity has clinical significance and have the potential to diagnose the disease [4, 5]. IMT and arterial elasticity of common carotid artery (CCA) show a significant change in its value at the early stage of atherosclerotic disease.
IMT in CCA is defined as the distance from lumenintima (LI) interface to the media-adventitia (MA) interface in the far wall and it is shown in Fig. 1. In general, measurement of IMT is performed by a doctor manually who observes and marks the points corresponding to the LI interface and MA interface in the carotid ultrasound. Manual observation, extraction, and estimation of IMT in CCA ultrasound have subjectivity. An algorithmic automatic method of computing the IMT in CCA ultrasound can overcome this subjectivity [6]. Arterial elasticity is another important parameter of the carotid artery, associated with CVD [5]. Arterial elasticity of CCA is a functional parameter and it is defined as the capacity to oppose the expansion and contraction while pressure is applied, and it leads to high blood pressure [7]. The artery is anisotropic, and it has deformation in all the three directions during a change in pressure; circumferential, radial and longitudinal. Circumferential elasticity (in terms of Young's Modulus of Elasticity) can be defined with the help of temporal value of arterial parameters such as IMT, LD and arterial pressure [8].
There is a number of invasive and non-invasive ways artery, but non-invasive methods are always desired [9]. to estimate the Young's Modulus of Elasticity of the
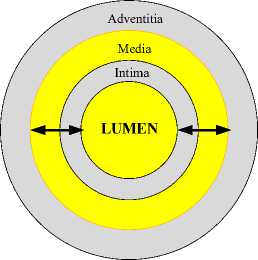
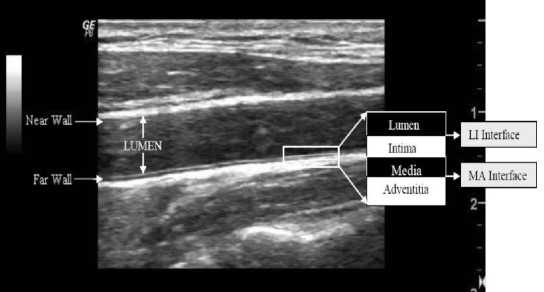
Fig. 1. The cross-sectional view of carotid artery wall (left) and longitudinal view of the carotid artery of B-mode ultrasound image (right).
Image-based arterial elasticity estimation is one of the non-invasive approaches, and the ultrasound image is preferred due to its specific nature. Ultrasound imaging techniques are cheap, non-invasive and user-friendly unlikely the other modality of imaging [10]. The ultrasound image has fast reconstruction ability; that's why it shows real-time visualization. The ultrasound is commonly used for its flexible nature and low-cost availability.
In this paper, we have proposed an ELM-AE based CCA segmentation methods. IMT and LD of the CCA are estimated in a sequence of frame of the videos. We have also collected the minimum and maximum value of IMT and LD from the sequence of frames over the cardiac cycle. It is also noticed that IMT has its maximum value when LD shows it’s minimum and vice versa. Arterial elasticity of CCA is defined in terms of the estimated IMT and LD value as shown in Eq. 7. The paper is organised in six basic sections. Brief introduction of disease and its biomarker is discussed in section I. Section II covers the data collection procedure for proposed research and method used for segmentation of CCA image frame. It also discusses Young’s modulus of elastic of CCA. The proposed approach of CCA segmentation and elasticity estimation is presented in section III. Results and performance of the proposed system is discussed in the section IV. A brief discussion on the related works and the proposed method has been done in section V. The paper concludes in section VI.
-
II. Data and Methods
This section contains three subsections. Subsection A briefs on image data collection, subsection B gives on extreme learning machine, and subsection C explains Young's modulus of elasticity.
-
A. Image Data Collection
The research work presented in this paper uses four ultrasound videos of the common carotid artery and each video consist of at least 5 cardiac cycles. These videos were captured using a GE lagiq 6 pro ultrasound system with three different ultrasound probes on frequency range
2-5 MHz in B-mode. The Prerna Diagnostic Centre at Kurukshetra, Haryana India, provided the videos for our research. We generate 790 ultrasound frames from the four videos at the rate of 20 frames/second. The radiologist of the diagnostic centre observed and estimated minimum and maximum values of IMT and LD of the carotid artery. These values of arterial parameters are used as ground truth.
-
B. Extreme learning machine
An extreme Learning Machine (ELM) is an elementary single layer feed-forward neural networks (SLFN). It has randomly generated hidden nodes and the numbers of nodes at hidden layers depend on the nature of training data [11, 12]. It has great generalization potential that minimizes data processing time. ELM has very fast training capability because it does not train the system iteratively and always has faster than the traditional neural network-based algorithm [12]. The number of parameters required for ELM is less than the number of parameters required for any other single layer feedforward networks [13]. Lets there is given a distinct arbitrary sample of N values ( xi, ti ), where xi is the input value and t i is the target value of the system. Set of values of x i = [ xi1 , xi2 , x in ] £ R p represent input vector and set of values of t i = [ tn , ti2 , t in ] £ R q represent target vector. If single layer ELM contains M neurons at hidden layer and activation function g(.), then its output y / is mathematically modelled as
y- =E^=1 Pjg(wjx+bj)=oi,i=1.....N (1)
where Pj represents a weight vector and set of values of Pi =[Pji,Pj2,....., Pjm] connects to the jtlh hidden node to the output layer node of the network and bias corresponding to the jth hidden neuron is represented with bj. 0/ represents an output vector of the network corresponding to the input vector xi.
Ideally, a standard feed-forward network of a single layer, having M number of hidden nodes along with g(.) as activation function, approximate, N given samples of target value and output values without an error, means
E /=1 Ho i — t / H = 0, and variables w i , b i , and e i exits in such a way that
S M=1 j ( wjxi+ bj ) = ti, i = 1N (2)
Weights of the input layer of ELM network and its bias are randomly initialized. This machine learning network has linear system architecture, and all the N equations present in Eq. 2 can be represented compactly as
H P = T , (3)
where T represents the target matrix and T E R N^m , в represents the weights matrix of weights of edges from hidden to the output layer and в E R M^m . HE R N^M represents the output matrix produced at the hidden layer and it can be defined as
g ( w1 x + b1) ... g ( w1 x + b1)
H =
g ( w x + b1) ... g ( w1 x + b1)
The training process is basically to reduce the complexity of the solution of the linear system of equations in Eq. 3. The simplest solution with the smallest norm, of Eq. 3, is given by Eq. 5 as
в = H T (5)
where H† represents the Moore–Penrose generalized inverse matrix of H. For improving, the generalization performance and robustness of the system, a constant term C is used as a regularization factor to get the solution [14] and shown below в = | I + HTH | HTT (6)
IC )
ELM has dynamic training capability for SLFN, but its overall performance depends on the nature of the selected features, used to represent the problem. Representationlearning based solution found with accurate classification capability [15]. This perspective of machine learning is based on data representation and auto-encoder. It makes more capable of the system for accurate classification and prediction [15].
The proposed multi-layer neural network with autoencoder increases the recognition capability of the network. The original work on ELM-AE was proposed for solving the problem based on pattern representation and learning [16]. An auto-encoder is an SLFN based unsupervised learning algorithm means an auto-encoder is trained to reconstruct the input in the output (Fig. 2). Weights of edges from the hidden layer nodes to the output layer node of the ELM are estimated during the training of the system using Eq. 5 and Eq. 6. The transpose matrix of estimated weight matrix is used for input to hidden layer in the testing. Based on the number of neurons at hidden layers, compressed data coding and sparse data coding is obtained respectively for less number of neurons at hidden layer and more number of hidden layers compared to the number of neurons in the input layer.
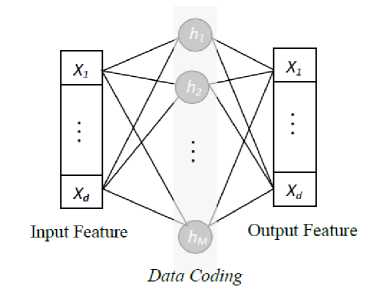
Fig.2. Generic auto-encoder system.
-
C. Young Modulus of elasticity
As arterial elasticity is a biomarker for atherosclerosis disease [17], its non-invasive estimation is desired to diagnose the disease. Ultrasound image-based IMT and LD estimation is a non-invasive method, and Young's modulus of elasticity is defined in terms of the temporal value of arterial parameters; IMT and LD [8]. It also uses Peterson’s elastic modulus ( E p ) to estimate Young’s elasticity modulus and shown in Eq. 7.
Y = m
E xD p min
2 x IMTn .
D min
where Dm/U and IMTDmin are minimum diameter and intima-media thickness when the diameter is minimum, respectively. Ep is computed as Ep = ^^, where DD =
( D max - D m in ) and PP v D min '
is the pulse pressure, calculated as
PP = ( P s - Рй ). P s and Pd represent the systolic blood pressure and diastolic blood pressure, respectively. Dm ax is the maximum and minimum arterial diameter, respectively.
-
III. Proposed Approach
An overview of the architecture of proposed system is presented with the Fig. 3. There are two primary objectives of this system: measurement of IMT and LD, which require the segmentation of CCA followed by arterial contour extraction. CCA segmentation methodology has four necessary steps in order to estimate IMT and LD: (1) Cropping the CCA frames for removing
Raw Ultrasound
Frame
Image cropping
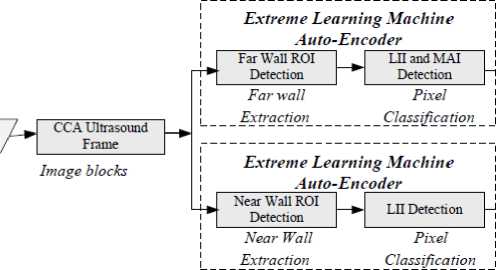
Fig. 3. Proposed method of CCA segmentation for IMT and LD estimation


unwanted region as dark pixels at the boundaries and image de-noising; (2) ROI localization in the cropped frame; (3) Detection of the LII and MAI in the ROI; (4) Measurement of the IMT and LD from the delineated interfaces. Ultrasound frames have additional information at its border that contains patient information and ultrasound specification. This information has no use in arterial parameter estimation. At the first stage, the input frame is pre-processed to crop it for removing the unwanted information at boundaries automatically. All frames are generated from the videos of the same machine, and it has the same approximate coordinate of the unwanted region. The coordinate corresponding to the boundaries of unwanted information are detected automatically using morphological features which have three necessary steps; (i) Initially, binaries the input frame; (ii) Use morphological operations: opening and closing to make it smooth by filling holes and breaks; (iii) Detection of the two horizontal and two vertical coordinate corresponding to the two vertical line and to horizontal line in the binary image frame. Now, these coordinates are used to crop the original image frames. The coordinate of the first frame is used to initialise the process of cropping in the successive frames. Once the first part of pre-processing (cropping and de-noising) completes, it moves for automatic ROI detection that lies at far wall (Fig. 1) of the artery. ROI localization system uses pattern recognition concept. Now, ROI contains pixel belonging to the interfaces (MA and LI) of the far wall. An ELM-AE based fully automatic system is proposed to recognize the pixels corresponding to the MA interface and LI interface in the ROI. ELM-AE has recognition and classification capability. Finally, the outputs of the trained classification system are used to extract the contour containing LI and MA, followed by IMT estimation.
LD is defined as the distance from LI interface of the far wall to the LI interface of near wall. LI interface at the far wall is marked, and its coordinate is recorded during IMT estimation. For extracting the LI interface at the near wall, there is need to define ROI at the near wall that contains LI interface. An overlapping block-based approach is adapted to define near wall ROI, similar to the far wall ROI. ELM-AE based deep network system is used to classify the pixels belonging to the LI interface in the ROI, and its coordinate is recorded. Once the coordinates of LI interface at the near wall and the far wall is recorded, the MAD metric is used to measure the distance between LI interface of both the wall that it is LD. This process of LD estimation is done for a sequence of images of a cardiac cycle, and temporal values of LD is analysed.
-
A. Localization of ROI
In CCA, there are two walls; near-wall and far-wall (Fig. 1). The arterial layer is extracted at the far wall for IMT estimation, and far-wall ROI is defined as the block containing far-wall. Near-wall is also essential to detect LI interface of near-wall that is used to estimate LD of the artery, and at the near wall, ROI is defined as the block containing LI and MA interface including part of lumen. ROI localization is the primary task of the proposed ELM-AE based methodology. Here, the objective of the system is to automatically localise a block of size 42×42 containing arterial layers of the far wall almost at the centre of the block. The proposed system uses the concept of representational-learning based pattern recognition. Representational-learning keeps the feature of the input system to predict the ROI block during testing. Fig. 4 shows an overview of the ROI detection system.
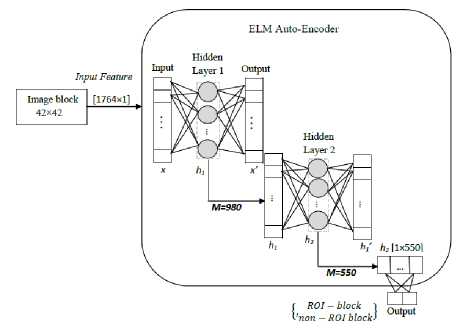
Fig. 4. ROI detection in CCA Ultrasound
Firstly, the cropped frame of size 378×232 is divided into 9 columns having 42 horizontal pixels in each. Each column of the frame is divided into the overlapping block of size 42×42 from top to bottom. From top, the second block has 32 vertical overlapping pixels and 10 nonoverlapping vertical pixels to the first pixel. In each block have 420 non-overlapping features that are used to localize the far wall ROI. There are 1764 input features to ELM-AE system for training and testing. The overlapping block is defined to ensure that there must be a block containing the far wall arterial layer in its centre.
These blocks are marked as ‘ROI-block' if it contains far wall arterial layer and ‘non-ROI-block’ otherwise. The proposed system is trained with manually labelled data, where block size 42 × 42 is provided as input to the system. The adopted block-size ensures that it will contain the whole intima-media complex even if it has thick IMT. The ELM system has an input data with 1764 features out of which 420 features are unique concerning the other block. An intensive search is made to find optimal the number of neurons at the hidden layer for optimal result. Regularization parameter is also tuned for optimal performance with a wide range of comparison, and these values are validated with manually defined data. The optimal number of neurons at first and second hidden layers is 980 and 550. After defining the architecture of the ELM-AE with hidden neurons and regularization factor, all the calculation of weights of edges of the network is done using Eq. 6. These weights are estimated with the help of auto-encoder and weights of edges corresponding to the hidden layer and output layer are estimated using target value during the training. A similar approach is defined for extraction near-wall ROI. Overlapping blocks of size 42×42 is passed to the ELM-AE system having two hidden layers with 980 and 550 neurons. The system is trained with a manually labelled block that is considered in two classes; near-wall ROI-block and near-wall non-ROI block. All the weights of the edges of different layers of the ELM-AE system are estimated, considering SLFN auto-encoder and Eq. 6. In testing, the input blocks are classified as ‘ROI-block’ and ‘non-ROI-block’.
The dataset contains 790 CCA frames where each frame has been divided into 180 blocks out of which 9 blocks are ‘ROI-block’ as each column contains one ROI bock and rest 171 are non-ROI-block’. A similar strategy is defined to detect ROI at the near wall and ROI at the far wall. The algorithm uses 70% data for the training purpose and the remaining 30% for testing. The samples of CCA frames are collected from 4 different videos that are heterogeneous.
-
B. LII and MAI detection in the far wall
Segmentation of ROI for extracting LII and MAI is the task of pixel classification. LII and MAI in the ROI of carotid ultrasound are detected using learning-based representational contextual features of the neighbourhood pixels. To extract the arterial interfaces, a group of neighbouring pixels are considered as a block having size 5×42 where centre pixel (vertically 3rd pixel) belongs to the interface. These blocks of neighbourhood pixels are considered into three different classes: a block containing LII; ‘LII-block’, a block containing MAI; ‘MAI-block’, and NI-block (non-interface block). The ROI region is decomposed into the labelled blocks from top to bottom. The blocks of size 5×42 are overlapping with another block of the same column. There are two non-overlapped vertical pixels in each block which has 82 unique features. These blocks are classified by the representational learning-based classifier to predict the block having LI interface and MA interface. There are two separate systems for LI and MA interface detection as in Fig. 5. Both the systems are a multi-layer ELM where weights of layers are defined by auto-encoder, and complete system is ELM-AE. The intensive search for optimal output estimates the number of neurons at hidden layers and regularization parameters (M and C, respectively). The number of neurons at first, second and third hidden layers are 1000, 1650 and 2500, respectively. The whole system is trained for manually defined labelled blocks. During testing, each block of the ROI is passing to the ELM-AE system, and it predicts the blocks into two classes; ‘LII-block’ and ‘NI-block’. The coordinates of the LI interface are recorded.
Second multi-layer ELM-AE system is designed to detect MA interface in the ROI (Fig. 5). This system has the exact same structure of hidden layer neurons. The system is trained for manually defined labelled blocks. There are 210 input features to the system and weights of edges corresponding to hidden layer and output layer are estimated using auto-encoder (Eq. 6). The network is fixed with the calculated weights during the training. The system categorises pixels into ‘MAI-block' and ‘NI-block' during testing. The coordinates of the MAI is recorded for further processing.
Proposed ELM-AE system is trained with a database of 75 images where the first 25 sequences of the frame from each of three videos are selected. Each image has 9 ROI block, and each ROI is containing 19 overlapping block. A total of 12825 manually labelled block of size 5×42 is collected and used for training. An ROI have one ‘LI-block’, one ‘MA-block' and the remaining 17 ‘NI-block’. Testing is performed with a sequence of 25 image frames, which is selected from the fourth CCA ultrasound video. The reason behind considering 25 sequences of images in testing is to ensure that more than one cardiac cycle is included. The output of the system is validated for 15 images of the testing videos, 5 from each.
The architecture of the ELM-AE system is trained with the layer-wise unsupervised learning manner where 210 input features are provided, and each hidden layer weights is estimated using auto-encoder (Fig. 2) by taking input as output (tn = xn). In Fig. 5, it is shown that the overall system of ELM-AE has three hidden, and each is designed with SLFN auto-encoder. The input feature is mapped in the 2500 dimensions of the new feature. This new feature is used to classify the block as ‘LII-block’ by the first ELM-AE system and ‘MAI-block’ by the second ELM-AE system, with optimal pattern match of feature in a column of 19 blocks. Middle pixel is interpreted as the interface, and its coordinate is recorded to use further.
-
C. LII detection in the near-wall
As we have detected LI and MA interface in the far wall, a similar approach is defined to extract LI interface in near-wall ROI (Fig. 6). Multi-layer ELM-AE system having three hidden layers is tuned for an optimal number of neurons in each hidden layer. The pattern of neurons in the proposed ELM-AE system is 210-1000-1650-2500. Overlapping blocks of neighbourhood pixels size 5×42 is
used for training and testing. Proposed ELM-AE is fixed with its weight using auto-encoder by Eq. 6. Each block is considered in two classes as ‘LII-block’ and ‘NI-block’. Manually labelled blocks are used to train the system. The output of the system during testing is ‘LII-block’ and ‘non-LI-block’. Coordinates of LI interface is recorded for LD estimation.
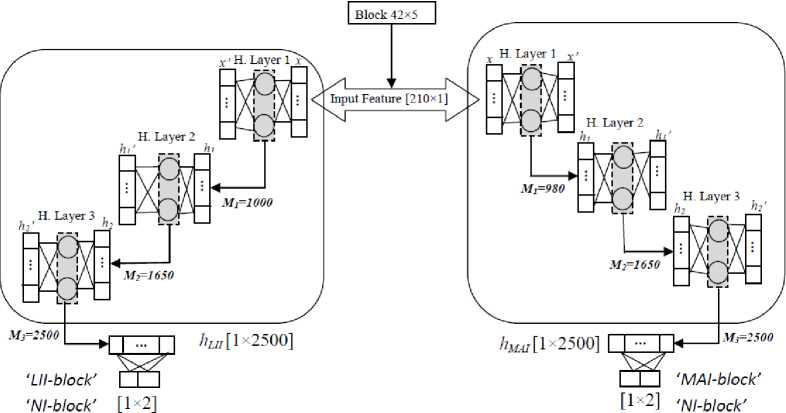
Fig. 5. Architecture of 3 hidden layers ELM-AE systems for LII and MAI detection in the far wall.
-
IV. Results and performance
The proposed representational ELM-AE network for localization of ROI in the ultrasound frame and detection of arterial layers has been trained on the MATLAB 16 and tested on the same. The specification of PC is as Intel Core i7 processor at 3.60 GHz with 8 GB RAM. The classification performance of the network has been tested using different performance metrics like accuracy, specificity, and sensitivity. These metrics are defined as performance related to the classification capability of the system. Metrics are mathematically presented as:
Accuracy =
TP+TN
TP+TN+FP+FN
Specificity = TN(9)
7 TN+FP
Sensitivity = TP(10)
TP+FN where TP, FP, TN and FN presents true positive, false positive, true negative, and false negative respectively.
Far wall ROI Localization
The ROI localization method shows high accuracy and blocks are classified in ROI-block and non-ROI-block during testing of proposed ELM-AE network. A total of 790 ultrasound frames are used in experiment out of which 553 frames are kept for raining and the remaining 237 frames for testing. The system is tested with 42660 blocks that contain 2133 ROI-block and remaining 40527 non-ROI block as each column has a single ROI-block. The ELM-AE network has correctly classified 2096 blocks as ROI-block, and 37 blocks are classified as ROI-block incorrectly.
Similarly, out of 40527, 40490 blocks is correctly classified as non-ROI-block, and 37 blocks are incorrectly classified as non-ROI-block. The confusion of Table 1, represents the testing output of the proposed network. Accuracy of the proposed system that classifies input blocks into ROI and non-ROI block is 99.82%. Specificity represents the system's ability to recognize the uniqueness of ROI and non-ROI and is 99.90%. The sensitivity of the system is 98.26%. The performance of the ROI system, proposed in this paper, is better than the existing system [16].
Table 1. Confusion matrix of the ELM-AE based ROI extraction system
|
Original class |
Predicted class |
|
|
ROI-block |
Non-ROI-block |
|
|
ROI-block |
2096 |
37 |
|
Non-ROI-block |
37 |
40490 |
Near-wall ROI Localization
Near-wall ROI localization is trained with labelled blocks containing LII of near-wall and tested with the blocks of the image data set the same as for far wall ROI.
The system classifies each block as ‘ROI-block' and ‘non-ROI-block'. The testing data contains 2133 ‘ROI-blocks’ and 40527 ‘non-ROI-blocks'. The system has correctly classified 2075 blocks as ROI, and 58 blocks are incorrectly classified as ROI blocks. Similarly, out of 40527, 40469 blocks is correctly classified as non-ROI-block, and 58 blocks are incorrectly classified as non-ROI-block. A confusion matrix represents the performance of the system in Table 2. Accuracy of the proposed system that classifies input blocks into ROI and non-ROI block is 99.72%. Specificity represents the system's ability to recognize the uniqueness class ROI and non-ROI and is 99.85%. The sensitivity of the system is 97.28%.
LI and MA detection in the far wall
Two multi-layers ELM-AE systems for arterial layer detection is the part of the proposed methods (Fig. 3).
Table 2. Confusion matrix of the ELM-AE based near wall ROI detection system
|
Original class |
Predicted class |
|
|
ROI-block |
Non-ROI-block |
|
|
ROI-block |
2075 |
58 |
|
Non-ROI-block |
58 |
40469 |
The whole ROI is also divided into the overlapping block of size 5 × 42, where each next block two rows common to the previous block. The ROI region is categorized into two basic types: LII-block (lumen-intima interface block), and NI-block (non-interface block) by the first system and another two classes: MAI-block (media-adventitia interface block) and NI-block (noninterface block) by the other system. The first hidden layers have 1000 neurons that make its feature sparse and second hidden layer has 2500 neurons. All the blocks corresponding to ROI of 25 testing image frames are passed to the first ELM-AE system that classifies it into ‘LII-block’ and ‘NI-block’. Coordinates, corresponding to the 225 ‘LII-blocks' are recorded. The same set of blocks are passed to the second ELM-AE system to classify it into ‘MAI-block' and ‘NI-block'. The coordinates, corresponding to the ‘MAI-block' is recorded.
LI detection in near-wall
A multi-layer ELM-AE system is defined for LI interface detection at the near wall and total neurons at hidden layers, and the regression parameter is exhaustively searched for optimal results (Fig. 6). It has a similar structure and number of hidden neurons as the previous system for LI and MA interface detection. For testing of the system ROI, the same 25 images are considered as in LI and MA interface detection method at far wall. Out of 4247 blocks of neighbourhood pixels, 225 are classified as ‘LII-block’ and coordinates corresponding to the centre pixel of the blocks are recorded.
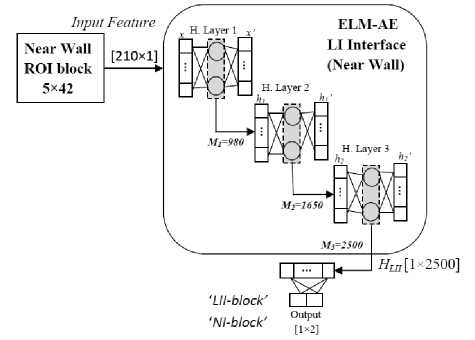
Fig. 6. Architecture of 3 hidden layers ELM-AE systems for LII detection in the near wall.
IMT and LD Measurement
Once, the coordinates of the arterial wall boundary are recorded, its distance is measured using mean absolute difference metrics [20]. It is one of the most used methods for IMT and LD measurement if the same numbers of coordinate in both the contours are available. It uses the concept of vertical difference along the longitudinal axis of the artery. The mathematical formulation of MAD is defined as follows:
IMT mad = ^ Z □ LII ( * ) - MAI ( * )l (11)
LD MAD = ^Z N i l LII ( * ) nearwall — MAI ( * ) farwall l ^
Where N presents, the number of points corresponding to the whole length of the image and x is the points starting from 1 to N.
We have measured the IMT for each automatically segmented image frame using MAD that is the distance from MA interface to LI interface. It is observed that the IMT has different values for sequence images. The temporal values (max/min) of the IMT are recorded. For obtaining the average value of a sequence of 25 images, all the boundary points corresponding to 225 blocks of 25 images are considered together, and IMT was measured using Eq. 11. The average value of the IMT in a sequence of 25 images is 0.57 ±0.05 mm in four times repeated experiment of automated detection of LII and MAI coordinates. The maximum and minimum value of the IMT is measured as 0.61 ±0.40 mm and 0.52 ±0.05 mm, respectively. We have summarised the results of IMT in Table 3, along with existing methods. The absolute error of estimated with respect to ground truth is shown in Table 3. The proposed, overlapping block-based system outperforms in ROI detection to [18, 19]. However, IMT estimation underperforms with some existing method [18, 21, 22].
We have measured LD of the CCA with MAD metrics [20]. The coordinates of the LI interface in far and nearwall has already extracted in ‘LI and MA detection in far wall' sub-section and ‘LII detection in near-wall' subsection respectively. LD is measured between the equal number of points present at the far wall and corresponding points present at near wall of the CCA using Eq. 12. LD value also varies in the sequence of an image frame of the cardiac cycle. It is measured for 25 images and value is recorded for individual images. LD has temporal value in the cardiac cycle and its maximum and the minimum value are measured as 6.25 ±0.85 and 5.71 ±0.15, respectively. The average value of the automated method is measured by considering all the coordinates corresponding to 225 ROI of 25 images, of LII in near-wall and LII in the far-wall, in a single calculation using Eq. 12.
Arterial Elasticity Estimation
As IMT and arterial elasticity have a strong association with atherosclerosis disease [5]. Once arterial parameters with its temporal values are estimated, we calculated arterial elasticity using Eq. 7. The values of automatically estimated arterial parameters along with ground truth are shown in Table 4.
Table 3. Comparison of IMT measurement by different techniques.
|
SN |
Reference, year |
IMT (mm) Ground truth |
IMT (mm) Method |
Error (µm) IMT |
Number of Images |
Fully Automatic |
|
1 |
[23], 2000 |
0.88±0.25 |
0.93±0.25 |
42±25 |
50 |
No |
|
2 |
[24], 2001 |
0.92±0.19 |
0.92±0.20 |
15.6±4.2 |
20 |
No |
|
3 |
[25], 2008 |
0.56±0.14 |
0.57±0.14 |
10±35 |
150 |
No |
|
4 |
[26], 2010 |
0.92±0.30 |
0.75±0.39 |
54±35 |
182 |
Yes |
|
5 |
[20], 2012 |
0.63±0.14 |
0.65±0.16 |
38.1±16.4 |
50 |
No |
|
6 |
[28], 2012 |
0.67±0.14 |
0.61±0.15 |
95.0±61.5 |
100 |
No |
|
7 |
[21], 2013 |
0.60±0.10 |
0.60±0.11 |
- |
40 |
Yes |
|
8 |
[29], 2014 |
0.64±0.19 |
0.61±0.19 |
37.6±25 |
60 |
Yes |
|
9 |
[22], 2015 |
- |
- |
13.8±32 (differences) |
46 |
Yes |
|
10 |
[19], 2015 |
0.62±0.19 |
0.60±0.19 |
49.9±50 |
55 |
Yes |
|
11 |
[18], 2016 |
0.62±0.18 |
0.62±0.17 |
27.3±21 |
67 |
Yes |
|
12 |
Proposed Method |
0.55±0.15 |
0.57±0.05 |
22±35 |
100 |
Yes |
Table 4. Carotid artery parameters and Young modulus of elasticity parameter for analysed data
|
SN |
Parameter |
Ground Truth |
Estimated |
Error |
|
1 |
Maximum diameter, Dmax (mm) |
5.60±0.30 |
5.71±`0.15 |
91×10-3 |
|
2 |
Minimum diameter, D min (mm) |
6.20±0.10 |
6.25±0.85 |
82×10-3 |
|
3 |
Maximum IMT, IMTmax (mm) |
0.60±0.15 |
0.61±0.40 |
20×10-3 |
|
4 |
Minimum IMT, IMT min (mm) |
0.50±0.25 |
0.52±0.05 |
23×10-3 |
|
5 |
Systolic Blood Pressure, P s (mmHg) |
121 |
- |
- |
|
6 |
Diastolic Blood Pressure, P d (mmHg) |
80 |
- |
- |
|
7 |
Pulse Pressure, PP (mmHg) |
41 |
- |
- |
|
8 |
Young’s modulus of elasticity, Ym (kPa) |
238.95 |
248.57 |
9.62 |
1 k p a = 7.6 mm h g .
-
V. Discussion
In this work, a deep learning machine based CCA segmentation method is proposed. LII and MAI interface of far wall defines IMT, and LII at near wall and LII at far wall define LD of the CCA. IMT and LD are estimated in the sequence of the arterial frame, which provides temporal values as in Table 4. Temporal values of IMT and LD are directly used to estimate Young's modulus of elasticity of CCA using Eq. 7.
There are different existing methods of CCA segmentation using carotid ultrasound [30]. These existing methods can be categorized in two ways: (i) working approach and (ii) fundamental technique used to CCA segmentation. The approach of working is fully automatic [19, 26] that does not require any manual interaction and semi-automatic [18, 20, 23, 24, 26] which require manual interaction in intermediate steps. All earlier method can also be categorised based on techniques. Arterial layers are delineated by analysing the intensity distribution, edge-detection and gradient-based methods. A combination of dynamic programming and properties of edge-based approach defines arterial layer followed by IMT and LD [31, 32]. Active contours and its variation based methods have better performance [22, 28]. There are techniques based on statistical modelling [11, 14], Haugh transforms [15, 22] and Nakagami distribution [33]. Recently, most of the techniques are based on deep learning methods [18, 19, 29, 34]. Menchen-Lara et al. has used ELM-AE with SLFN and estimated IMT, but the performance of the system is still below the active contour-based method proposed by the same group [22]. A detailed analysis of the techniques is covered in the review article by Loizou [35] and Kumar et al. [30].
In this paper, the overall architecture of CCA segmentation and IMT/LD measurement is presented in Fig. 3. There are five basic steps in the proposed methods. An automatic image cropping method identifies the coordinate and performs image crop operation followed by noise removal. ROI localization is done by defining an overlapping block, and each column in the image has only one ROI block that is classified with a maximum match in the column. Performance of ROI localization of the proposed system is better than other learning-based methods and tradition methods [18, 19, 20]. IMT detection has been done with overlapping block-wise neighbourhood pixels approach that locate LII and MAI accurately in the far wall ROI and LII in the near wall ROI. Its performance is better than many approaches [18, 19, 29]. Measurement of IMT and LD is made with the MAD method using Eq. 11 and Eq. 12. Young’s modulus of elasticity is defined in terms of pulse pressure and temporal value of IMT and LD as in Eq. 7.
Here, throughout the paper, it is clear that each step of the proposed system is carried out without user interaction. Our method is a fully automatic IMT estimation followed by calculation of Young's modulus of elasticity. ROI localization in the proposed method carried out in each frame and 9 such ROI block are kept together to estimate IMT and LD in an image. There is more than one block in a column which contains arterial layer, but only one block is selected from the column with a maximum match. Our overall system has both the biomarkers (IMT and elasticity) of atherosclerosis disease and can be directly used in risk assessment.
-
VI. Conclusion
This paper accomplished two major objectives (a) region of interest localization and (b) lumen-intima interface and media-adventitia interface detection at the far wall. The proposed overlapping the block based methods reduces the errors in ROI localization. It ensures that only one block in a column will represent the ROI. It is detected by the trained system with ground truth and have optimal feature match in a column. Optimal classification of ROI reduces overall errors in IMT measurements. Overlapping blocks in pixels classification of LII and MAI in ROI also ensure about the unique detection of the interface in an ROI region. Unique pixel corresponding to a column reduces the ambiguity in measurement of IMT and LD. It is a fully automatic system and extracts boundaries of LII and MAI with high accuracy. The error estimated in IMT measurement with respect to ground truth is 22±35 (µm). The average estimated value of IMT is 0.57±0.05 mm, and the ground truth value of IMT provided by the doctor is 0.55±0.15 mm. Young's modulus of elasticity of the artery is estimated as 248.57 kPa. The proposed system may be improved in future by de-noising the input frame keeping its original features. Different other functional parameters can be computed followed by risk assessment.
Acknowledgment
The authors wish to thank Dr. Prerna Agrawal, a radiologist at Prerna diagnostic centre Kurukshetra, India. She has provided medical data along with measured manually ground truth, to perform experiment.
References Arterial Parameters and Elasticity Estimation in Common Carotid Artery Using Deep Learning Approach
- D. Mozaffarian, E. J. Benjamin, A. S. Go, D. K. Arnett, M. J. Blaha, M. Cushman, and et al. “Heart disease and stroke statistics-2016 update a report from the American Heart Association” American Heart Association: Circulation, vol. 31, No. 4, pp.e38-e48, 2016.
- J. Scott, “Pathophysiology and biochemistry of cardiovascular disease” Curr Opin Genet Dev. Vol. 14, No. 3, pp. 271-279, 2004.
- Q. Baoge, and Q. Tao, “Causes of changes in carotid intima-media thickness: a literature review” Cardiovascular ultrasound. Vol. 13, No. 1 p.46, Dec 2015.
- S. Lechareas, A. Yanni, S. Golemati, A. Chatziioannou, and D. Perrea, “Ultrasound and biochemical diagnostic tools for the characterization of vulnerable carotid atherosclerotic plaque” Ultrasound Med Biol. Vol. 42, No. 1, pp. 31-43, Jan 2015.
- M. E. Boesen, D. Singh, B. K. Menon, and R. Frayne, “A systematic literature review of the effect of carotid atherosclerosis on local vessel stiffness and elasticity”. Atherosclerosis. Vol. 243, No. 1, pp. 211-222. Nov 2015.
- M. Seçil, C. Altay, A. Gülcü, H. Çeçe, A. Y. Göktay, and O. Dicle, “Automated measurement of intima-media thickness of carotid arteries in ultrasonography by computer software” Diagnostic and Interventional Radiology, Vol. 11, No. 2, p. 105, Jan 2005.
- N. A. Shirwany, and M. Zou, “Arterial stiffness: a brief review” Acta Pharmacol Sin. Vol. 31, No. 10, pp. 1267-1276, Oct 2010.
- R. H. Selzer, W. J. Mack, P. L. Lee, H. Kwong-Fu, and H. N. Hodis, “Improved common carotid elasticity and intima-media thickness measurements from computer analysis of sequential ultrasound frames”, Atherosclerosis. Vol. 154, No. 1, pp. 185-193, Jan 2001.
- E. Messas, M. Pernot, and M. Couade, “Arterial wall elasticity: State of the art and future prospects”, Diagnostic and interventional imaging. Vol. 94, No. 5, pp. 561-569, May 2013.
- R. Weinstein, “Noninvasive carotid duplex ultrasound imaging for the evaluation and management of carotid atherosclerotic disease”, Hematol Oncol Clin North Am. Vol. 6, No. 5, pp. 1131-1139, Oct 1992.
- G-B. Huang, Q-Y. Zhu, and C-K. Siew “Extreme learning machine: Theory and applications” Neurocomputing. Vol. 70, No. 6, pp. 489-501, Dec 2006.
- G. R. Feng, G-B Huang, Q. P. Lin, and R. Gay, “Error minimized extreme learning machine with hidden nodes and incremental learning”. IEEE Trans Neural Netw Vol. 20, No. 8, pp. 1352-1357, Aug 2013.
- G-B. Huang, X. Ding, and H. M. Zhou, “Optimization method based extreme learning machine for classification” Neurocomputing. Vol. 74, No. 12, pp. 155–163, Dec 2010.
- G. B. Huang, H. Zhou, X. Ding, and R. Zhang, “Extreme learning machine for regression and multiclass classification”, IEEE Trans. Syst. Man Cybern. Part B: Cybern. Vol. 42, No. 2, pp. 513-529, Oct 2011.
- Y. Bengio, A. Courville, and P. “Representation learning: a review and new perspectives” IEEE Trans Pattern Anal Mach Intell. Vol. 35, No. 8, pp. 1798-828, Aug 2013.
- L.L.C. Kasun, H. Zhou, G.-B. Huang, and C. M. Vong, “Representational learning with extreme learning machine for big data”, IEEE Intell. Syst. Vol. 28, No. 6, pp. 31-34, Dec 2013.
- H. Obeid, V. Ouedraogo, and M. Hallab, “Arterial Stiffness: A New Biomarker to be Measured”, Journal of Archives in Military Medicine. Vol. 5, No. 1, Feb 2017.
- R. M. Menchón-Lara, J. L. Sancho-Gómez, and A. Bueno-Crespo, “Early-stage atherosclerosis detection using deep learning over carotidultrasound images” Applied Soft Computing. Vol. 49, pp. 616-628, Dec 2016.
- R. M. Menchón-Lara and J. L. Sancho-Gómez, “Fully automatic segmentation of ultrasound common carotid artery images based on machine learning” Neurocomputing. Vol. 151, pp.161-167, Mar 2015.
- Q. Li, W. Zhang, X. Guan, Y. Bai, and J. Jia, “An improved approach for accurate and efficient measurement of common carotid artery intima-media thickness in ultrasound images”, BioMed research international, 2014.
- D.E. Ilea, C. Duffy, L. Kavanagh, A. Stanton, and P. F. Whelan, “Fully automated segmentation and tracking of the intima media thickness in ultrasound video sequences of the common carotid artery”, IEEE transactions on ultrasonics, ferroelectrics, and frequency control. Vol. 60, No. 1, pp. 158-177, Dec 2012.
- M. C. Bastida-Jumilla, R. M. Menchón-Lara, J. Morales-Sánchez, R. Verdú-Monedero, J. Larrey-Ruiz, and J. L. Sancho-Gómez, “Frequency-domain active contours solution to evaluate intima–media thickness of the common carotid artery”, Biomedical Signal Processing and Control. Vol. 16, pp. 68-79, Feb 2015.
- Q. Liang, I. Wendelhag, J. Wikstrand, and T. Gustavsson, “A multi scale dynamic programming procedure for boundary detection in ultrasonic artery images”, IEEE Trans. Med. Imaging. Vol. 19, No. 2, pp. 127-142, Feb 2000.
- C. Liguori, A. Paolillo, and A. Pietrosanto, “An automatic measurement system for the evaluation of carotid intima-media thickness”, IEEE Transactions on instrumentation and measurement. Vol. 50, No. 6, pp. 1684-1691, Dec 2001.
- F. Faita, V. Gemignani, E. Bianchini, C. Giannarelli, L. Ghiadoni, and M. Demi, “Real-time measurement system for evaluation of the carotid intima-media thickness with a robust edge operator”, J. Ultrasound Med. Vol. 27, No. 9, pp. 1353–1361, Sep 2008.
- F. Molinari, G. Zeng, and J. S. Suri, “Intima-media thickness: setting a standard for a completely automated method of ultrasound measurement”, IEEE transactions on ultrasonics, ferroelectrics, and frequency control. Vol. 57, No. 5, pp. 1112-1124, May 2010.
- X. Xu, Y. Zhou, X. Cheng, E. Song, and G. Li, “Ultrasound intima-media segmentation using Hough transform and dual snake model”, Comput. Med. Imaging Graph. Vol. 36, No. 3, pp. 248-258, Apr 2012.
- S. Petroudi, C. Loizou, M. Pantziaris, and C. Pattichis, “Segmentation of the common carotid intima-media complex in ultrasound images using active contours”, IEEE Trans. Biomed. Eng. Vol. 59, No. 11, pp. 3060-3069, Nov 2012.
- R.M. Menchón-Lara, M. C. Bastida-Jumilla, J. Morales-Sánchez, and J. L. Sancho-Gómez, “Automatic detection of the intima-media thickness in ultrasound images of the common carotid artery using neural networks”. Medical and biological engineering & computing. Vol. 52, No. 2, pp. 169-181, Feb 2014.
- P.K. Kumar, T. Araki, J. Rajan, J. R. Laird, A. Nicolaides, and J. S. Suri, “State-of-the-art review on automated lumen and adventitial border delineation and its measurements in carotid ultrasound”, Computer methods and programs in biomedicine. Vol. 163, pp. 155-168, Sep 2018.
- Q. Liang, I. Wendelhag, J. Wikstrand, and T. Gustavsson, “A multiscale dynamic programming procedure for boundary detection in ultrasonic artery images”, IEEE Transactions on medical imaging. Vol. 19, No. 2, pp. 127-142, Feb 2000.
- A.C. Rossi, P.J. Brands, and A. P. Hoeks, “Automatic localization of intimal and adventitial carotid artery layers with noninvasive ultrasound: a novel algorithm providing scan quality control”, Ultrasound in medicine & biology. Vol. 36, No. 3, pp. 467-479, Mar 2010.
- F. Destrempes, J. Meunier, M. F. Giroux, G. Soulez, and G. Cloutier, “Segmentation in ultrasonic B-mode images of healthy carotid arteries using mixtures of Nakagami distributions and stochastic optimization”, IEEE Transactions on Medical Imaging. Vol. 28, No. 2, p.215, Feb 2009.
- J. Shin, N. Tajbakhsh, R. Todd Hurst, C. B. Kendall, and J. Liang, “Automating carotid intima-media thickness video interpretation with convolutional neural networks” In Proceedings of the IEEE Conference on Computer Vision and Pattern Recognition. pp. 2526-2535, 2016.
- C.P. Loizou, “A review of ultrasound common carotid artery image and video segmentation techniques”, Medical & biological engineering & computing. Vol. 52, No. 12, pp. 1073-1093, Dec 2014.
